University Tax Lodgement Analysis: BUS708 Statistics Report
VerifiedAdded on 2020/05/16
|13
|2166
|214
Report
AI Summary
This report analyzes tax lodgement preferences in Australia, drawing on data from the Australian Taxation Office (ATO) and a subset of 1000 individuals from the 2013-2014 dataset. The study investigates the proportion of people preferring tax agents over self-lodgement, examining factors such as age group, total income, and total deductions. The analysis includes both Australian residents and international students, employing statistical methods like confidence intervals, chi-square tests, and regression analysis. Key findings reveal a strong preference for tax agents across all age groups and income levels, with a significant association between age range and lodgement method. Furthermore, the report establishes a positive correlation between total income and total deduction amounts, providing insights into the financial aspects of tax lodgement. The report also provides insights into the preferences of international students. The report concludes by emphasizing the importance of tax agents and the factors influencing tax filing behavior.

Running Head: BUS708 STATISTICS AND DATA ANALYSIS
BUS708 Statistics and Data Analysis
Name of the Student
Name of the University
Author Note
BUS708 Statistics and Data Analysis
Name of the Student
Name of the University
Author Note
Paraphrase This Document
Need a fresh take? Get an instant paraphrase of this document with our AI Paraphraser
1BUS708 STATISTICS AND DATA ANALYSIS
Table of Contents
Introduction.................................................................................................................................................2
Lodgement Method: Dataset 1....................................................................................................................2
Lodgement Method: Dataset 2....................................................................................................................3
Lodgement Method and Age Group............................................................................................................5
Lodgement Method and Total Income Amount..........................................................................................7
Total Income Amount and Total Deduction Amount...................................................................................9
Conclusion.................................................................................................................................................10
References.................................................................................................................................................11
2BUS708 STATISTICS AND DATA ANALYSIS
Introduction
Lodgement of tax returns is an important thing that every individual belonging to any nation
must do. The same thing has to be done by the people in Australia. A lot of people fall under the income
range of taxable income and they have to lodge their tax returns. This can be in two different ways in
Australia. They can Lodge with the help of registered tax agents or can prepare their lodgements by
themselves. Previous studies showed that people prefer appointing tax agents for the lodgements
(Braithwaite 2017). The main aim of this study is to evaluate the proportion of people preferring tax
agents over themselves. This proportion will be tested on the basis of various factors such as age group,
Total income and total deduction.
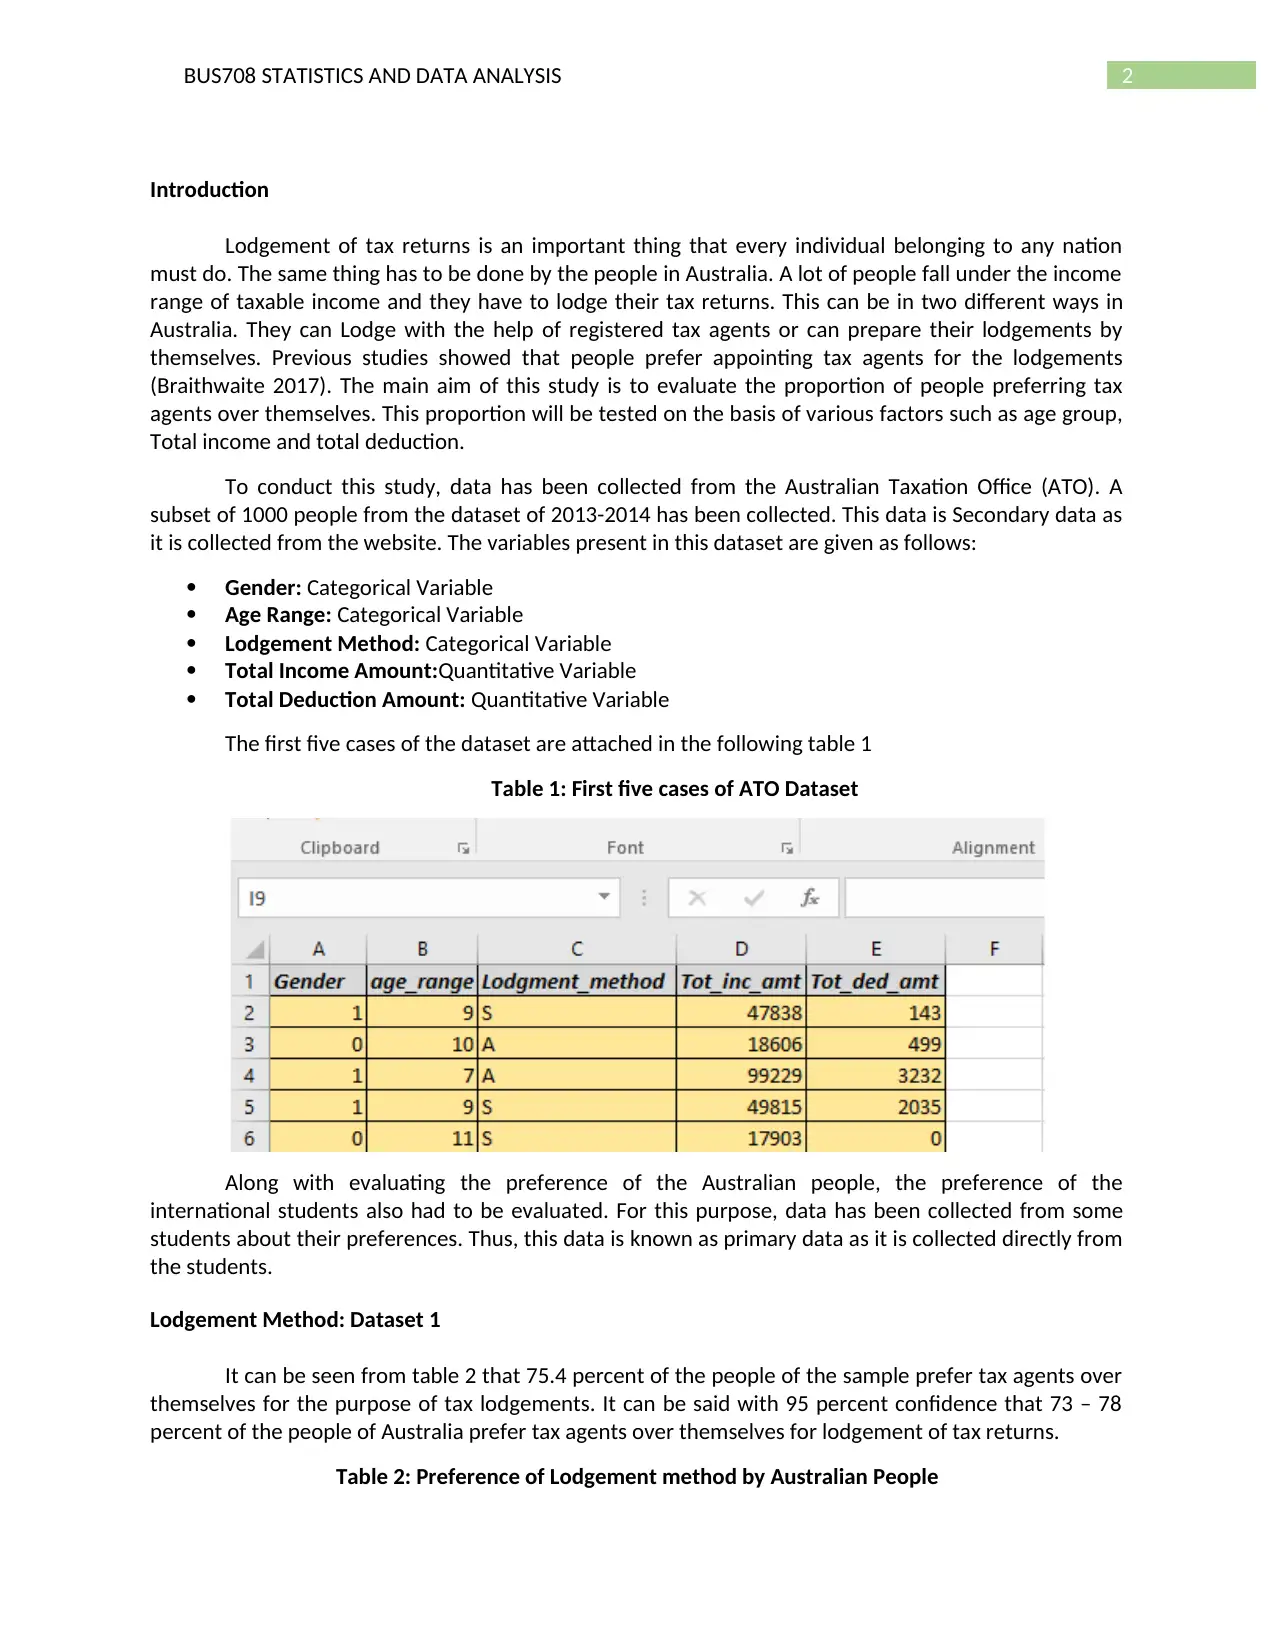
To conduct this study, data has been collected from the Australian Taxation Office (ATO). A
subset of 1000 people from the dataset of 2013-2014 has been collected. This data is Secondary data as
it is collected from the website. The variables present in this dataset are given as follows:
Gender: Categorical Variable
Age Range: Categorical Variable
Lodgement Method: Categorical Variable
Total Income Amount:Quantitative Variable
Total Deduction Amount: Quantitative Variable
The first five cases of the dataset are attached in the following table 1
Table 1: First five cases of ATO Dataset
Along with evaluating the preference of the Australian people, the preference of the
international students also had to be evaluated. For this purpose, data has been collected from some
students about their preferences. Thus, this data is known as primary data as it is collected directly from
the students.
Lodgement Method: Dataset 1
It can be seen from table 2 that 75.4 percent of the people of the sample prefer tax agents over
themselves for the purpose of tax lodgements. It can be said with 95 percent confidence that 73 – 78
percent of the people of Australia prefer tax agents over themselves for lodgement of tax returns.
Table 2: Preference of Lodgement method by Australian People
Introduction
Lodgement of tax returns is an important thing that every individual belonging to any nation
must do. The same thing has to be done by the people in Australia. A lot of people fall under the income
range of taxable income and they have to lodge their tax returns. This can be in two different ways in
Australia. They can Lodge with the help of registered tax agents or can prepare their lodgements by
themselves. Previous studies showed that people prefer appointing tax agents for the lodgements
(Braithwaite 2017). The main aim of this study is to evaluate the proportion of people preferring tax
agents over themselves. This proportion will be tested on the basis of various factors such as age group,
Total income and total deduction.
To conduct this study, data has been collected from the Australian Taxation Office (ATO). A
subset of 1000 people from the dataset of 2013-2014 has been collected. This data is Secondary data as
it is collected from the website. The variables present in this dataset are given as follows:
Gender: Categorical Variable
Age Range: Categorical Variable
Lodgement Method: Categorical Variable
Total Income Amount:Quantitative Variable
Total Deduction Amount: Quantitative Variable
The first five cases of the dataset are attached in the following table 1
Table 1: First five cases of ATO Dataset
Along with evaluating the preference of the Australian people, the preference of the
international students also had to be evaluated. For this purpose, data has been collected from some
students about their preferences. Thus, this data is known as primary data as it is collected directly from
the students.
Lodgement Method: Dataset 1
It can be seen from table 2 that 75.4 percent of the people of the sample prefer tax agents over
themselves for the purpose of tax lodgements. It can be said with 95 percent confidence that 73 – 78
percent of the people of Australia prefer tax agents over themselves for lodgement of tax returns.
Table 2: Preference of Lodgement method by Australian People
⊘ This is a preview!⊘
Do you want full access?
Subscribe today to unlock all pages.
Trusted by 1+ million students worldwide
3BUS708 STATISTICS AND DATA ANALYSIS
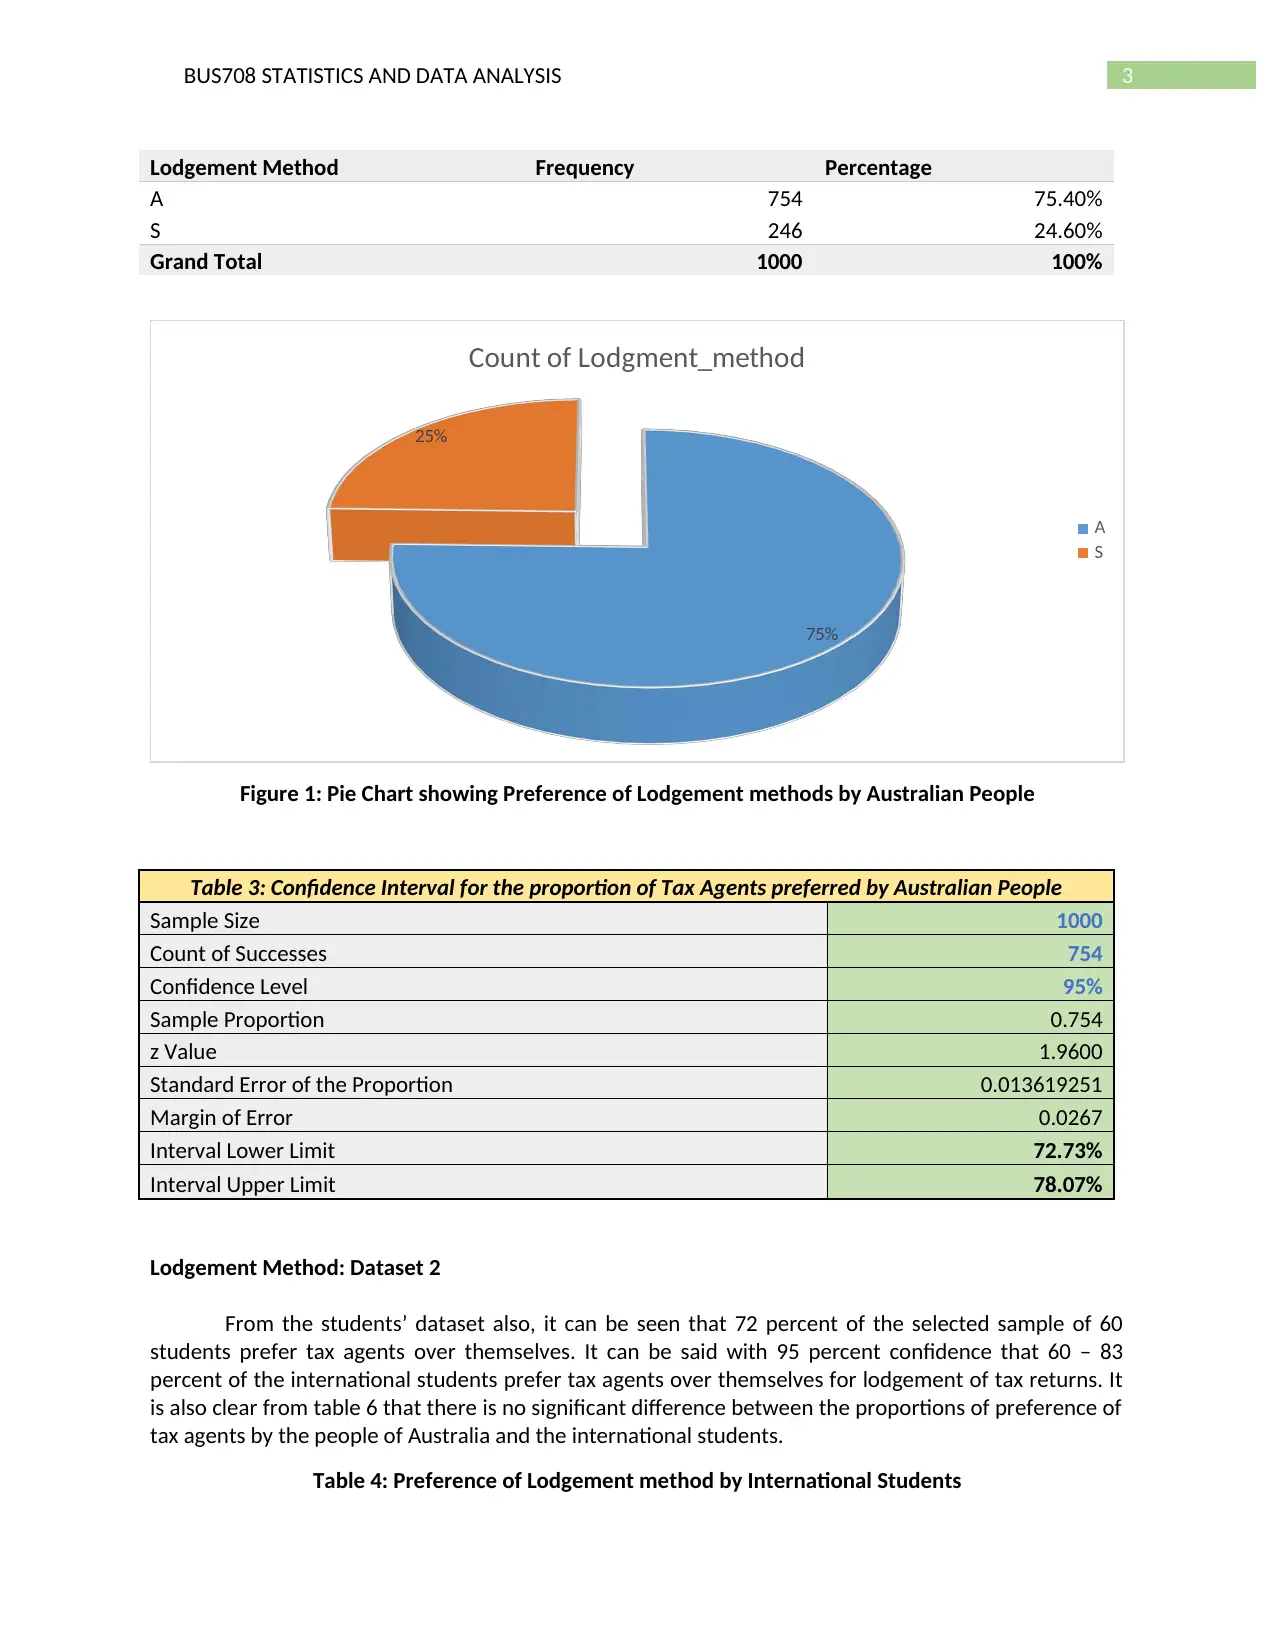
Lodgement Method Frequency Percentage
A 754 75.40%
S 246 24.60%
Grand Total 1000 100%
75%
25%
Count of Lodgment_method
A
S
Figure 1: Pie Chart showing Preference of Lodgement methods by Australian People
Table 3: Confidence Interval for the proportion of Tax Agents preferred by Australian People
Sample Size 1000
Count of Successes 754
Confidence Level 95%
Sample Proportion 0.754
z Value 1.9600
Standard Error of the Proportion 0.013619251
Margin of Error 0.0267
Interval Lower Limit 72.73%
Interval Upper Limit 78.07%
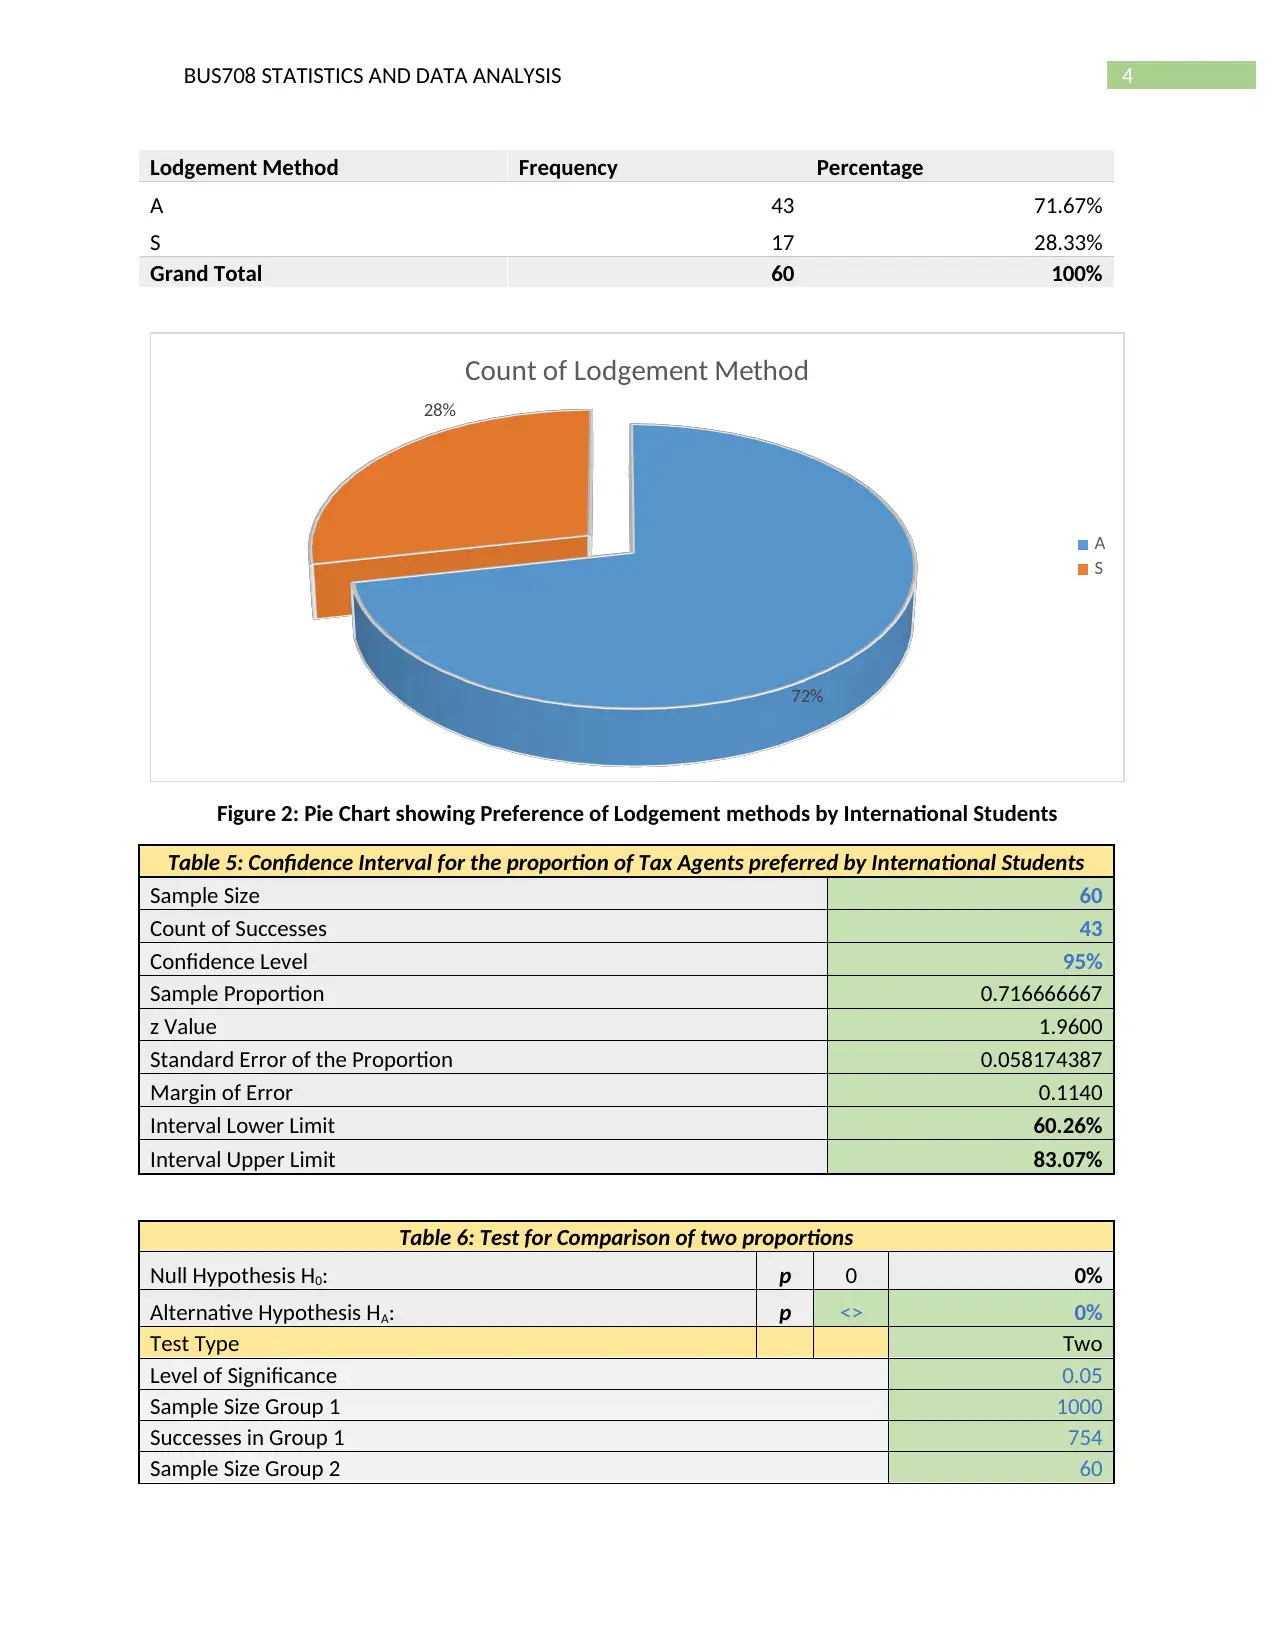
Lodgement Method: Dataset 2
From the students’ dataset also, it can be seen that 72 percent of the selected sample of 60
students prefer tax agents over themselves. It can be said with 95 percent confidence that 60 – 83
percent of the international students prefer tax agents over themselves for lodgement of tax returns. It
is also clear from table 6 that there is no significant difference between the proportions of preference of
tax agents by the people of Australia and the international students.
Table 4: Preference of Lodgement method by International Students
Lodgement Method Frequency Percentage
A 754 75.40%
S 246 24.60%
Grand Total 1000 100%
75%
25%
Count of Lodgment_method
A
S
Figure 1: Pie Chart showing Preference of Lodgement methods by Australian People
Table 3: Confidence Interval for the proportion of Tax Agents preferred by Australian People
Sample Size 1000
Count of Successes 754
Confidence Level 95%
Sample Proportion 0.754
z Value 1.9600
Standard Error of the Proportion 0.013619251
Margin of Error 0.0267
Interval Lower Limit 72.73%
Interval Upper Limit 78.07%
Lodgement Method: Dataset 2
From the students’ dataset also, it can be seen that 72 percent of the selected sample of 60
students prefer tax agents over themselves. It can be said with 95 percent confidence that 60 – 83
percent of the international students prefer tax agents over themselves for lodgement of tax returns. It
is also clear from table 6 that there is no significant difference between the proportions of preference of
tax agents by the people of Australia and the international students.
Table 4: Preference of Lodgement method by International Students
Paraphrase This Document
Need a fresh take? Get an instant paraphrase of this document with our AI Paraphraser
4BUS708 STATISTICS AND DATA ANALYSIS
Lodgement Method Frequency Percentage
A 43 71.67%
S 17 28.33%
Grand Total 60 100%
72%
28%
Count of Lodgement Method
A
S
Figure 2: Pie Chart showing Preference of Lodgement methods by International Students
Table 5: Confidence Interval for the proportion of Tax Agents preferred by International Students
Sample Size 60
Count of Successes 43
Confidence Level 95%
Sample Proportion 0.716666667
z Value 1.9600
Standard Error of the Proportion 0.058174387
Margin of Error 0.1140
Interval Lower Limit 60.26%
Interval Upper Limit 83.07%
Table 6: Test for Comparison of two proportions
Null Hypothesis H0: p 0 0%
Alternative Hypothesis HA: p <> 0%
Test Type Two
Level of Significance 0.05
Sample Size Group 1 1000
Successes in Group 1 754
Sample Size Group 2 60
5BUS708 STATISTICS AND DATA ANALYSIS
Successes in Group 2 43
Hypothesized Difference 0
Proportion Group 1 0.754
Proportion Group 2 0.716667
Average Proportion 0.751887
Difference in Two Proportions 0.037333
Z 0.650307
p-value 0.515494
Decision
Do not reject Ho
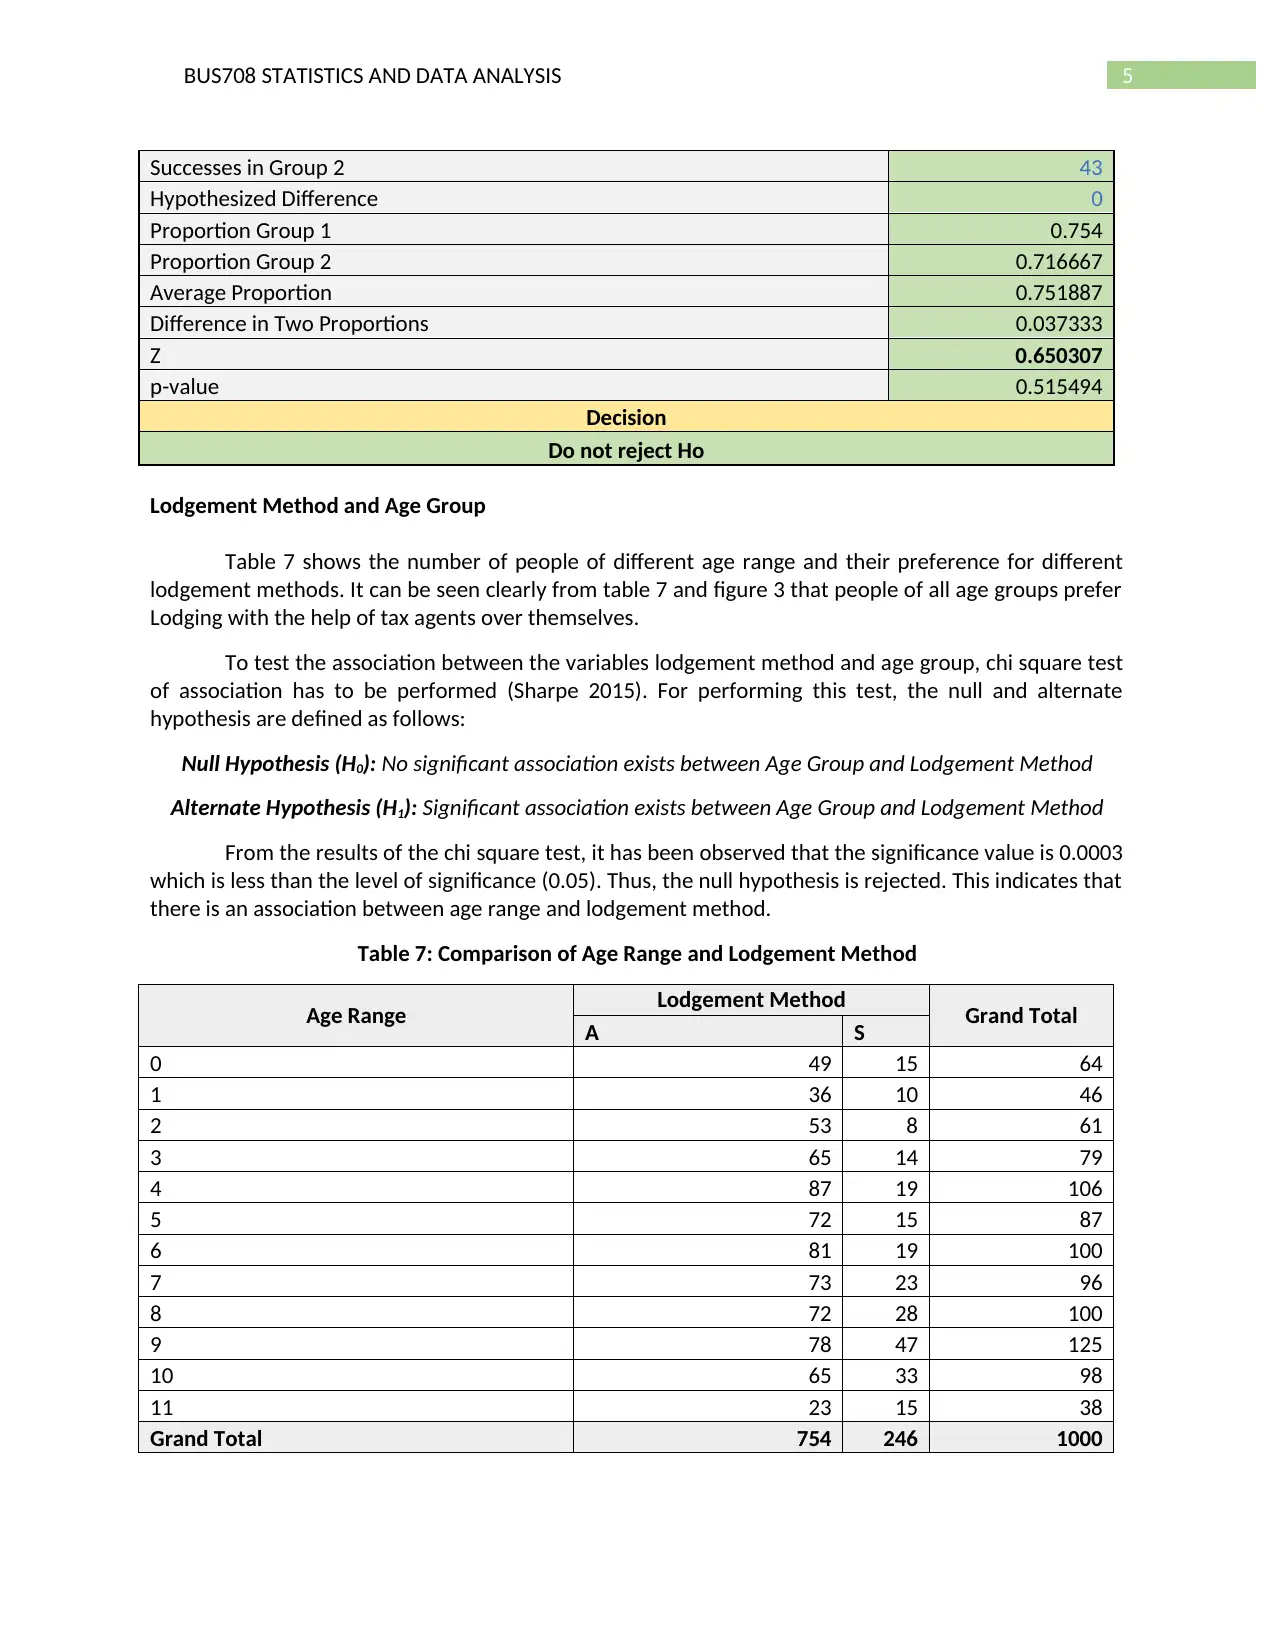
Lodgement Method and Age Group
Table 7 shows the number of people of different age range and their preference for different
lodgement methods. It can be seen clearly from table 7 and figure 3 that people of all age groups prefer
Lodging with the help of tax agents over themselves.
To test the association between the variables lodgement method and age group, chi square test
of association has to be performed (Sharpe 2015). For performing this test, the null and alternate
hypothesis are defined as follows:
Null Hypothesis (H0): No significant association exists between Age Group and Lodgement Method
Alternate Hypothesis (H1): Significant association exists between Age Group and Lodgement Method
From the results of the chi square test, it has been observed that the significance value is 0.0003
which is less than the level of significance (0.05). Thus, the null hypothesis is rejected. This indicates that
there is an association between age range and lodgement method.
Table 7: Comparison of Age Range and Lodgement Method
Age Range Lodgement Method Grand Total
A S
0 49 15 64
1 36 10 46
2 53 8 61
3 65 14 79
4 87 19 106
5 72 15 87
6 81 19 100
7 73 23 96
8 72 28 100
9 78 47 125
10 65 33 98
11 23 15 38
Grand Total 754 246 1000
Successes in Group 2 43
Hypothesized Difference 0
Proportion Group 1 0.754
Proportion Group 2 0.716667
Average Proportion 0.751887
Difference in Two Proportions 0.037333
Z 0.650307
p-value 0.515494
Decision
Do not reject Ho
Lodgement Method and Age Group
Table 7 shows the number of people of different age range and their preference for different
lodgement methods. It can be seen clearly from table 7 and figure 3 that people of all age groups prefer
Lodging with the help of tax agents over themselves.
To test the association between the variables lodgement method and age group, chi square test
of association has to be performed (Sharpe 2015). For performing this test, the null and alternate
hypothesis are defined as follows:
Null Hypothesis (H0): No significant association exists between Age Group and Lodgement Method
Alternate Hypothesis (H1): Significant association exists between Age Group and Lodgement Method
From the results of the chi square test, it has been observed that the significance value is 0.0003
which is less than the level of significance (0.05). Thus, the null hypothesis is rejected. This indicates that
there is an association between age range and lodgement method.
Table 7: Comparison of Age Range and Lodgement Method
Age Range Lodgement Method Grand Total
A S
0 49 15 64
1 36 10 46
2 53 8 61
3 65 14 79
4 87 19 106
5 72 15 87
6 81 19 100
7 73 23 96
8 72 28 100
9 78 47 125
10 65 33 98
11 23 15 38
Grand Total 754 246 1000
⊘ This is a preview!⊘
Do you want full access?
Subscribe today to unlock all pages.
Trusted by 1+ million students worldwide
6BUS708 STATISTICS AND DATA ANALYSIS
0 1 2 3 4 5 6 7 8 9 10 11
0
10
20
30
40
50
60
70
80
90
100
Age Group and Lodgement Method
A
S
Age Range
Frequency
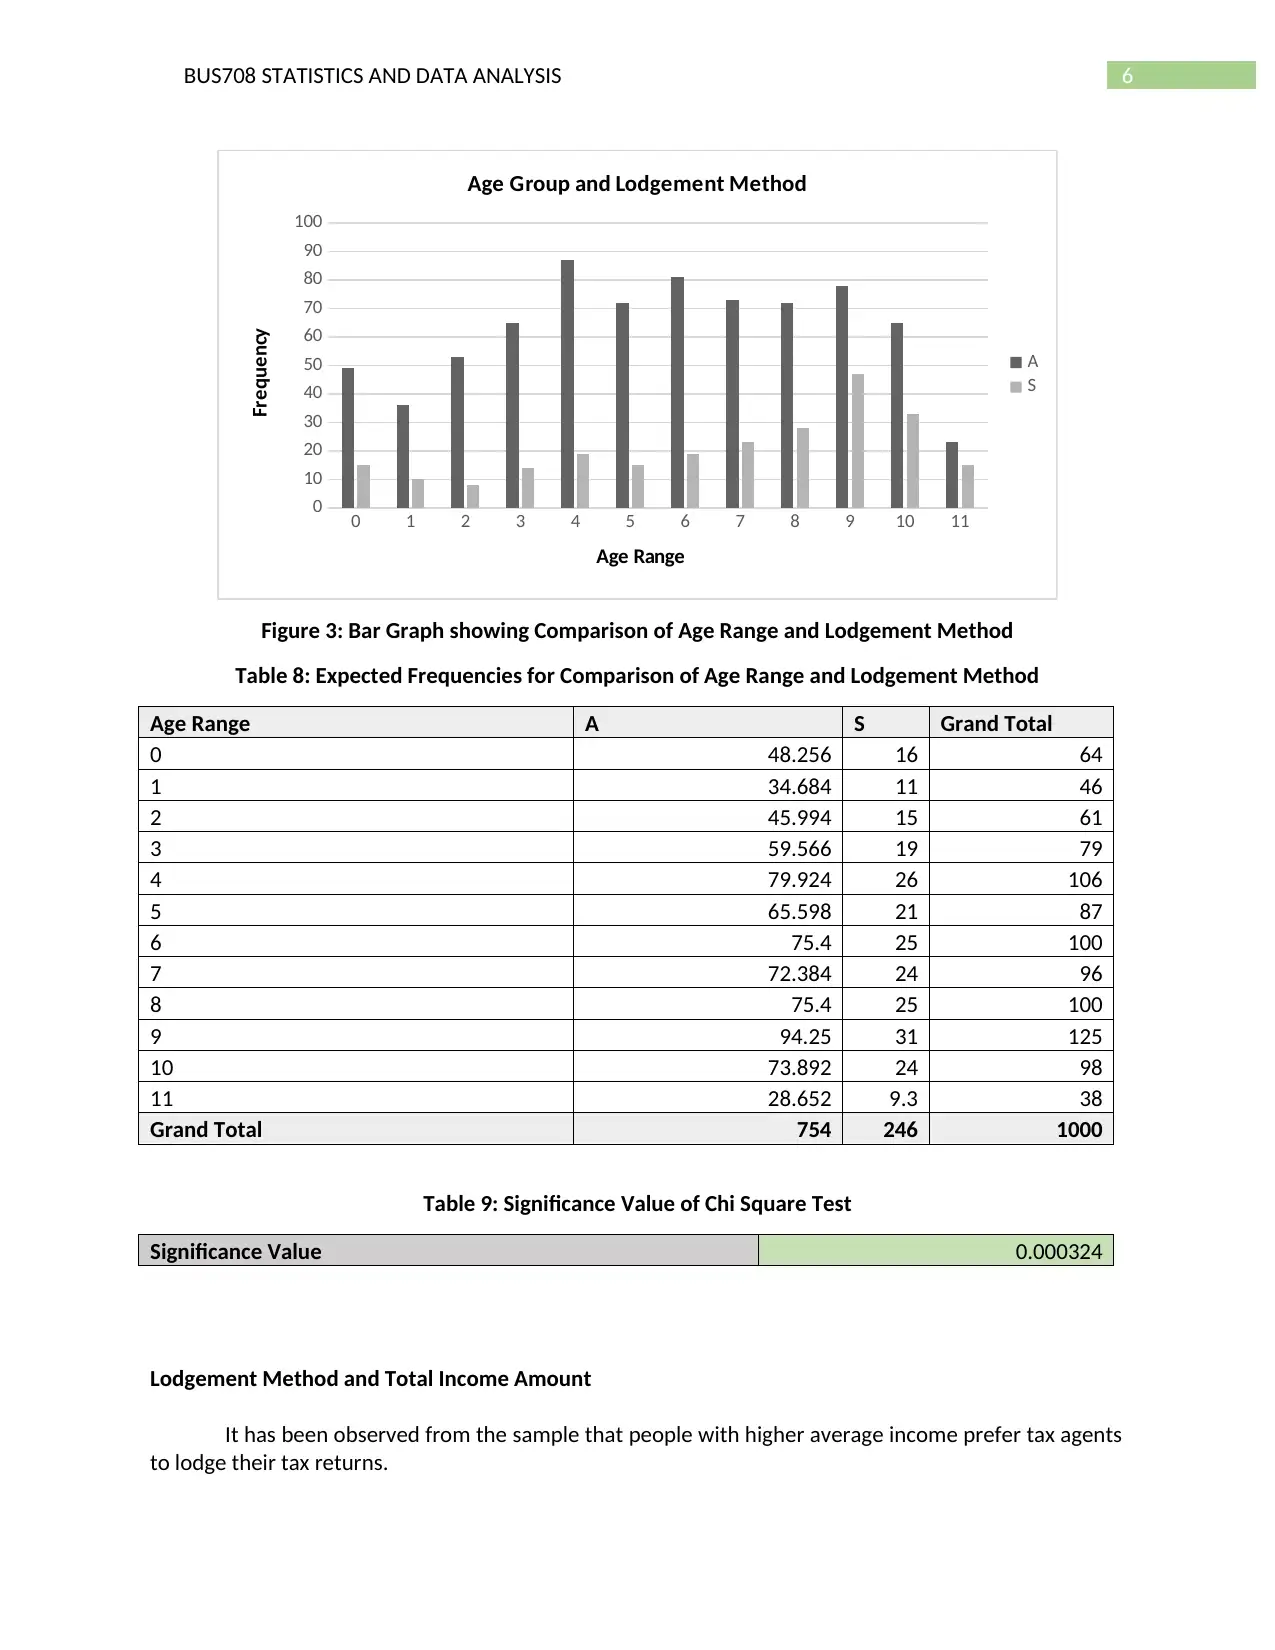
Figure 3: Bar Graph showing Comparison of Age Range and Lodgement Method
Table 8: Expected Frequencies for Comparison of Age Range and Lodgement Method
Age Range A S Grand Total
0 48.256 16 64
1 34.684 11 46
2 45.994 15 61
3 59.566 19 79
4 79.924 26 106
5 65.598 21 87
6 75.4 25 100
7 72.384 24 96
8 75.4 25 100
9 94.25 31 125
10 73.892 24 98
11 28.652 9.3 38
Grand Total 754 246 1000
Table 9: Significance Value of Chi Square Test
Significance Value 0.000324
Lodgement Method and Total Income Amount
It has been observed from the sample that people with higher average income prefer tax agents
to lodge their tax returns.
0 1 2 3 4 5 6 7 8 9 10 11
0
10
20
30
40
50
60
70
80
90
100
Age Group and Lodgement Method
A
S
Age Range
Frequency
Figure 3: Bar Graph showing Comparison of Age Range and Lodgement Method
Table 8: Expected Frequencies for Comparison of Age Range and Lodgement Method
Age Range A S Grand Total
0 48.256 16 64
1 34.684 11 46
2 45.994 15 61
3 59.566 19 79
4 79.924 26 106
5 65.598 21 87
6 75.4 25 100
7 72.384 24 96
8 75.4 25 100
9 94.25 31 125
10 73.892 24 98
11 28.652 9.3 38
Grand Total 754 246 1000
Table 9: Significance Value of Chi Square Test
Significance Value 0.000324
Lodgement Method and Total Income Amount
It has been observed from the sample that people with higher average income prefer tax agents
to lodge their tax returns.
Paraphrase This Document
Need a fresh take? Get an instant paraphrase of this document with our AI Paraphraser
7BUS708 STATISTICS AND DATA ANALYSIS
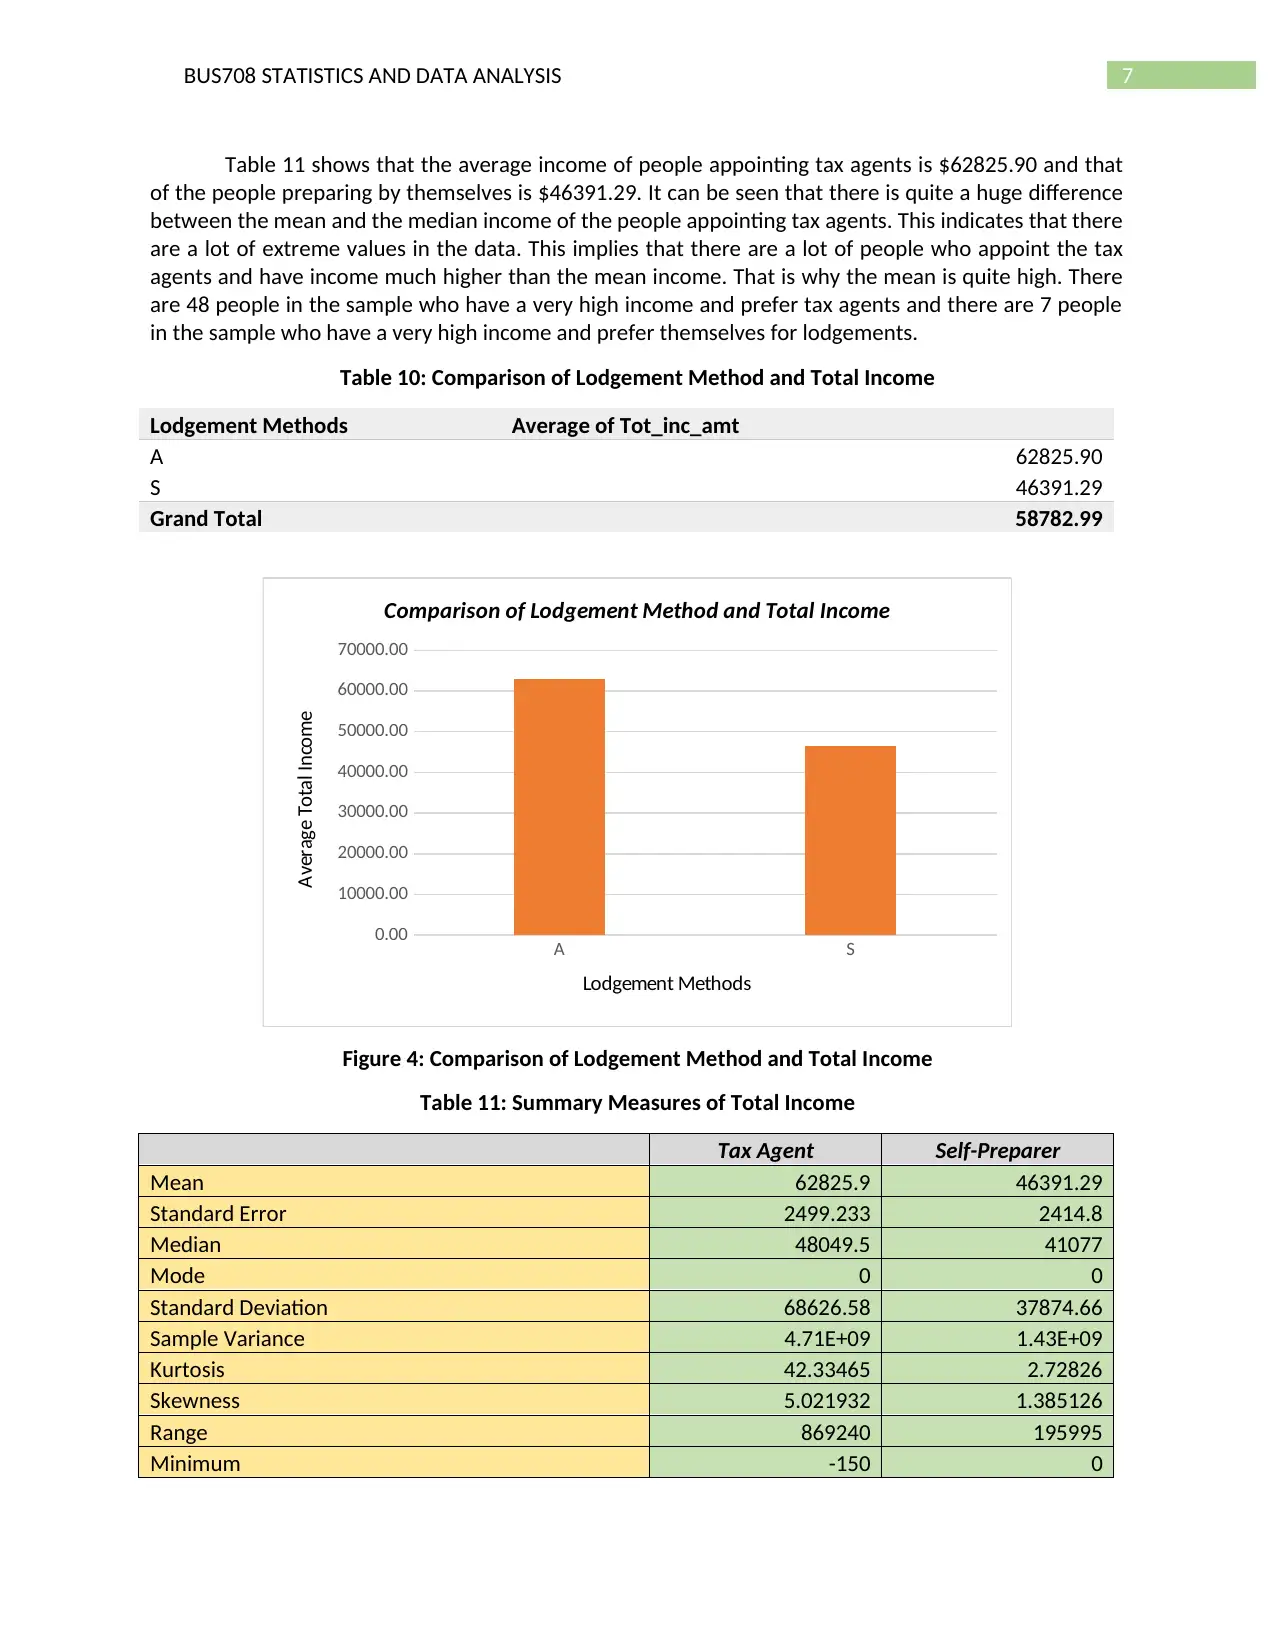
Table 11 shows that the average income of people appointing tax agents is $62825.90 and that
of the people preparing by themselves is $46391.29. It can be seen that there is quite a huge difference
between the mean and the median income of the people appointing tax agents. This indicates that there
are a lot of extreme values in the data. This implies that there are a lot of people who appoint the tax
agents and have income much higher than the mean income. That is why the mean is quite high. There
are 48 people in the sample who have a very high income and prefer tax agents and there are 7 people
in the sample who have a very high income and prefer themselves for lodgements.
Table 10: Comparison of Lodgement Method and Total Income
Lodgement Methods Average of Tot_inc_amt
A 62825.90
S 46391.29
Grand Total 58782.99
A S
0.00
10000.00
20000.00
30000.00
40000.00
50000.00
60000.00
70000.00
Comparison of Lodgement Method and Total Income
Lodgement Methods
Average Total Income
Figure 4: Comparison of Lodgement Method and Total Income
Table 11: Summary Measures of Total Income
Tax Agent Self-Preparer
Mean 62825.9 46391.29
Standard Error 2499.233 2414.8
Median 48049.5 41077
Mode 0 0
Standard Deviation 68626.58 37874.66
Sample Variance 4.71E+09 1.43E+09
Kurtosis 42.33465 2.72826
Skewness 5.021932 1.385126
Range 869240 195995
Minimum -150 0
8BUS708 STATISTICS AND DATA ANALYSIS
Maximum 869090 195995
First Quartile 26539.25 17418.5
Third Quartile 75743 65905.75
IQR 49203.75 48487.25
Sum 47370728 11412258
Count 754 246
First Quartile - Minimum 26689.25 17418.5
First Quartile 26539.25 17418.5
Median - First Quartile 21510.25 23658.5
Third Quartile - Median 27693.5 24828.75
Maximum - Third Quartile 793347 130089.3
Lowe Outlier Range -47266.4 -55312.4
Upper Outlier Range 149548.6 138636.6
Number of Outliers 48 7
Agent Self
0
10000
20000
30000
40000
50000
60000
70000
80000
Boxplot for Total Income
Total Income
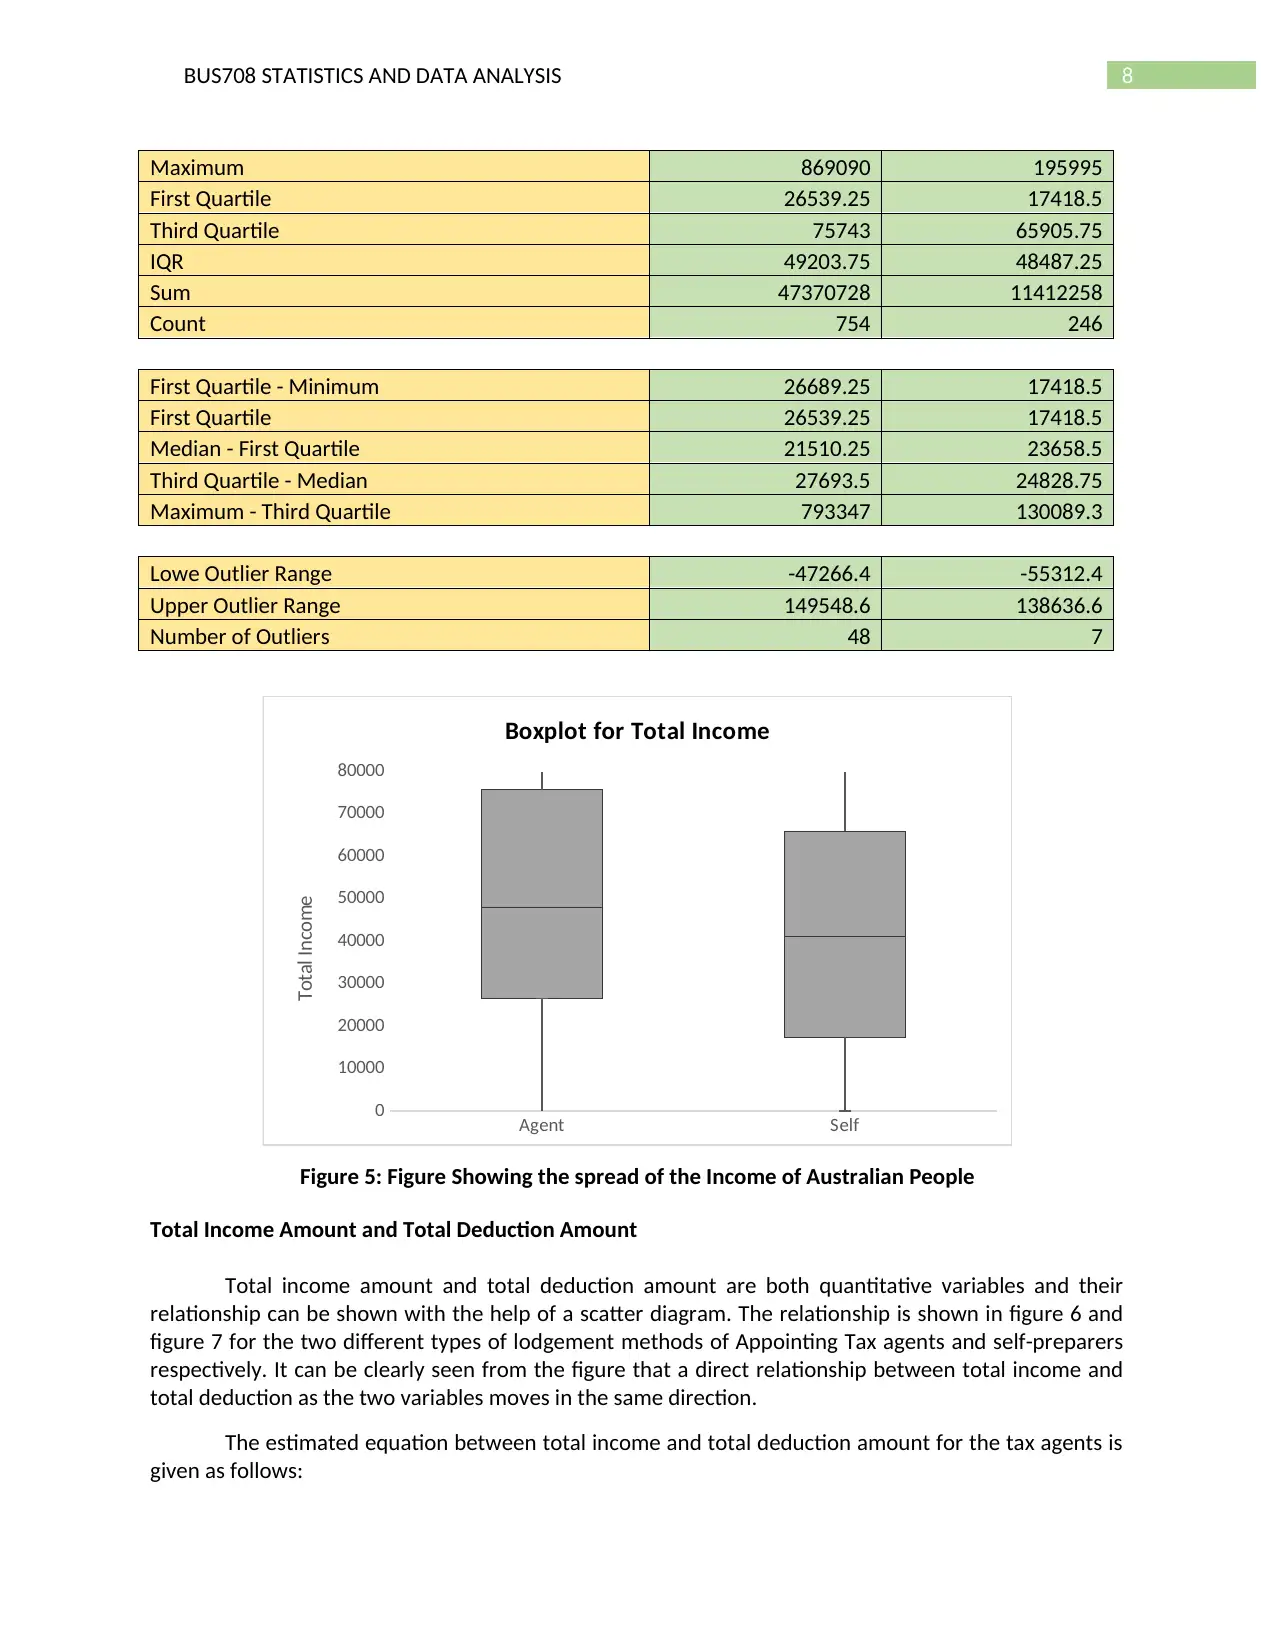
Figure 5: Figure Showing the spread of the Income of Australian People
Total Income Amount and Total Deduction Amount
Total income amount and total deduction amount are both quantitative variables and their
relationship can be shown with the help of a scatter diagram. The relationship is shown in figure 6 and
figure 7 for the two different types of lodgement methods of Appointing Tax agents and self-preparers
respectively. It can be clearly seen from the figure that a direct relationship between total income and
total deduction as the two variables moves in the same direction.
The estimated equation between total income and total deduction amount for the tax agents is
given as follows:
Maximum 869090 195995
First Quartile 26539.25 17418.5
Third Quartile 75743 65905.75
IQR 49203.75 48487.25
Sum 47370728 11412258
Count 754 246
First Quartile - Minimum 26689.25 17418.5
First Quartile 26539.25 17418.5
Median - First Quartile 21510.25 23658.5
Third Quartile - Median 27693.5 24828.75
Maximum - Third Quartile 793347 130089.3
Lowe Outlier Range -47266.4 -55312.4
Upper Outlier Range 149548.6 138636.6
Number of Outliers 48 7
Agent Self
0
10000
20000
30000
40000
50000
60000
70000
80000
Boxplot for Total Income
Total Income
Figure 5: Figure Showing the spread of the Income of Australian People
Total Income Amount and Total Deduction Amount
Total income amount and total deduction amount are both quantitative variables and their
relationship can be shown with the help of a scatter diagram. The relationship is shown in figure 6 and
figure 7 for the two different types of lodgement methods of Appointing Tax agents and self-preparers
respectively. It can be clearly seen from the figure that a direct relationship between total income and
total deduction as the two variables moves in the same direction.
The estimated equation between total income and total deduction amount for the tax agents is
given as follows:
⊘ This is a preview!⊘
Do you want full access?
Subscribe today to unlock all pages.
Trusted by 1+ million students worldwide
9BUS708 STATISTICS AND DATA ANALYSIS
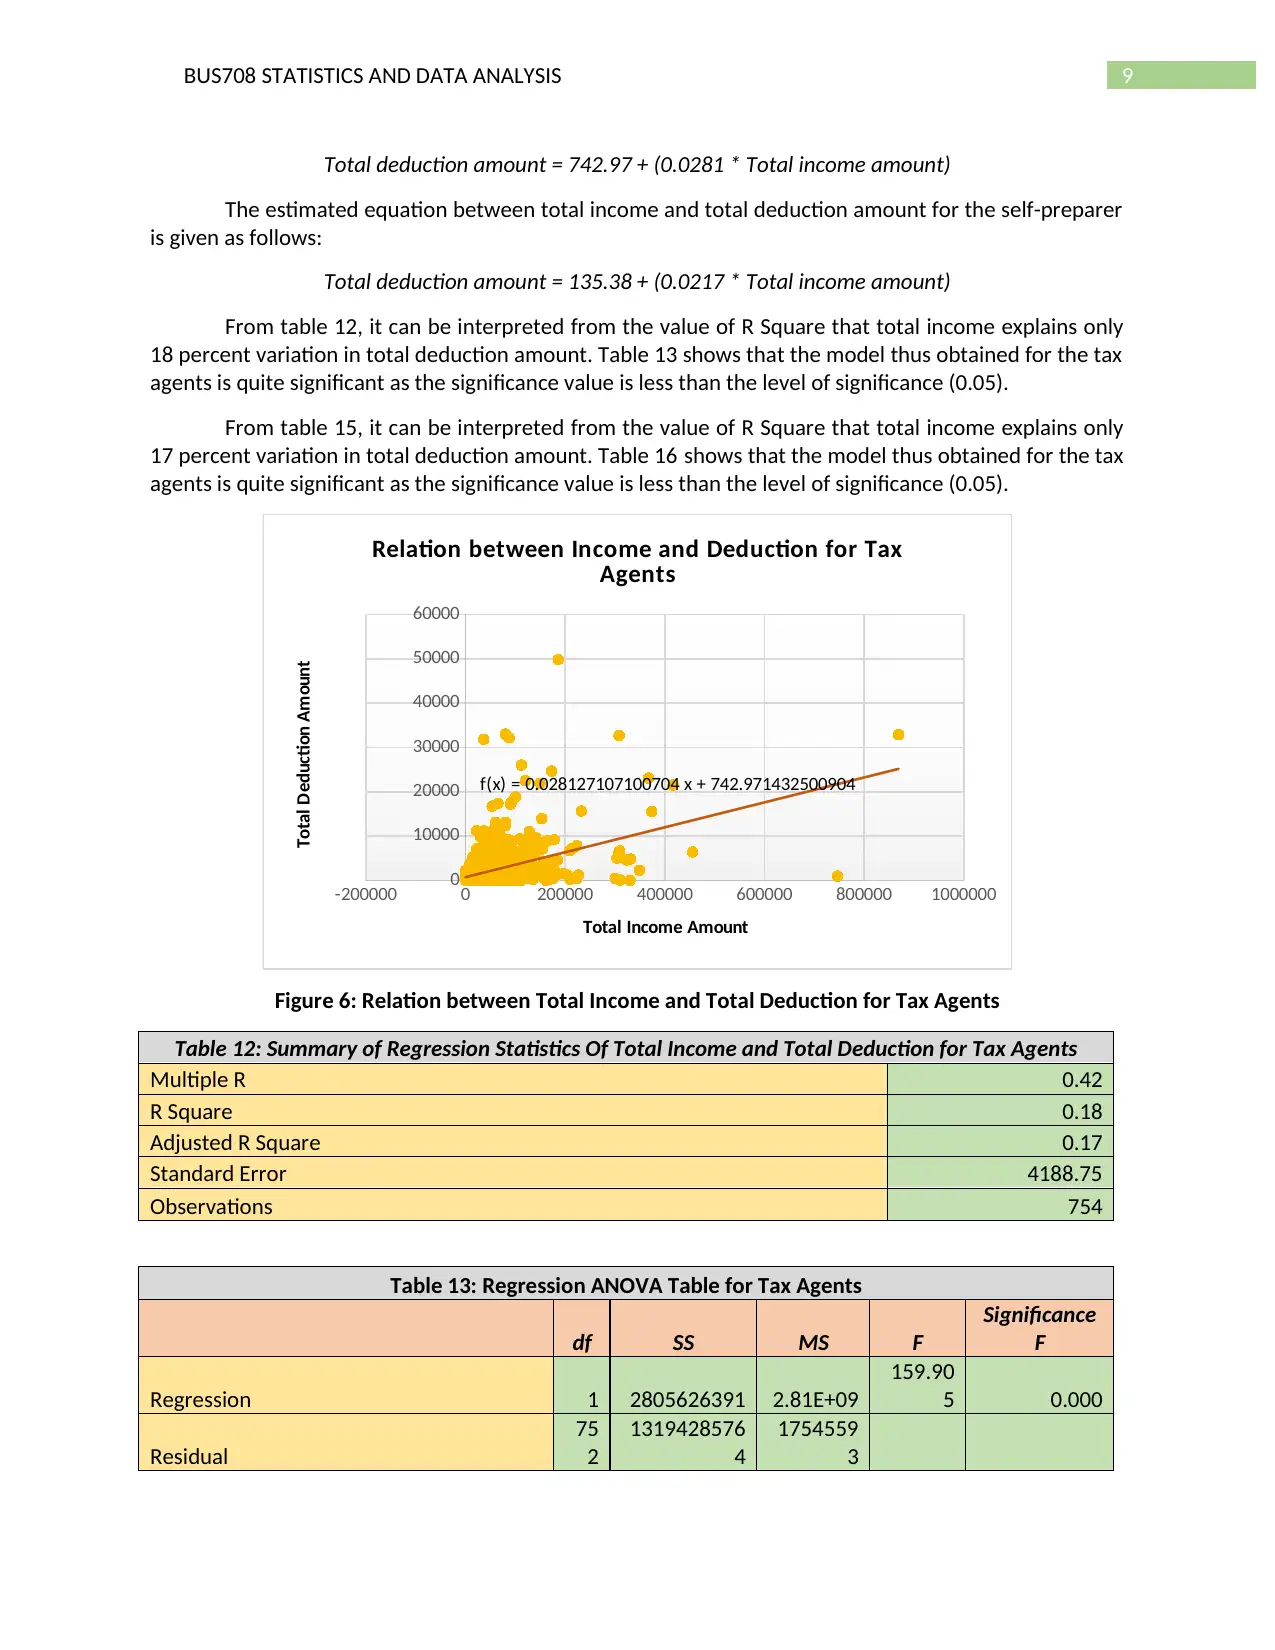
Total deduction amount = 742.97 + (0.0281 * Total income amount)
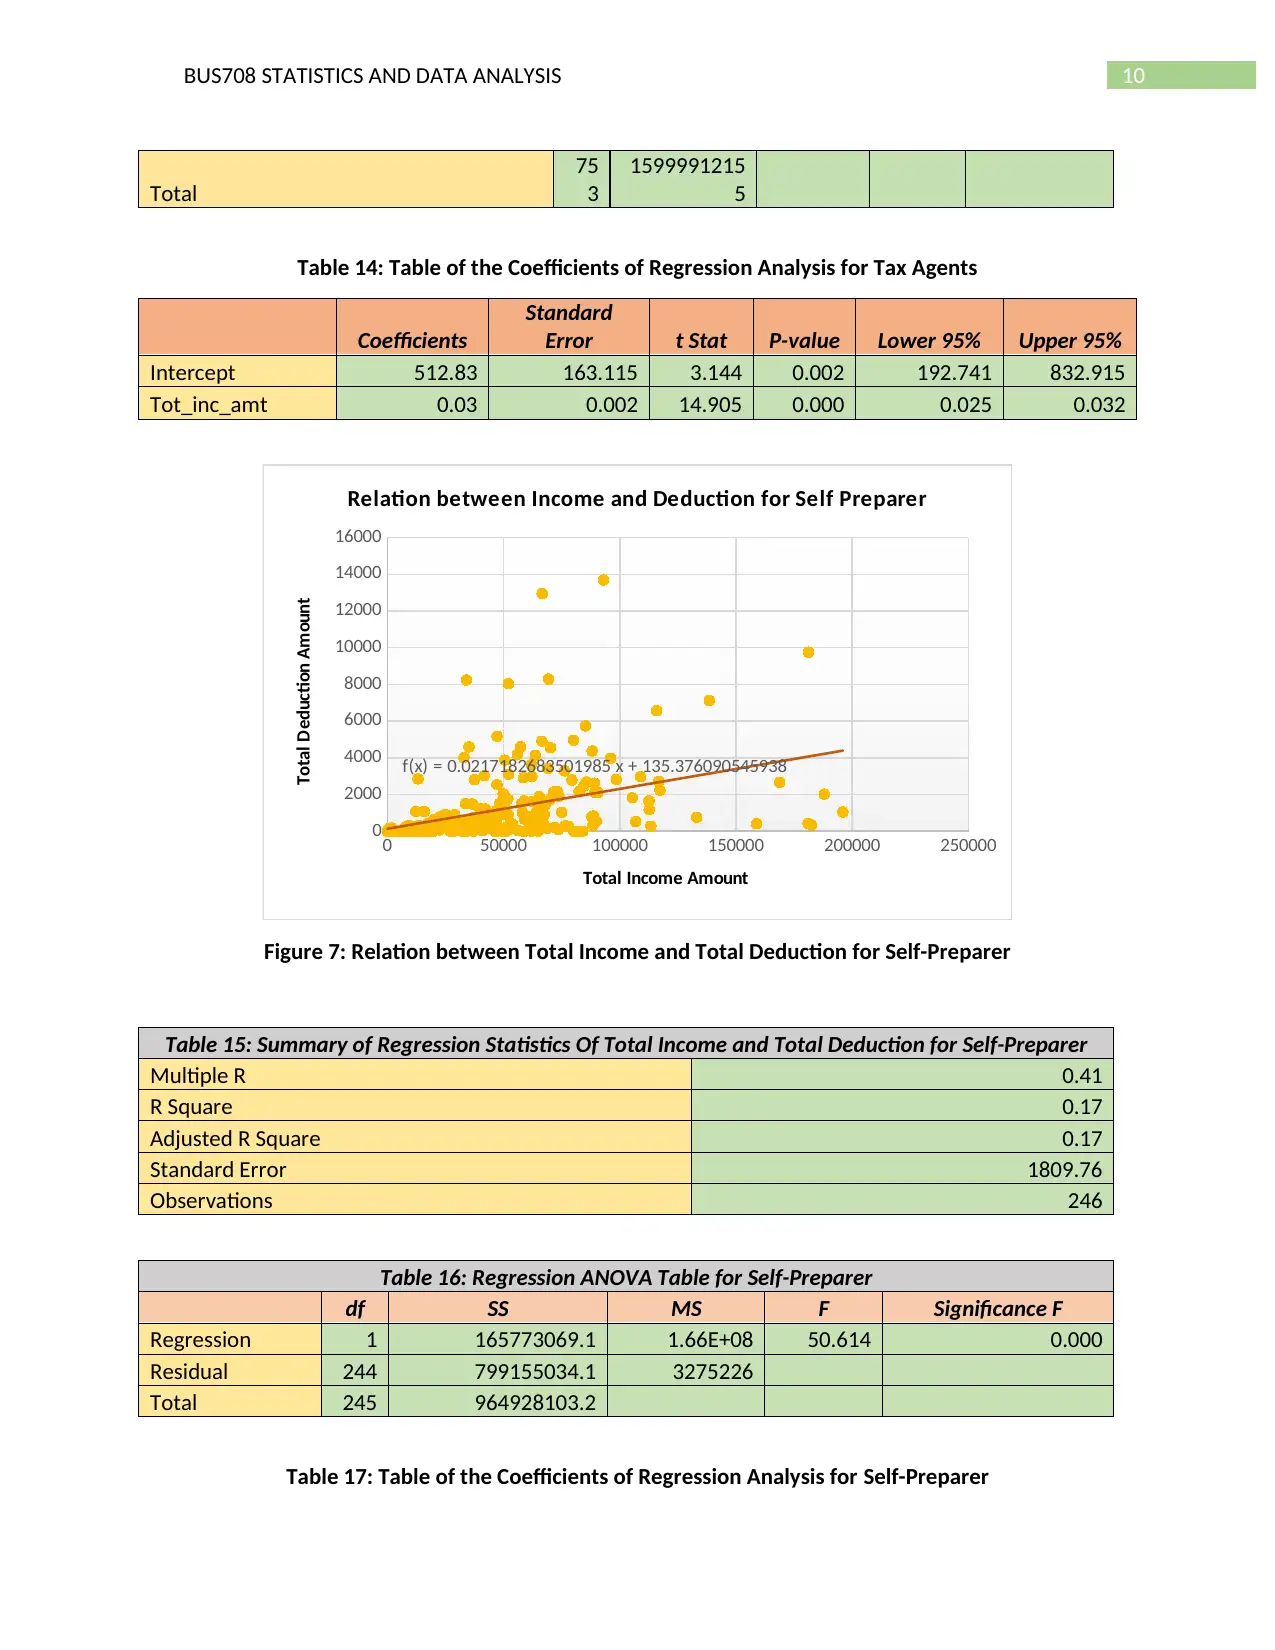
The estimated equation between total income and total deduction amount for the self-preparer
is given as follows:
Total deduction amount = 135.38 + (0.0217 * Total income amount)
From table 12, it can be interpreted from the value of R Square that total income explains only
18 percent variation in total deduction amount. Table 13 shows that the model thus obtained for the tax
agents is quite significant as the significance value is less than the level of significance (0.05).
From table 15, it can be interpreted from the value of R Square that total income explains only
17 percent variation in total deduction amount. Table 16 shows that the model thus obtained for the tax
agents is quite significant as the significance value is less than the level of significance (0.05).
-200000 0 200000 400000 600000 800000 1000000
0
10000
20000
30000
40000
50000
60000
f(x) = 0.028127107100704 x + 742.971432500904
Relation between Income and Deduction for Tax
Agents
Total Income Amount
Total Deduction Amount
Figure 6: Relation between Total Income and Total Deduction for Tax Agents
Table 12: Summary of Regression Statistics Of Total Income and Total Deduction for Tax Agents
Multiple R 0.42
R Square 0.18
Adjusted R Square 0.17
Standard Error 4188.75
Observations 754
Table 13: Regression ANOVA Table for Tax Agents
df SS MS F
Significance
F
Regression 1 2805626391 2.81E+09
159.90
5 0.000
Residual
75
2
1319428576
4
1754559
3
Total deduction amount = 742.97 + (0.0281 * Total income amount)
The estimated equation between total income and total deduction amount for the self-preparer
is given as follows:
Total deduction amount = 135.38 + (0.0217 * Total income amount)
From table 12, it can be interpreted from the value of R Square that total income explains only
18 percent variation in total deduction amount. Table 13 shows that the model thus obtained for the tax
agents is quite significant as the significance value is less than the level of significance (0.05).
From table 15, it can be interpreted from the value of R Square that total income explains only
17 percent variation in total deduction amount. Table 16 shows that the model thus obtained for the tax
agents is quite significant as the significance value is less than the level of significance (0.05).
-200000 0 200000 400000 600000 800000 1000000
0
10000
20000
30000
40000
50000
60000
f(x) = 0.028127107100704 x + 742.971432500904
Relation between Income and Deduction for Tax
Agents
Total Income Amount
Total Deduction Amount
Figure 6: Relation between Total Income and Total Deduction for Tax Agents
Table 12: Summary of Regression Statistics Of Total Income and Total Deduction for Tax Agents
Multiple R 0.42
R Square 0.18
Adjusted R Square 0.17
Standard Error 4188.75
Observations 754
Table 13: Regression ANOVA Table for Tax Agents
df SS MS F
Significance
F
Regression 1 2805626391 2.81E+09
159.90
5 0.000
Residual
75
2
1319428576
4
1754559
3
Paraphrase This Document
Need a fresh take? Get an instant paraphrase of this document with our AI Paraphraser
10BUS708 STATISTICS AND DATA ANALYSIS
Total
75
3
1599991215
5
Table 14: Table of the Coefficients of Regression Analysis for Tax Agents
Coefficients
Standard
Error t Stat P-value Lower 95% Upper 95%
Intercept 512.83 163.115 3.144 0.002 192.741 832.915
Tot_inc_amt 0.03 0.002 14.905 0.000 0.025 0.032
0 50000 100000 150000 200000 250000
0
2000
4000
6000
8000
10000
12000
14000
16000
f(x) = 0.0217182683501985 x + 135.376090545938
Relation between Income and Deduction for Self Preparer
Total Income Amount
Total Deduction Amount
Figure 7: Relation between Total Income and Total Deduction for Self-Preparer
Table 15: Summary of Regression Statistics Of Total Income and Total Deduction for Self-Preparer
Multiple R 0.41
R Square 0.17
Adjusted R Square 0.17
Standard Error 1809.76
Observations 246
Table 16: Regression ANOVA Table for Self-Preparer
df SS MS F Significance F
Regression 1 165773069.1 1.66E+08 50.614 0.000
Residual 244 799155034.1 3275226
Total 245 964928103.2
Table 17: Table of the Coefficients of Regression Analysis for Self-Preparer
11BUS708 STATISTICS AND DATA ANALYSIS
Coefficients
Standard
Error t Stat P-value Lower 95% Upper 95%
Intercept 135.38 182.675 0.741 0.459 -224.445 495.198
Tot_inc_amt 0.0217 0.003 7.114 0.000 0.016 0.028
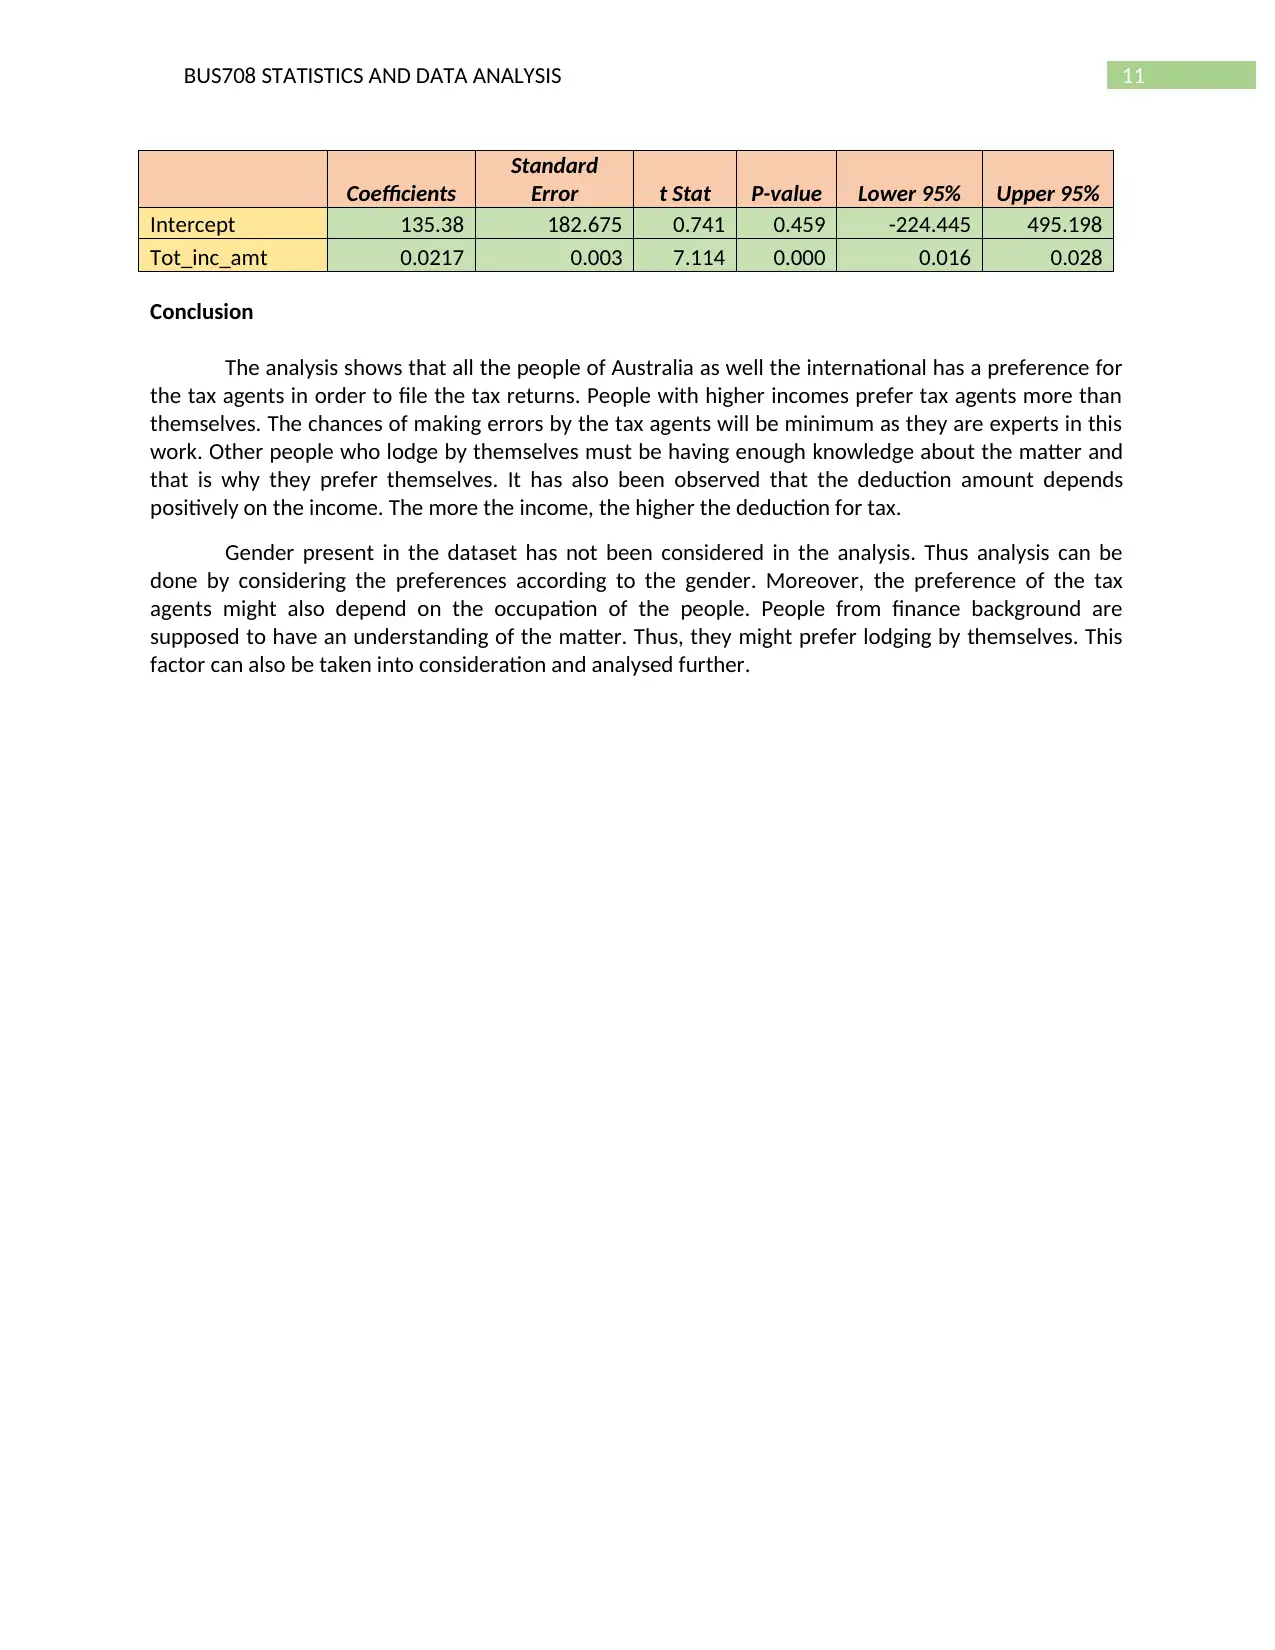
Conclusion
The analysis shows that all the people of Australia as well the international has a preference for
the tax agents in order to file the tax returns. People with higher incomes prefer tax agents more than
themselves. The chances of making errors by the tax agents will be minimum as they are experts in this
work. Other people who lodge by themselves must be having enough knowledge about the matter and
that is why they prefer themselves. It has also been observed that the deduction amount depends
positively on the income. The more the income, the higher the deduction for tax.
Gender present in the dataset has not been considered in the analysis. Thus analysis can be
done by considering the preferences according to the gender. Moreover, the preference of the tax
agents might also depend on the occupation of the people. People from finance background are
supposed to have an understanding of the matter. Thus, they might prefer lodging by themselves. This
factor can also be taken into consideration and analysed further.
Coefficients
Standard
Error t Stat P-value Lower 95% Upper 95%
Intercept 135.38 182.675 0.741 0.459 -224.445 495.198
Tot_inc_amt 0.0217 0.003 7.114 0.000 0.016 0.028
Conclusion
The analysis shows that all the people of Australia as well the international has a preference for
the tax agents in order to file the tax returns. People with higher incomes prefer tax agents more than
themselves. The chances of making errors by the tax agents will be minimum as they are experts in this
work. Other people who lodge by themselves must be having enough knowledge about the matter and
that is why they prefer themselves. It has also been observed that the deduction amount depends
positively on the income. The more the income, the higher the deduction for tax.
Gender present in the dataset has not been considered in the analysis. Thus analysis can be
done by considering the preferences according to the gender. Moreover, the preference of the tax
agents might also depend on the occupation of the people. People from finance background are
supposed to have an understanding of the matter. Thus, they might prefer lodging by themselves. This
factor can also be taken into consideration and analysed further.
⊘ This is a preview!⊘
Do you want full access?
Subscribe today to unlock all pages.
Trusted by 1+ million students worldwide
1 out of 13
Related Documents


Your All-in-One AI-Powered Toolkit for Academic Success.
+13062052269
info@desklib.com
Available 24*7 on WhatsApp / Email
![[object Object]](/_next/static/media/star-bottom.7253800d.svg)
Unlock your academic potential
Copyright © 2020–2026 A2Z Services. All Rights Reserved. Developed and managed by ZUCOL.