BUS 800 Strategic Management: Analyzing Nucor Corporation
VerifiedAdded on 2023/06/14
|45
|10864
|326
Case Study
AI Summary
This case study provides a strategic analysis of Nucor Corporation within the United States steel industry, addressing key issues and challenges the company faces. It includes a comprehensive environmental and industry analysis using tools such as PESTLE and Porter's Five Forces, along with an internal analysis encompassing financial performance, current strategies, SWOT, and value chain analysis. The study identifies key drivers of change and success factors within the industry, assesses Nucor's competitive position, and proposes strategic alternatives to manage the impact of international low-cost goods. Recommendations are made based on the evaluation of strategic options, focusing on returns, effectiveness, and efficiency to enhance Nucor's competitive advantage. The analysis leverages financial data and market insights to provide a detailed overview of Nucor Corporation's strategic landscape and future opportunities.
Strategic Management
Steel industry
4/12/2018
Nucor Corporation
Student Name:
Steel industry
4/12/2018
Nucor Corporation
Student Name:
Paraphrase This Document
Need a fresh take? Get an instant paraphrase of this document with our AI Paraphraser
STRATEGIC MANAGEMENT 1
Table of Contents
Introduction................................................................................................................................4
Analysis..................................................................................................................................4
Pestle Analysis...................................................................................................................4
Porter Five Force Analysis.................................................................................................5
Key Drivers of Change.......................................................................................................5
Key Success Factors...........................................................................................................6
Strategic Group Map..........................................................................................................6
Life Cycle of the industry..................................................................................................6
Current Strategies of Company..........................................................................................6
SWOT Analysis.................................................................................................................6
Value Chain Analysis.........................................................................................................7
Competitor Analysis...........................................................................................................7
Key Strategic Issue.............................................................................................................7
Alternatives............................................................................................................................7
Recommendations......................................................................................................................8
References................................................................................................................................10
Appendix..................................................................................................................................11
1External Analysis...................................................................................................................11
1.1PESTLE Analysis............................................................................................................11
1.1.1Political....................................................................................................................11
1.1.2Economic..................................................................................................................12
1.1.3Social........................................................................................................................12
1.1.4Technological...........................................................................................................13
1.1.5Legal.........................................................................................................................13
1.1.6Environmental..........................................................................................................13
1.2United States Steel Industry............................................................................................13
1.3Porter Five Forces Analysis............................................................................................15
1.3.1Buyer’s Bargaining Power.......................................................................................15
1.3.2Supplier’s Bargaining Power...................................................................................16
1.3.3Rivalry among Existing Firms.................................................................................16
1.3.4Threats of New Entrants...........................................................................................17
STRATEGIC MANAGEMENT 2
1.3.5Threat from Substitute Services of Products............................................................18
1.4Factors Driving Industry Change....................................................................................18
1.4.1Product.....................................................................................................................19
1.4.2Raw Material............................................................................................................19
1.4.3People.......................................................................................................................20
1.4.4Cost..........................................................................................................................20
1.5Steel Consumption in Various Countries........................................................................21
1.6Key Success Factors of U.S. Steel Industry....................................................................21
1.6.1Getting raw materials at less costs...........................................................................21
1.6.2Proximity to inputs and market................................................................................22
1.6.3Financial structure....................................................................................................22
1.6.4Varied product mix and section of value-added products........................................22
1.7Strategic Group Map Analysis........................................................................................23
1.8Life Cycle of United States Steel Industry......................................................................26
1.8.1Introduction Stage....................................................................................................26
1.8.2Growth Stage............................................................................................................26
1.8.3Maturity Stage..........................................................................................................27
1.8.4Decline Stage...........................................................................................................27
1.9Conclusion of Industry Analysis.........................................................................................27
2Internal Analysis....................................................................................................................28
2.1Financial Analysis...........................................................................................................28
2.2Current Strategy of Nucor Corporation...........................................................................29
2.2.1Strategies executed by Nucor Corporation..............................................................30
2.3SWOT Analysis..............................................................................................................32
2.3.1Strength of Nucor Corporation.................................................................................32
2.3.2Weaknesses..............................................................................................................33
2.3.3Opportunities............................................................................................................34
2.3.4Threats......................................................................................................................34
2.4Value Chain Analysis......................................................................................................35
2.4.1Primary Activities of Value Chain Analysis............................................................36
2.4.2Support Activities.....................................................................................................37
2.5Competitive Analysis......................................................................................................39
2.5.1Competitive Strength Assessment............................................................................39
⊘ This is a preview!⊘
Do you want full access?
Subscribe today to unlock all pages.
Trusted by 1+ million students worldwide
STRATEGIC MANAGEMENT 3
2.6Key Strategic Issue..........................................................................................................41
2.6Key Strategic Issue..........................................................................................................41
Paraphrase This Document
Need a fresh take? Get an instant paraphrase of this document with our AI Paraphraser
STRATEGIC MANAGEMENT 4
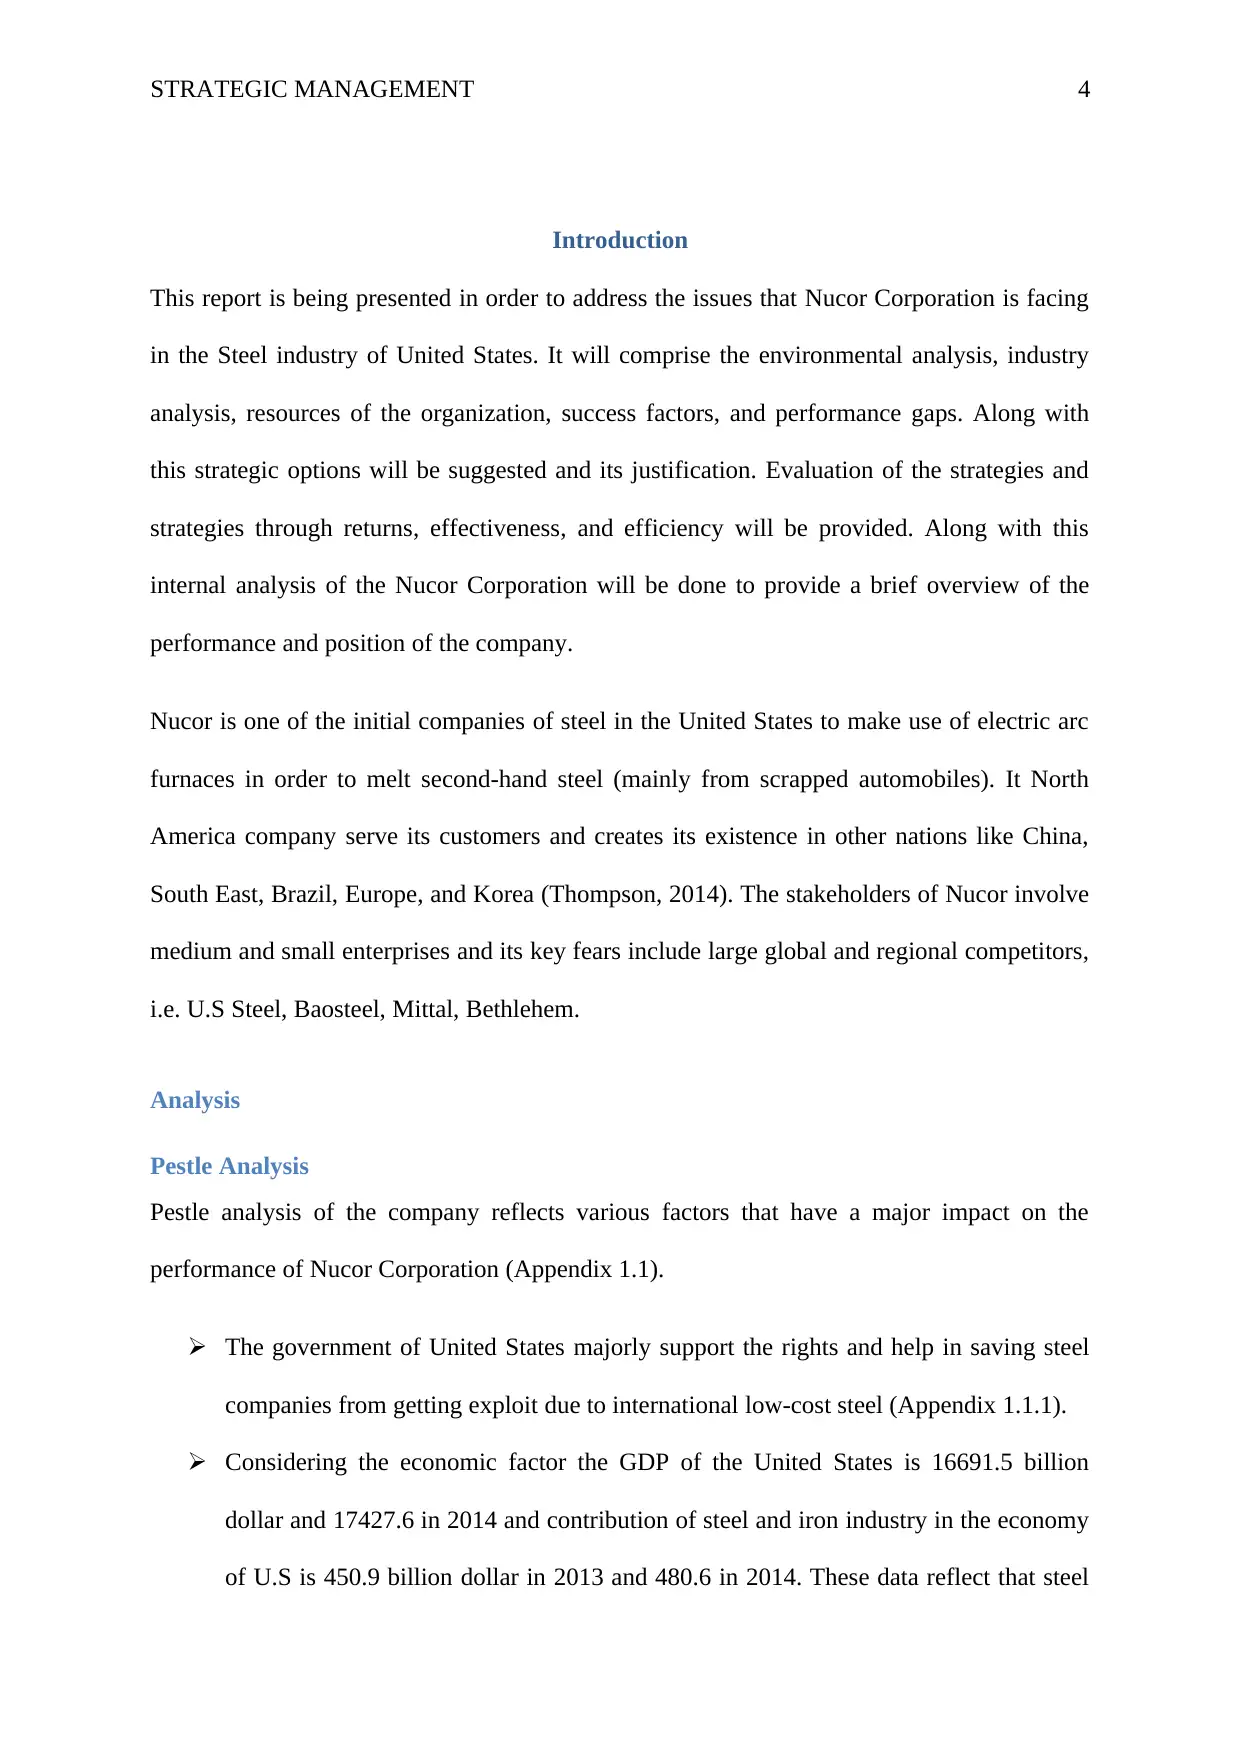
Introduction
This report is being presented in order to address the issues that Nucor Corporation is facing
in the Steel industry of United States. It will comprise the environmental analysis, industry
analysis, resources of the organization, success factors, and performance gaps. Along with
this strategic options will be suggested and its justification. Evaluation of the strategies and
strategies through returns, effectiveness, and efficiency will be provided. Along with this
internal analysis of the Nucor Corporation will be done to provide a brief overview of the
performance and position of the company.
Nucor is one of the initial companies of steel in the United States to make use of electric arc
furnaces in order to melt second-hand steel (mainly from scrapped automobiles). It North
America company serve its customers and creates its existence in other nations like China,
South East, Brazil, Europe, and Korea (Thompson, 2014). The stakeholders of Nucor involve
medium and small enterprises and its key fears include large global and regional competitors,
i.e. U.S Steel, Baosteel, Mittal, Bethlehem.
Analysis
Pestle Analysis
Pestle analysis of the company reflects various factors that have a major impact on the
performance of Nucor Corporation (Appendix 1.1).
The government of United States majorly support the rights and help in saving steel
companies from getting exploit due to international low-cost steel (Appendix 1.1.1).
Considering the economic factor the GDP of the United States is 16691.5 billion
dollar and 17427.6 in 2014 and contribution of steel and iron industry in the economy
of U.S is 450.9 billion dollar in 2013 and 480.6 in 2014. These data reflect that steel
STRATEGIC MANAGEMENT 5
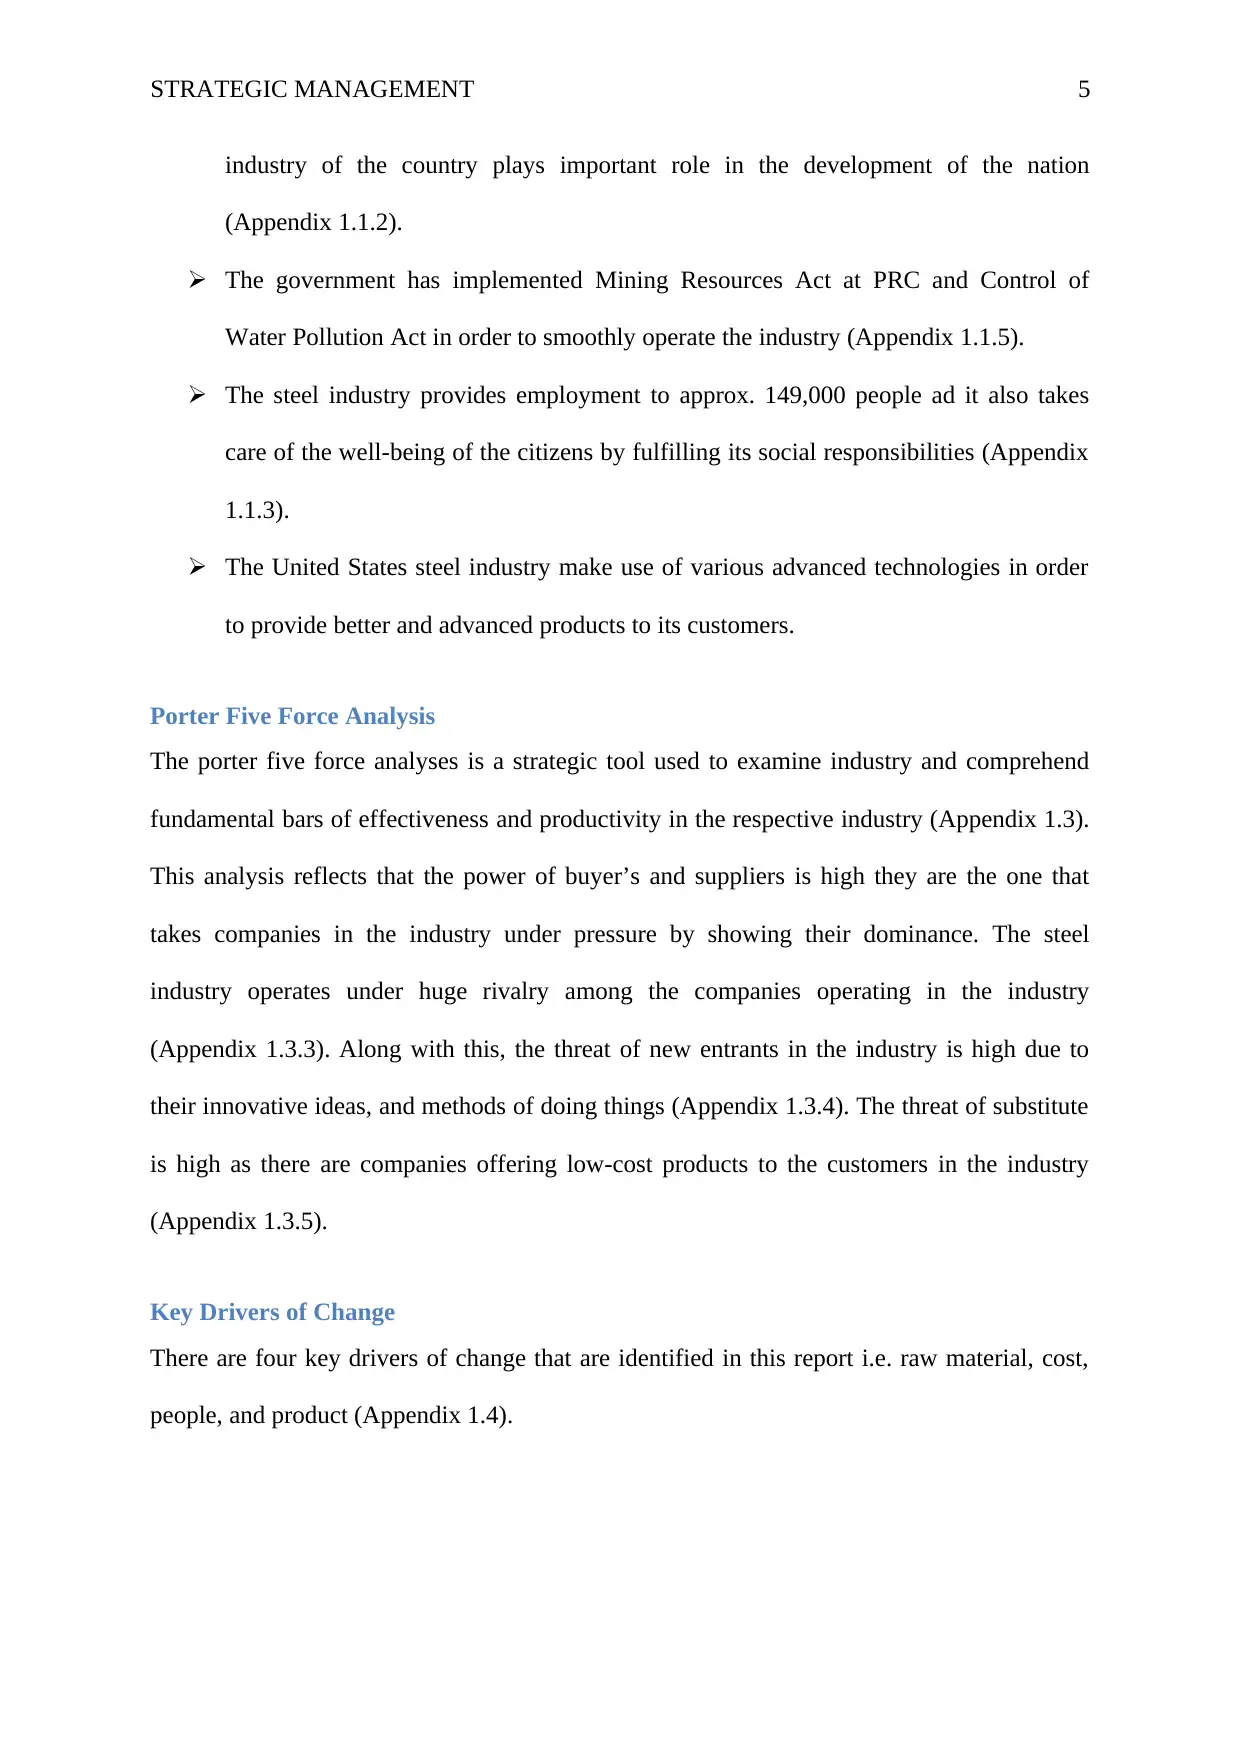
industry of the country plays important role in the development of the nation
(Appendix 1.1.2).
The government has implemented Mining Resources Act at PRC and Control of
Water Pollution Act in order to smoothly operate the industry (Appendix 1.1.5).
The steel industry provides employment to approx. 149,000 people ad it also takes
care of the well-being of the citizens by fulfilling its social responsibilities (Appendix
1.1.3).
The United States steel industry make use of various advanced technologies in order
to provide better and advanced products to its customers.
Porter Five Force Analysis
The porter five force analyses is a strategic tool used to examine industry and comprehend
fundamental bars of effectiveness and productivity in the respective industry (Appendix 1.3).
This analysis reflects that the power of buyer’s and suppliers is high they are the one that
takes companies in the industry under pressure by showing their dominance. The steel
industry operates under huge rivalry among the companies operating in the industry
(Appendix 1.3.3). Along with this, the threat of new entrants in the industry is high due to
their innovative ideas, and methods of doing things (Appendix 1.3.4). The threat of substitute
is high as there are companies offering low-cost products to the customers in the industry
(Appendix 1.3.5).
Key Drivers of Change
There are four key drivers of change that are identified in this report i.e. raw material, cost,
people, and product (Appendix 1.4).
⊘ This is a preview!⊘
Do you want full access?
Subscribe today to unlock all pages.
Trusted by 1+ million students worldwide
STRATEGIC MANAGEMENT 6
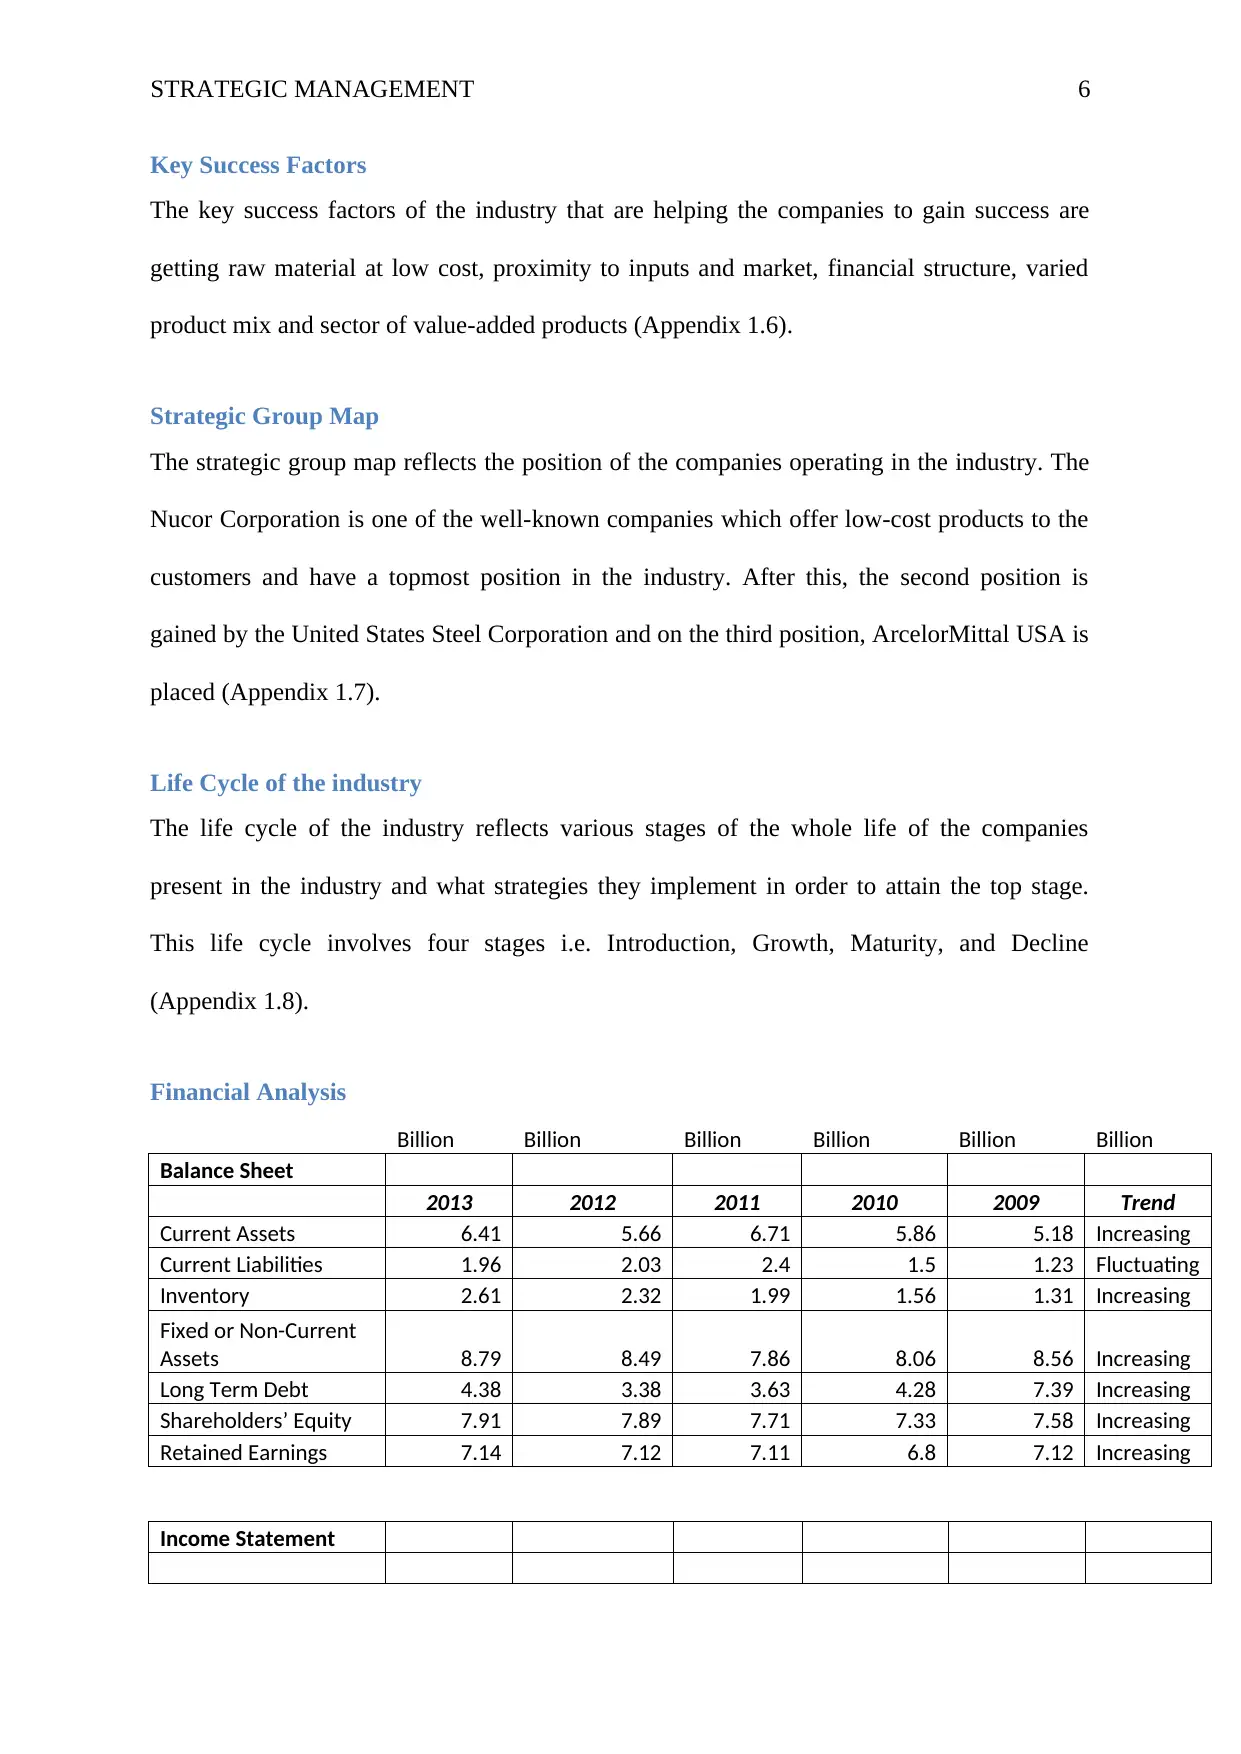
Key Success Factors
The key success factors of the industry that are helping the companies to gain success are
getting raw material at low cost, proximity to inputs and market, financial structure, varied
product mix and sector of value-added products (Appendix 1.6).
Strategic Group Map
The strategic group map reflects the position of the companies operating in the industry. The
Nucor Corporation is one of the well-known companies which offer low-cost products to the
customers and have a topmost position in the industry. After this, the second position is
gained by the United States Steel Corporation and on the third position, ArcelorMittal USA is
placed (Appendix 1.7).
Life Cycle of the industry
The life cycle of the industry reflects various stages of the whole life of the companies
present in the industry and what strategies they implement in order to attain the top stage.
This life cycle involves four stages i.e. Introduction, Growth, Maturity, and Decline
(Appendix 1.8).
Financial Analysis
Billion Billion Billion Billion Billion Billion
Balance Sheet
2013 2012 2011 2010 2009 Trend
Current Assets 6.41 5.66 6.71 5.86 5.18 Increasing
Current Liabilities 1.96 2.03 2.4 1.5 1.23 Fluctuating
Inventory 2.61 2.32 1.99 1.56 1.31 Increasing
Fixed or Non-Current
Assets 8.79 8.49 7.86 8.06 8.56 Increasing
Long Term Debt 4.38 3.38 3.63 4.28 7.39 Increasing
Shareholders’ Equity 7.91 7.89 7.71 7.33 7.58 Increasing
Retained Earnings 7.14 7.12 7.11 6.8 7.12 Increasing
Income Statement
Paraphrase This Document
Need a fresh take? Get an instant paraphrase of this document with our AI Paraphraser
STRATEGIC MANAGEMENT 7
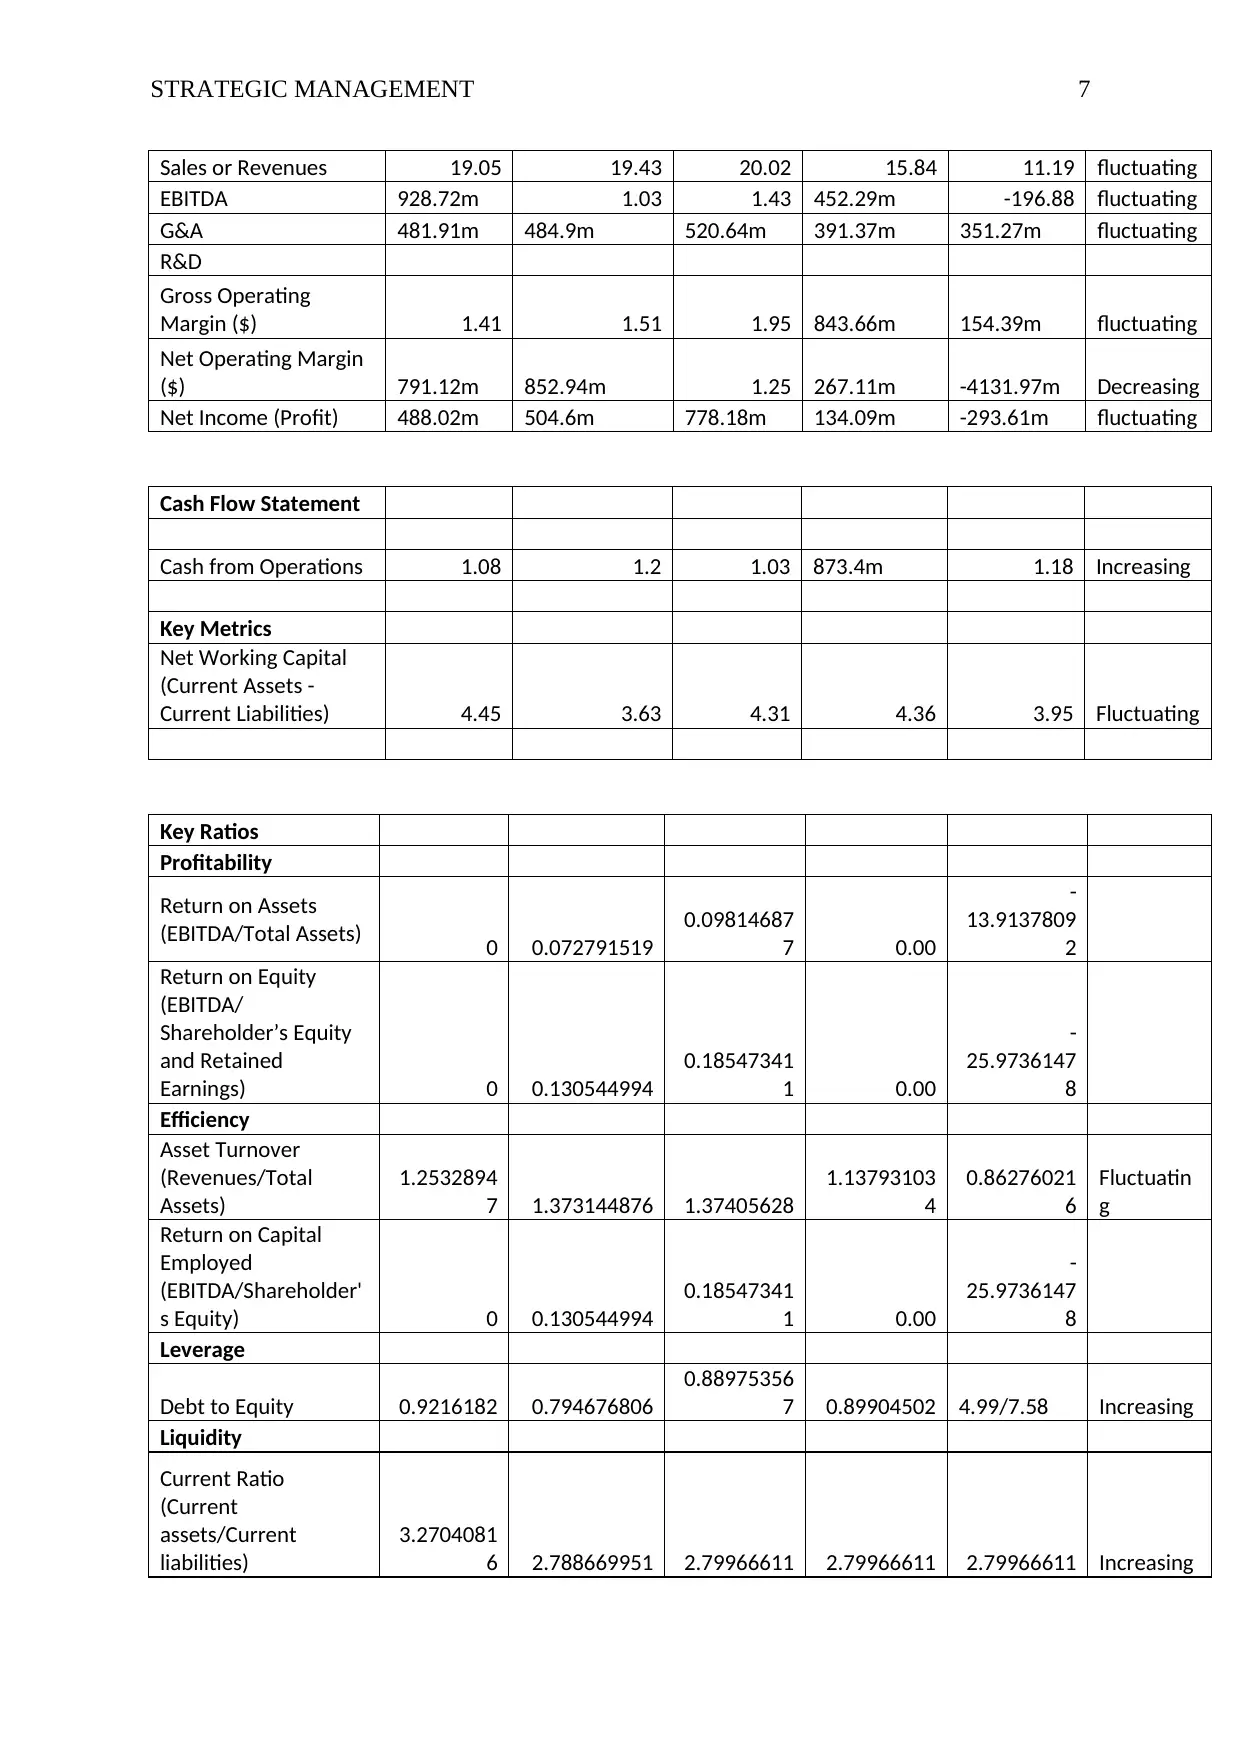
Sales or Revenues 19.05 19.43 20.02 15.84 11.19 fluctuating
EBITDA 928.72m 1.03 1.43 452.29m -196.88 fluctuating
G&A 481.91m 484.9m 520.64m 391.37m 351.27m fluctuating
R&D
Gross Operating
Margin ($) 1.41 1.51 1.95 843.66m 154.39m fluctuating
Net Operating Margin
($) 791.12m 852.94m 1.25 267.11m -4131.97m Decreasing
Net Income (Profit) 488.02m 504.6m 778.18m 134.09m -293.61m fluctuating
Cash Flow Statement
Cash from Operations 1.08 1.2 1.03 873.4m 1.18 Increasing
Key Metrics
Net Working Capital
(Current Assets -
Current Liabilities) 4.45 3.63 4.31 4.36 3.95 Fluctuating
Key Ratios
Profitability
Return on Assets
(EBITDA/Total Assets) 0 0.072791519
0.09814687
7 0.00
-
13.9137809
2
Return on Equity
(EBITDA/
Shareholder’s Equity
and Retained
Earnings) 0 0.130544994
0.18547341
1 0.00
-
25.9736147
8
Efficiency
Asset Turnover
(Revenues/Total
Assets)
1.2532894
7 1.373144876 1.37405628
1.13793103
4
0.86276021
6
Fluctuatin
g
Return on Capital
Employed
(EBITDA/Shareholder'
s Equity) 0 0.130544994
0.18547341
1 0.00
-
25.9736147
8
Leverage
Debt to Equity 0.9216182 0.794676806
0.88975356
7 0.89904502 4.99/7.58 Increasing
Liquidity
Current Ratio
(Current
assets/Current
liabilities)
3.2704081
6 2.788669951 2.79966611 2.79966611 2.79966611 Increasing
STRATEGIC MANAGEMENT 8
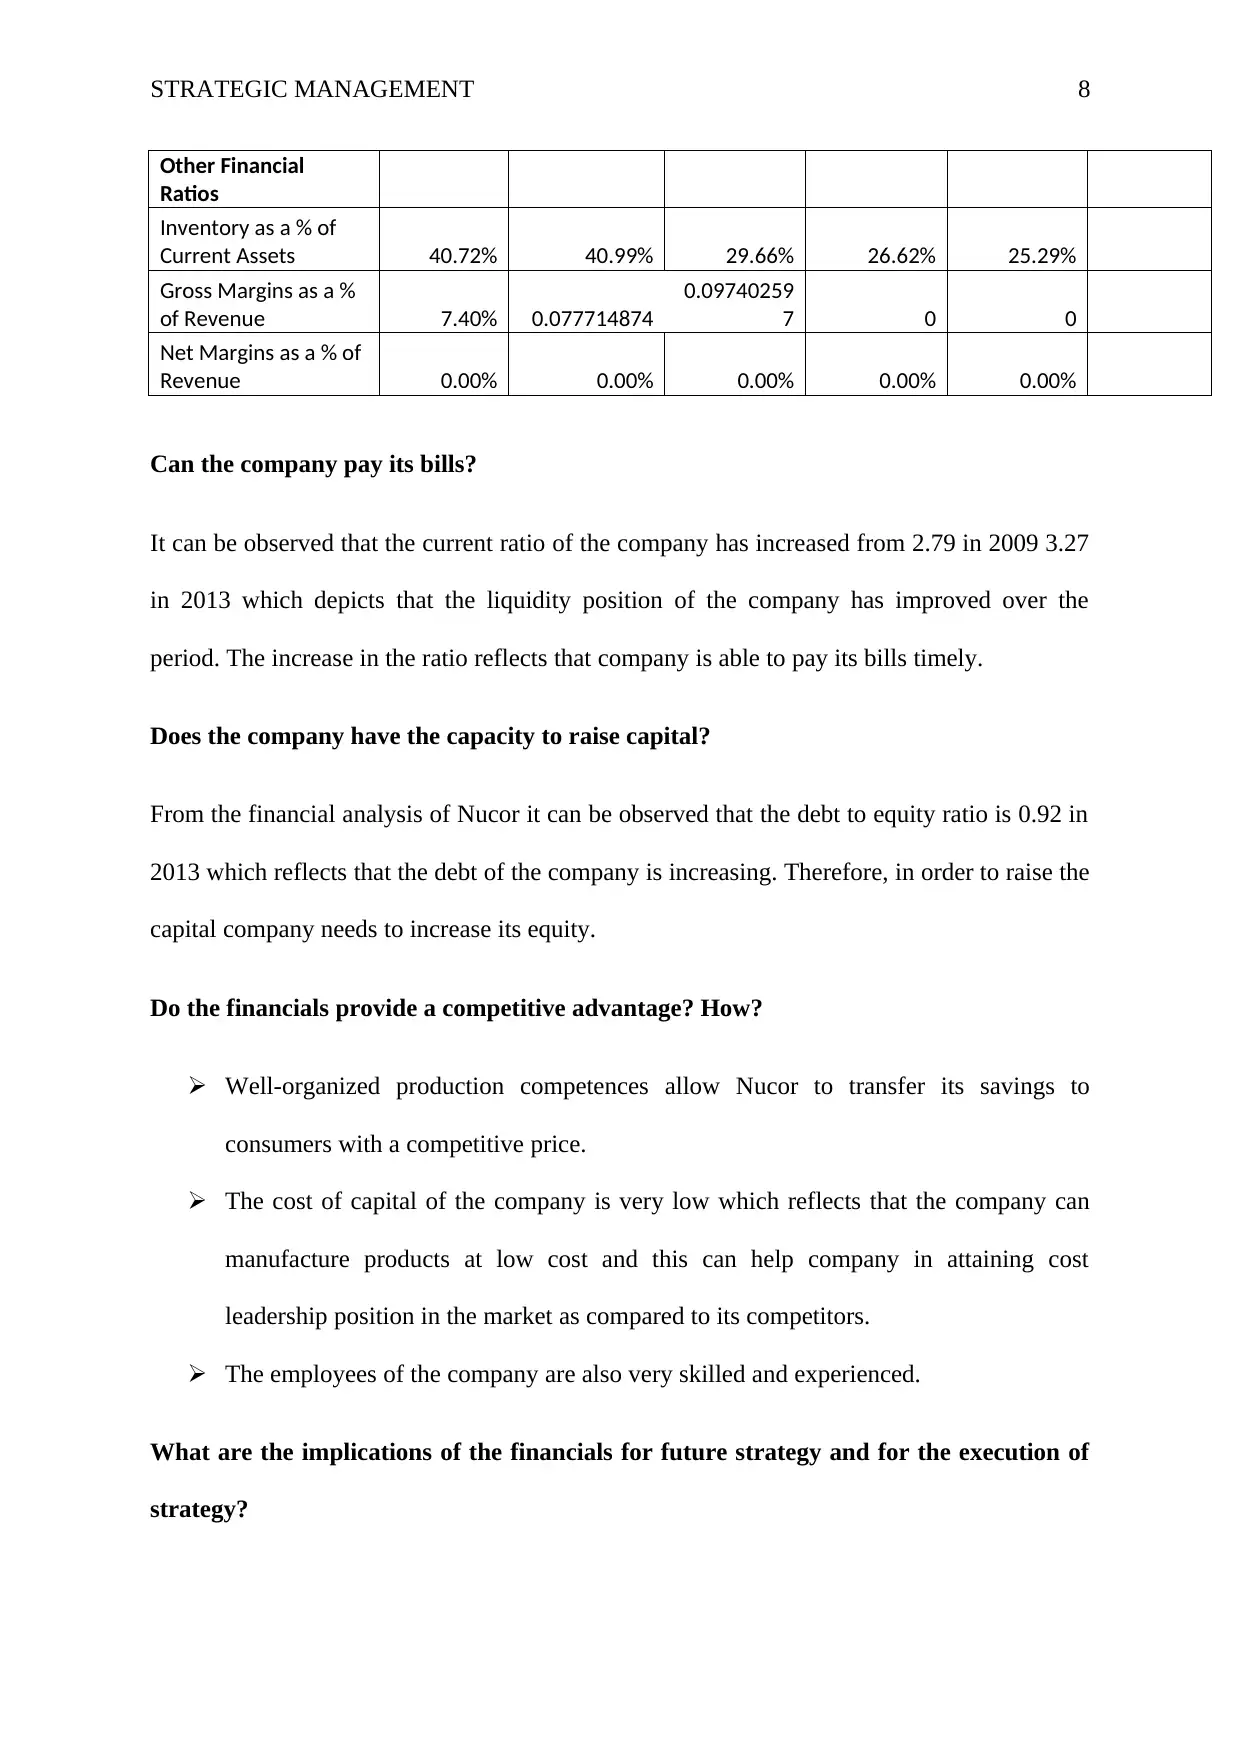
Other Financial
Ratios
Inventory as a % of
Current Assets 40.72% 40.99% 29.66% 26.62% 25.29%
Gross Margins as a %
of Revenue 7.40% 0.077714874
0.09740259
7 0 0
Net Margins as a % of
Revenue 0.00% 0.00% 0.00% 0.00% 0.00%
Can the company pay its bills?
It can be observed that the current ratio of the company has increased from 2.79 in 2009 3.27
in 2013 which depicts that the liquidity position of the company has improved over the
period. The increase in the ratio reflects that company is able to pay its bills timely.
Does the company have the capacity to raise capital?
From the financial analysis of Nucor it can be observed that the debt to equity ratio is 0.92 in
2013 which reflects that the debt of the company is increasing. Therefore, in order to raise the
capital company needs to increase its equity.
Do the financials provide a competitive advantage? How?
Well-organized production competences allow Nucor to transfer its savings to
consumers with a competitive price.
The cost of capital of the company is very low which reflects that the company can
manufacture products at low cost and this can help company in attaining cost
leadership position in the market as compared to its competitors.
The employees of the company are also very skilled and experienced.
What are the implications of the financials for future strategy and for the execution of
strategy?
⊘ This is a preview!⊘
Do you want full access?
Subscribe today to unlock all pages.
Trusted by 1+ million students worldwide
STRATEGIC MANAGEMENT 9
The company need to expand its business and can invest in the advanced technology which
will help in producing low cost product with less emission. Along with company can expand
its business by increasing in the demand.
How does the company perform compared to its competitors?
As compared to the competitor Nucor is able to provide its products at low cost which
reflects increase in the revenue of the company and will attract more customers as compared
to the competitor because the price of the competitor’s products is high.
What is increasing – revenue, debt, costs, etc.? What is decreasing? What are the
implications?
From the financial analysis it can be observed that the revenue and debt of the
company are increasing.
Gross margin is being influenced the increasing cost of raw material which is
decreasing the Net Income of the company.
Nucor is experiencing growth in the revenue supports anticipation of the company
will expand because of increasing demand in the market.
Comparing growth with the refining revenue of the Nucor suggest that it is taking
benefit of economies of scale.
Is the company in a healthy or unhealthy position? Implications
Positive trend in the cash from operation and net working capital reflects that the
company will be profitable in the predictable feature.
Efficient utilization of capital and balancing of debt to equity ratio by raising funds
will provide opportunity to the company.
What are the spreads – revenue/costs, revenue/EBIT, revenue/debt?
Paraphrase This Document
Need a fresh take? Get an instant paraphrase of this document with our AI Paraphraser
STRATEGIC MANAGEMENT 10
Revenue/ costs = 488.02m (2013): In 2012 and 2013 the total income of the company
has decreased which reflects that the company needs to cover its cost.
Revenue/EBIT = 481.91m (2013): The decreasing revenue over EBIT suggests that
enhanced competence as earnings rises at a faster rate than Revenue.
Revenue/debt = 4.349315068: The declining revenue/debt ratio is a worry but it is
reliable in the trend of the company of arranging the capital requirement by debt.
Current Strategies of Company
Nucor Corporation’s current strategies are well handled by their administration in the matter
of compatibility with their central capabilities and the environment of business including both
internal and external environment. The united strategy of Nucor is normally built upon two
frames and they are input and output model and resource-based model (Appendix 2.2).
SWOT Analysis
Strength - The strength of Nucor Corporation are Exclusive Management Viewpoint, and
Cost Control (Appendix 2.3.1).
Weaknesses – Nucor Corporation weaknesses are Disclosure to Variation in Value of Scrap
Steel, Lack of Market Divergence or Diversification (Appendix 2.3.2).
Opportunities – The opportunities for the company are Extension by the acquisition of
weakening steel manufacturers, and Political Support in the Implementation of trade Law
(Appendix 2.3.3).
Threat – Company's threat is growing overseas competition in the domestic market and
Technology Advancement (Appendix 2.3.4).
STRATEGIC MANAGEMENT 11
Value Chain Analysis
Value chain analysis of Nucor Corporation reflects the strategies that help it by adding extra
value to the finished goods and examine those strategies in order to decrease the costs and
increase diversity (Appendix 2.4).
Competitor Analysis
The steel industry analysis fairly states the statistic that the segment has recently converted
into extremely competitive because of entry of low-cost products supplying companies in the
market. Maximum of the new participants in the market follow the price skimming strategy
which allows these companies to vend products with good quality at reasonable prices
(Appendix 2.5).
Key Strategic Issue
How to manage the effect of international low-cost goods in the steel industry? (Appendix
2.6)
Alternatives
The Nucor Corporation can invest some of the amounts in developing new steel
products that will help in overcoming the competition from the foreign companies.
New alternatives to steel, fresher blends with improvements in the range of product
will beat all type of competition Nucor is dealing with.
Nucor can also invest some efforts and cost in initiating a merger contract with an
international company to attain the opportunity and it will also support in the sector of
low cost. Partnership with the international company can also help in attaining the
competitive advantage as the base will become wider and can also introduce a new
market.
⊘ This is a preview!⊘
Do you want full access?
Subscribe today to unlock all pages.
Trusted by 1+ million students worldwide
1 out of 45
Related Documents


Your All-in-One AI-Powered Toolkit for Academic Success.
+13062052269
info@desklib.com
Available 24*7 on WhatsApp / Email
![[object Object]](/_next/static/media/star-bottom.7253800d.svg)
Unlock your academic potential
Copyright © 2020–2026 A2Z Services. All Rights Reserved. Developed and managed by ZUCOL.