MGT602 Business Decision Analysis Report - Absenteeism Study

Verified

Added on  2022/08/24

|15
|975
|16
Report
AI Summary
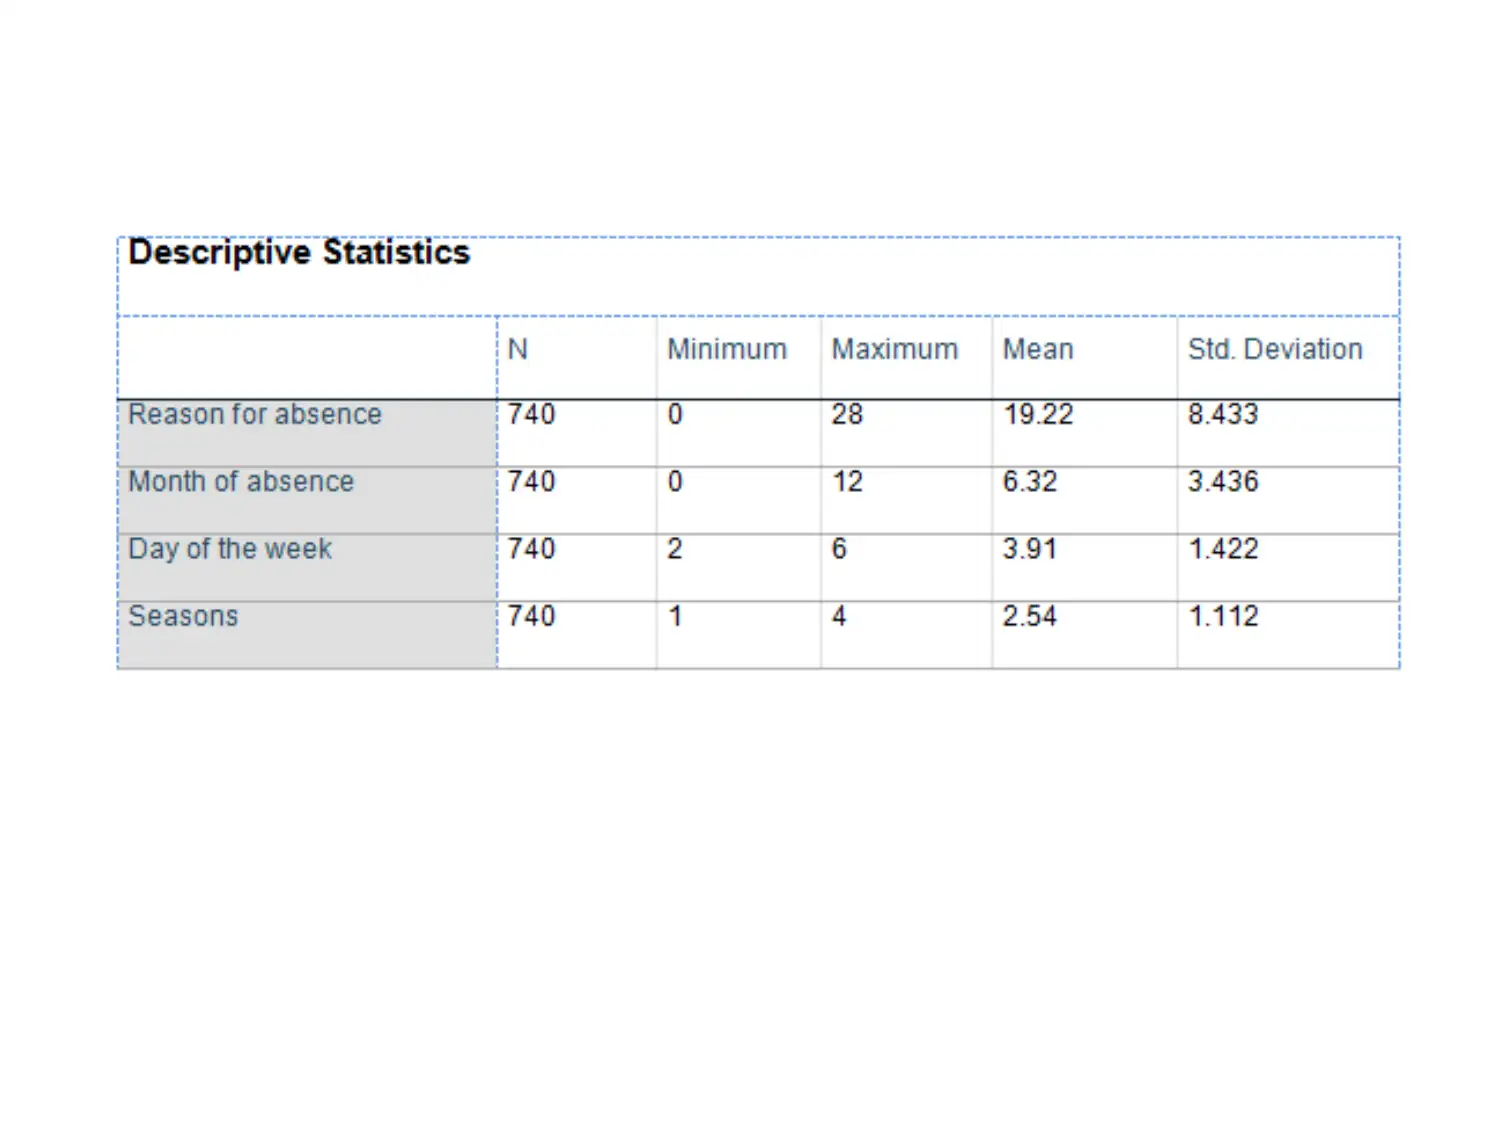
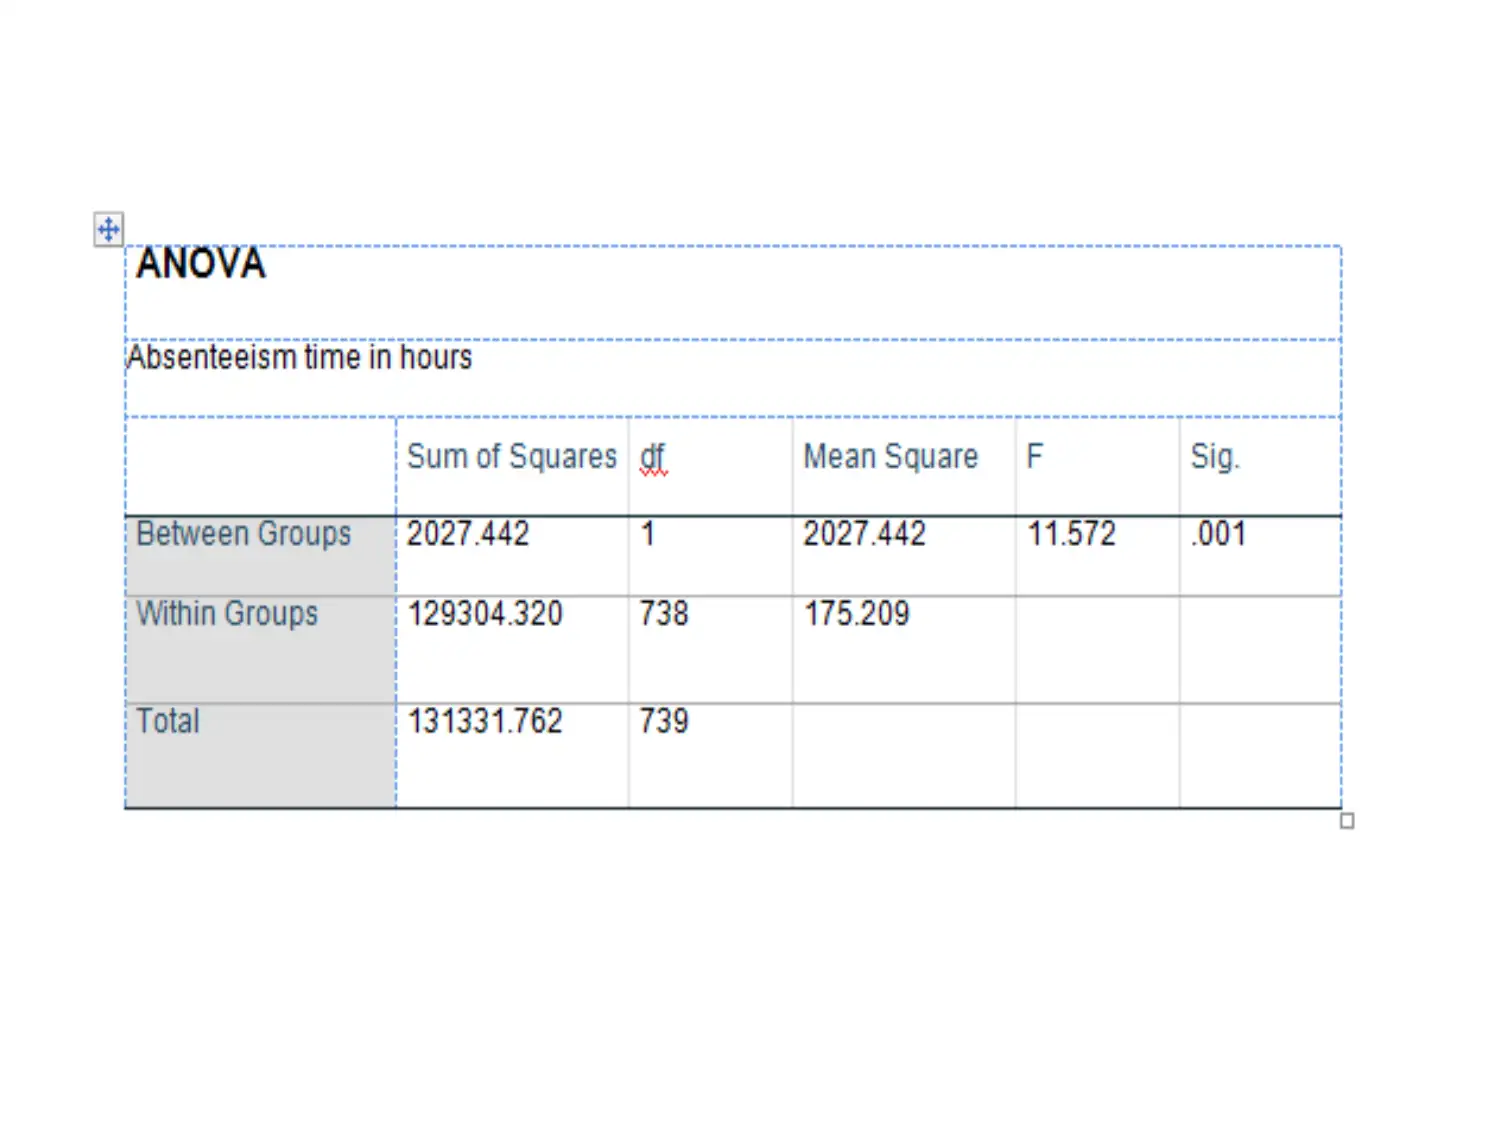
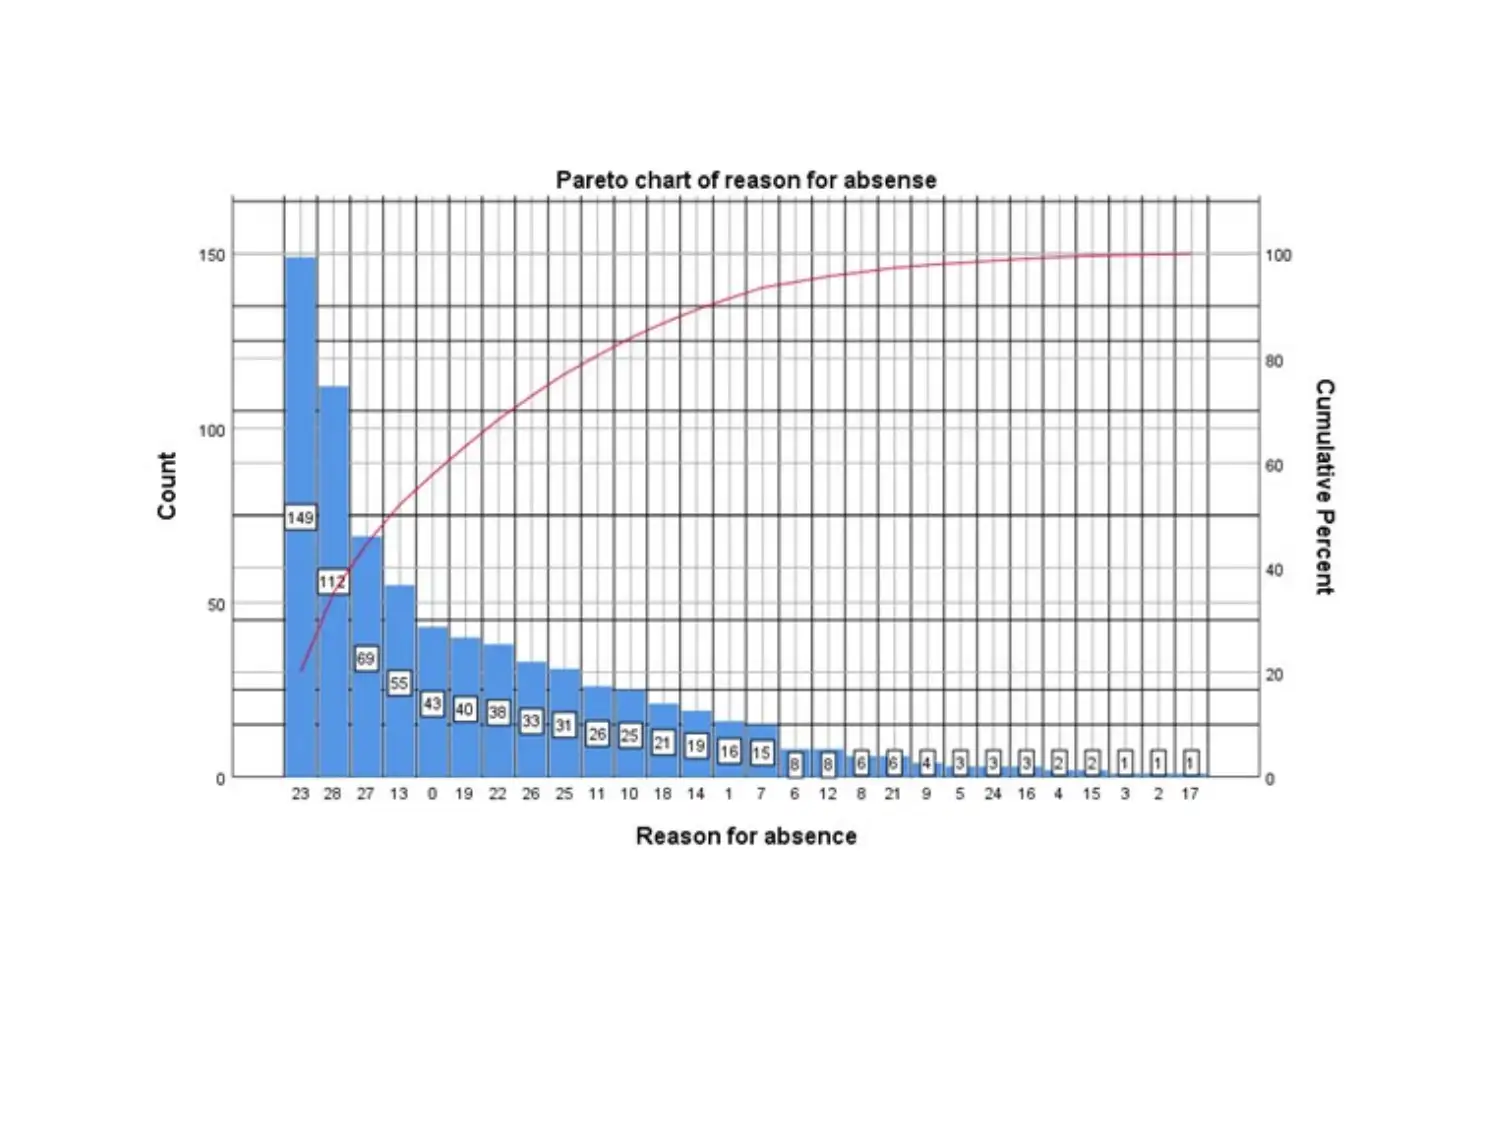
This report presents a business decision analysis focused on employee absenteeism within the IT sector. The study utilizes a dataset from the UCI Machine Learning Repository to investigate the factors influencing absenteeism. The analysis employs several decision-making tools, including regression analysis, ANOVA, and Pareto analysis, to identify significant variables and patterns. Regression analysis is used to determine the relationship between absenteeism and various factors, while ANOVA is applied to assess the variance across different categories. Pareto analysis helps pinpoint the most impactful factors contributing to absenteeism. The findings indicate that digestive system issues, specific days of the week (Monday, Tuesday, Wednesday), and employee characteristics (age, weight, BMI) are correlated with higher absenteeism rates. The report concludes by highlighting the successful application of statistical tools in identifying key factors, while also acknowledging limitations such as the dataset's sample size and potential lack of direct applicability to IT organizations. The study underscores the importance of data-driven decision-making in addressing workplace challenges and improving employee productivity.
Document Page
BUSINESS DECISION ANALYSIS
Name of Student:
Name of University:
Author Note:
tabler-icon-diamond-filled.svg

Secure Best Marks with AI Grader

Need help grading? Try our AI Grader for instant feedback on your assignments.
Document Page
INTRODUCTION
Decision making has a vital role to play in the achievement of
various organizational goals. It can be considered as a pervasive
function of the mangers that is aimed at accomplishing all the
organizational goals. Decision making is referred to as a process
that helps in selecting best course of action from among many of
the available alternatives. It is the responsibility of the
management in an organization to take vital decisions and at the
same time ascertain that these are carried out in accordance with
the defined goals. Decision making can be considered as the
medium through which the managerial functions such as planning,
directing, controlling and organizing are controlled. It is important
at each and every level of management (Kocakulah et al., 2016).
Document Page
PROBLEM DESCRIPTION
Absenteeism of employees in the workplace
Illness and injuries are to be considered
Disengagement
Burnout in IT industry
Lack of flexibility
Document Page
DATASET INFORMATION
The dataset which is used for the research is
obtained from the UCI machine learning
The attributes or variables of the dataset are
common for many organizations including IT
companies
The data is a multivariate set of data and is
real integer values
tabler-icon-diamond-filled.svg

Secure Best Marks with AI Grader

Need help grading? Try our AI Grader for instant feedback on your assignments.
Document Page
DECISION MAKING TOOLS
The decision making tools help the business
leaders in taking important decisions
Regression
Anova
Pareto analysis
Document Page
REGRESSION ANALYSIS
linear regression analysis performed to see
the relationship between the target
The backward linear method is applied to find
the most significant variables
Document Page
tabler-icon-diamond-filled.svg

Paraphrase This Document

Need a fresh take? Get an instant paraphrase of this document with our AI Paraphraser
Document Page
ANOVA
Analysis of variance is of great use
has a lot of significance in business
management.
This will help to come to conclusions that in
turn will enhance efficiency
performance of the IT firm.
This will help in evaluating the performance
Document Page
Document Page
PARETO ANALYSIS
This will help to identify the changes that need
to be done
for increasing the enthusiasm of the employees.
According to this analysis 20% of the factors are
frequent contributors to almost 80% of the
growth of the company.
In this context it can be used to find out the
characteristic of the employees
tabler-icon-diamond-filled.svg

Secure Best Marks with AI Grader

Need help grading? Try our AI Grader for instant feedback on your assignments.
Document Page
Document Page
RESULTS OF DECISION MAKING TOOLS
the results of each of the three decision tools
shows results that matches with the results of
other tools
The regression tool provides the most probable
variables that can effect absenteeism time in a
significant way
Anova proves that variation of categories in
those variable causes significantly different
absenteeism
Document Page
CONCLUSION
In conclusion it can be stated that the objective of the project has been
successfully met as the main factors responsible for the common
challenge in an IT workplace which is Absenteeism has been identified by
using a authenticated source of data and thus by analysis with statistical
decision making tools. The most absenteeism time is found for the
reasons of disease of digestive systems and people tends to absent more
on Monday, Tuesday and Wednesday. Also, people with two and three
has the higher absenteeism time than other and from regression
equation the people with more age and heavy weight and low body mass
index tends to increase the absenteeism time. However, it must be noted
that the findings may not exactly accurate as sample size of dataset is
only 740 and the data is collected from a courier company in Brazil which
may not have exactly same characteristics of an IT organization.
tabler-icon-diamond-filled.svg

Paraphrase This Document

Need a fresh take? Get an instant paraphrase of this document with our AI Paraphraser
Document Page
BIBLIOGRAPHY
Kocakulah, M. C., Kelley, A. G., Mitchell, K. M., &Ruggieri, M. P. (2016). Absenteeism problems and costs:
causes, effects and cures. International Business & Economics Research Journal (IBER), 15(3), 89-96.
Randhawa, N. (2017). Employee Absenteeism—Indian Industry Perspective. Imperial Journal of
Interdisciplinary Research, 3(7), 35-42.
Nanjundeswaraswamy, T. (2016). An empirical study on absenteeism in Garment industry. Management
Science Letters, 6(4), 275-284.
UCI Machine Learning Repository: Absenteeism at work Data Set. (2020). Retrieved 18 January 2020, from
https://archive.ics.uci.edu/ml/datasets/Absenteeism+at+work
Durbarry, R. (2017). Analysing quantitative data using SPSS. In Research Methods for Tourism Students (pp.
219-248). Routledge.
Astivia, O. L. O., &Zumbo, B. D. (2019). Heteroskedasticity in Multiple Regression Analysis: What it is, How to
Detect it and How to Solve it with Applications in R and SPSS. Practical Assessment, Research &
Evaluation, 24(1), 2.
Cronk, B. C. (2019). How to use SPSS®: A step-by-step guide to analysis and interpretation. Routledge.
Subramani, T., &Arsath, M. (2018). Evaluation of Quality Management System by Implementing Quality Matrix
in Residential Projects Using SPSS. International Journal of Engineering & Technology, 7(3.10), 5-9.
Aljandali, A. (2016). Quantitative Analysis and IBM® SPSS® Statistics. Springer International Publishing.
Strunk, K. K., &Mwavita, M. (2020). Design and Analysis in Educational Research: ANOVA Designs in SPSS®.
Ong, M. H. A., &Puteh, F. (2017). Quantitative Data Analysis: Choosing Between SPSS, PLS, and AMOS in Social
Science Research. International Interdisciplinary Journal of Scientific Research, 3(1), 14-25.
Opie, C. (2019). USING EXCEL/SPSS IN YOUR RESEARCH. Getting Started in Your Educational Research: Design,
Data Production and Analysis, 309.
Document Page
chevron_up_icon
1 out of 15
circle_padding
hide_on_mobile
zoom_out_icon
logo.png

Your All-in-One AI-Powered Toolkit for Academic Success.

Available 24*7 on WhatsApp / Email

[object Object]