BSBFIA402 Business Accounting: Financial Activity Report Analysis
VerifiedAdded on 2023/06/04
|12
|2553
|386
Report
AI Summary
This business accounting assignment comprises a financial report analyzing a company's financial activities. Part A includes the identification and valuation of assets and liabilities, a comparison of the profit and loss account with the budget, and the identification of unusual items with corresponding recommendations. It also involves the computation and analysis of employee mobile phone expenditures and variance analysis. Part B provides a trend analysis of actual performance against budgeted performance, calculates average profit or cost per unit, and identifies significant areas for improvement. Recommendations for the company include budget modifications and focusing on key cost reductions and process improvements to enhance overall performance and profitability. This document is available on Desklib, a platform that offers a range of study tools and resources for students.
Business Accounting
Assignment
Assignment
Paraphrase This Document
Need a fresh take? Get an instant paraphrase of this document with our AI Paraphraser
1
By student name
Professor
University
Date: 25 April 2018.
1 | P a g e
By student name
Professor
University
Date: 25 April 2018.
1 | P a g e
2
Executive Summary
A financial report has been prepared including two parts. The first part deals with identification of the
assets and the liabilities, which have been valued by the company. Furthermore, the profit and loss
account of the entity has been compared with the budget and the unusual feature or the query has
been listed along with the deviation or the discrepancy found. Recommendation has been given as to
how to solve the same. In the second part, the computation and analysis of the mobile phone
expenditure of the employees has been done and variance has been computed. In the 3rd section of the
assignment, profit and loss account, operating budget and the actual results have been given all of
which has been analysed to prepare a report on the same.
2 | P a g e
⊘ This is a preview!⊘
Do you want full access?
Subscribe today to unlock all pages.
Trusted by 1+ million students worldwide
3
Contents
Executive Summary.....................................................................................................................................2
Outline.........................................................................................................................................................4
Background..................................................................................................................................................4
The Proposal................................................................................................................................................4
Risks.............................................................................................................................................................5
Process........................................................................................................................................................5
Requirement of Resources..........................................................................................................................6
Reporting of the outcomes..........................................................................................................................6
References.................................................................................................................................................13
3 | P a g e
Paraphrase This Document
Need a fresh take? Get an instant paraphrase of this document with our AI Paraphraser
4
Part A
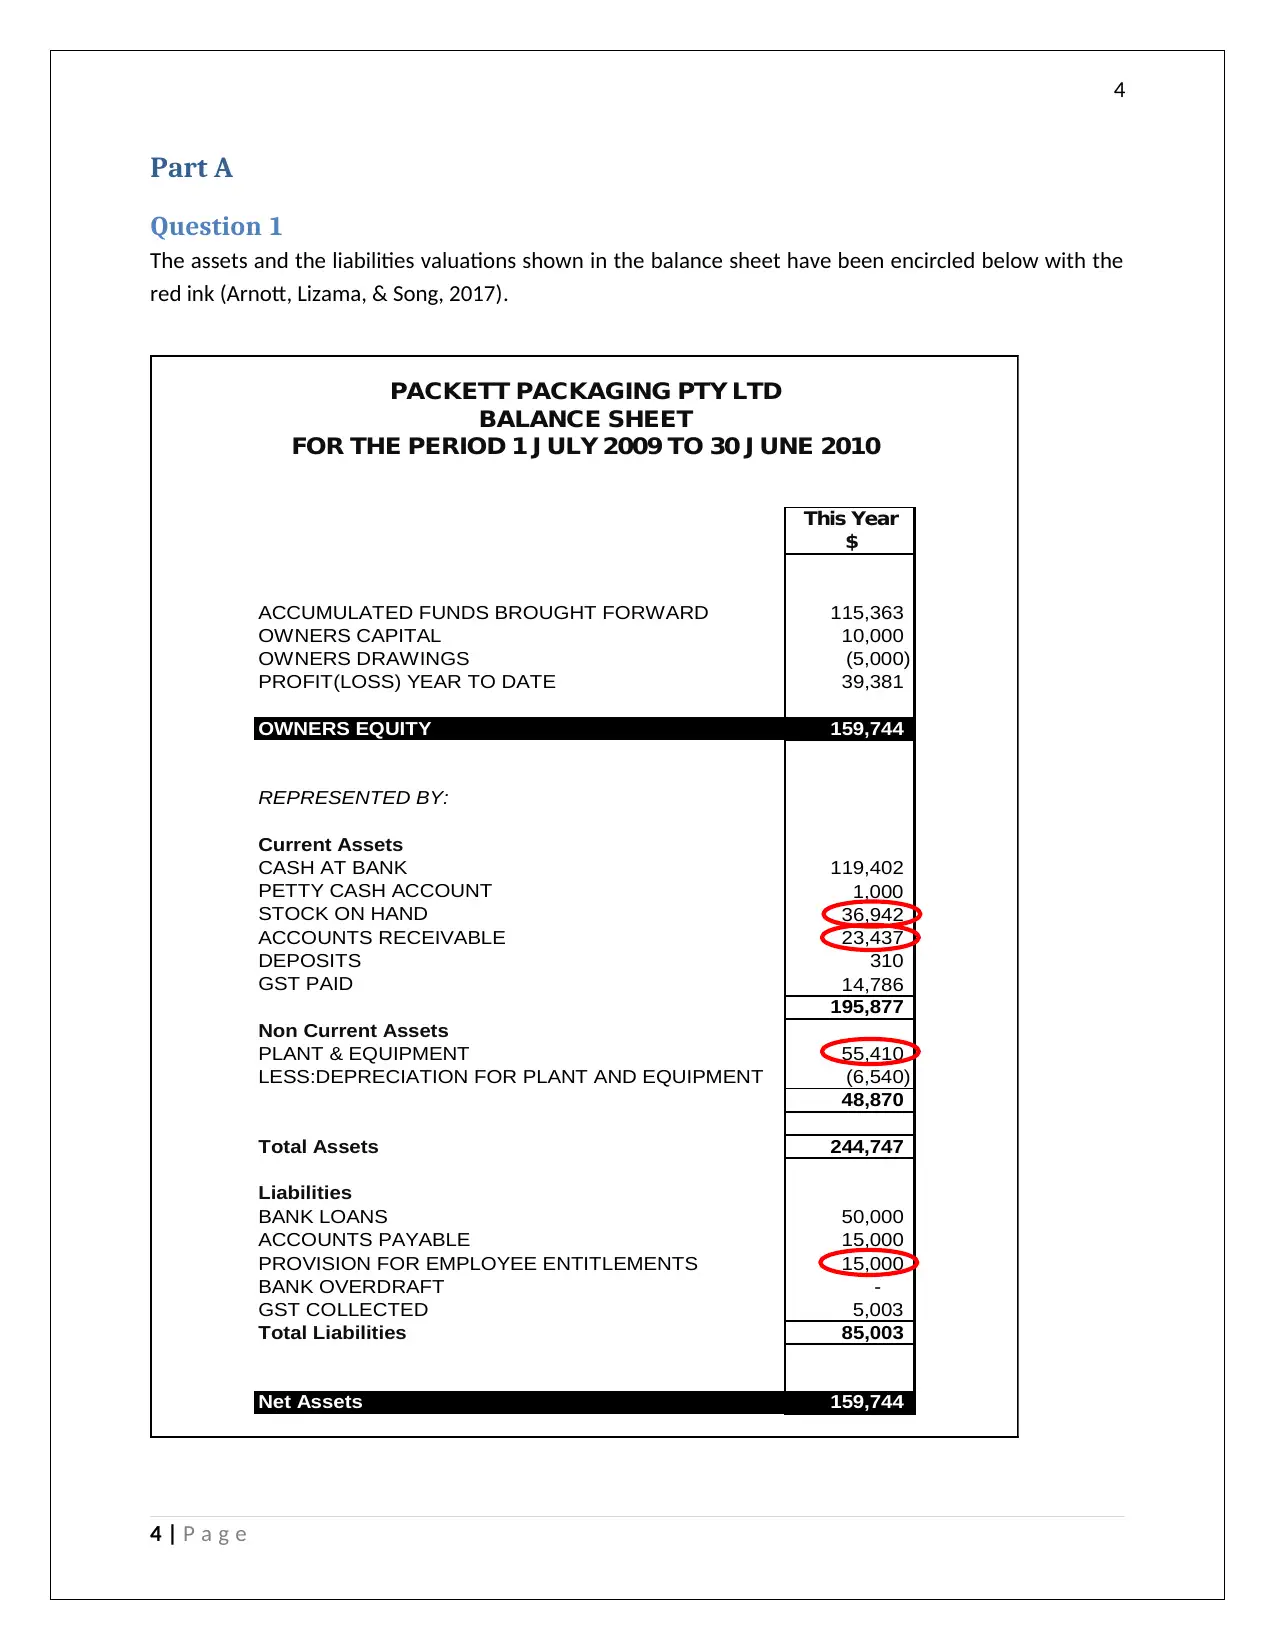
Question 1
The assets and the liabilities valuations shown in the balance sheet have been encircled below with the
red ink (Arnott, Lizama, & Song, 2017).
This Year
$
ACCUMULATED FUNDS BROUGHT FORWARD 115,363
OWNERS CAPITAL 10,000
OWNERS DRAWINGS (5,000)
PROFIT(LOSS) YEAR TO DATE 39,381
OWNERS EQUITY 159,744
REPRESENTED BY:
Current Assets
CASH AT BANK 119,402
PETTY CASH ACCOUNT 1,000
STOCK ON HAND 36,942
ACCOUNTS RECEIVABLE 23,437
DEPOSITS 310
GST PAID 14,786
195,877
Non Current Assets
PLANT & EQUIPMENT 55,410
LESS:DEPRECIATION FOR PLANT AND EQUIPMENT (6,540)
48,870
Total Assets 244,747
Liabilities
BANK LOANS 50,000
ACCOUNTS PAYABLE 15,000
PROVISION FOR EMPLOYEE ENTITLEMENTS 15,000
BANK OVERDRAFT -
GST COLLECTED 5,003
Total Liabilities 85,003
Net Assets 159,744
PACKETT PACKAGING PTY LTD
BALANCE SHEET
FOR THE PERIOD 1 J ULY 2009 TO 30 J UNE 2010
4 | P a g e
Part A
Question 1
The assets and the liabilities valuations shown in the balance sheet have been encircled below with the
red ink (Arnott, Lizama, & Song, 2017).
This Year
$
ACCUMULATED FUNDS BROUGHT FORWARD 115,363
OWNERS CAPITAL 10,000
OWNERS DRAWINGS (5,000)
PROFIT(LOSS) YEAR TO DATE 39,381
OWNERS EQUITY 159,744
REPRESENTED BY:
Current Assets
CASH AT BANK 119,402
PETTY CASH ACCOUNT 1,000
STOCK ON HAND 36,942
ACCOUNTS RECEIVABLE 23,437
DEPOSITS 310
GST PAID 14,786
195,877
Non Current Assets
PLANT & EQUIPMENT 55,410
LESS:DEPRECIATION FOR PLANT AND EQUIPMENT (6,540)
48,870
Total Assets 244,747
Liabilities
BANK LOANS 50,000
ACCOUNTS PAYABLE 15,000
PROVISION FOR EMPLOYEE ENTITLEMENTS 15,000
BANK OVERDRAFT -
GST COLLECTED 5,003
Total Liabilities 85,003
Net Assets 159,744
PACKETT PACKAGING PTY LTD
BALANCE SHEET
FOR THE PERIOD 1 J ULY 2009 TO 30 J UNE 2010
4 | P a g e
5
In the above table, four accounts, which require valuation, has been marked. They are receivables,
inventory, property, plant, equipment, and the provision for employee entitlements.
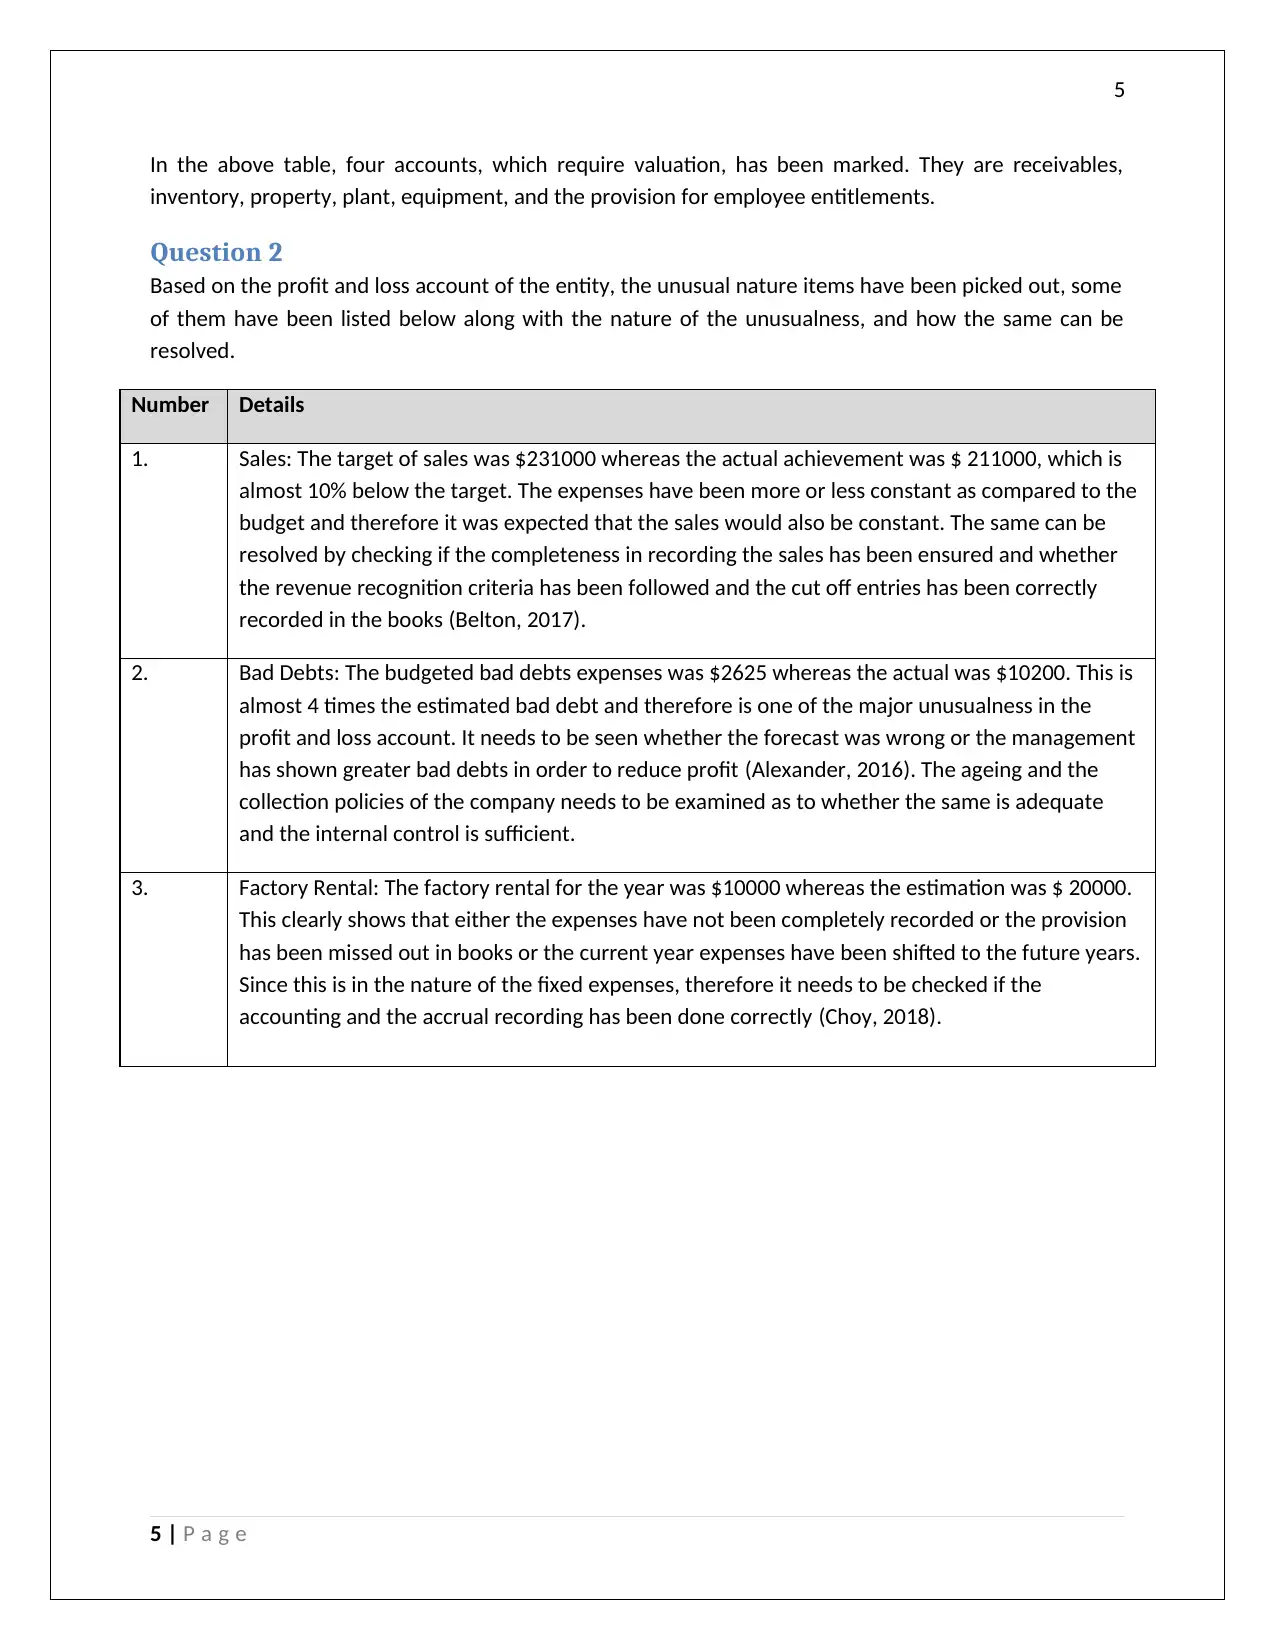
Question 2
Based on the profit and loss account of the entity, the unusual nature items have been picked out, some
of them have been listed below along with the nature of the unusualness, and how the same can be
resolved.
Number Details
1. Sales: The target of sales was $231000 whereas the actual achievement was $ 211000, which is
almost 10% below the target. The expenses have been more or less constant as compared to the
budget and therefore it was expected that the sales would also be constant. The same can be
resolved by checking if the completeness in recording the sales has been ensured and whether
the revenue recognition criteria has been followed and the cut off entries has been correctly
recorded in the books (Belton, 2017).
2. Bad Debts: The budgeted bad debts expenses was $2625 whereas the actual was $10200. This is
almost 4 times the estimated bad debt and therefore is one of the major unusualness in the
profit and loss account. It needs to be seen whether the forecast was wrong or the management
has shown greater bad debts in order to reduce profit (Alexander, 2016). The ageing and the
collection policies of the company needs to be examined as to whether the same is adequate
and the internal control is sufficient.
3. Factory Rental: The factory rental for the year was $10000 whereas the estimation was $ 20000.
This clearly shows that either the expenses have not been completely recorded or the provision
has been missed out in books or the current year expenses have been shifted to the future years.
Since this is in the nature of the fixed expenses, therefore it needs to be checked if the
accounting and the accrual recording has been done correctly (Choy, 2018).
5 | P a g e
In the above table, four accounts, which require valuation, has been marked. They are receivables,
inventory, property, plant, equipment, and the provision for employee entitlements.
Question 2
Based on the profit and loss account of the entity, the unusual nature items have been picked out, some
of them have been listed below along with the nature of the unusualness, and how the same can be
resolved.
Number Details
1. Sales: The target of sales was $231000 whereas the actual achievement was $ 211000, which is
almost 10% below the target. The expenses have been more or less constant as compared to the
budget and therefore it was expected that the sales would also be constant. The same can be
resolved by checking if the completeness in recording the sales has been ensured and whether
the revenue recognition criteria has been followed and the cut off entries has been correctly
recorded in the books (Belton, 2017).
2. Bad Debts: The budgeted bad debts expenses was $2625 whereas the actual was $10200. This is
almost 4 times the estimated bad debt and therefore is one of the major unusualness in the
profit and loss account. It needs to be seen whether the forecast was wrong or the management
has shown greater bad debts in order to reduce profit (Alexander, 2016). The ageing and the
collection policies of the company needs to be examined as to whether the same is adequate
and the internal control is sufficient.
3. Factory Rental: The factory rental for the year was $10000 whereas the estimation was $ 20000.
This clearly shows that either the expenses have not been completely recorded or the provision
has been missed out in books or the current year expenses have been shifted to the future years.
Since this is in the nature of the fixed expenses, therefore it needs to be checked if the
accounting and the accrual recording has been done correctly (Choy, 2018).
5 | P a g e
⊘ This is a preview!⊘
Do you want full access?
Subscribe today to unlock all pages.
Trusted by 1+ million students worldwide
6
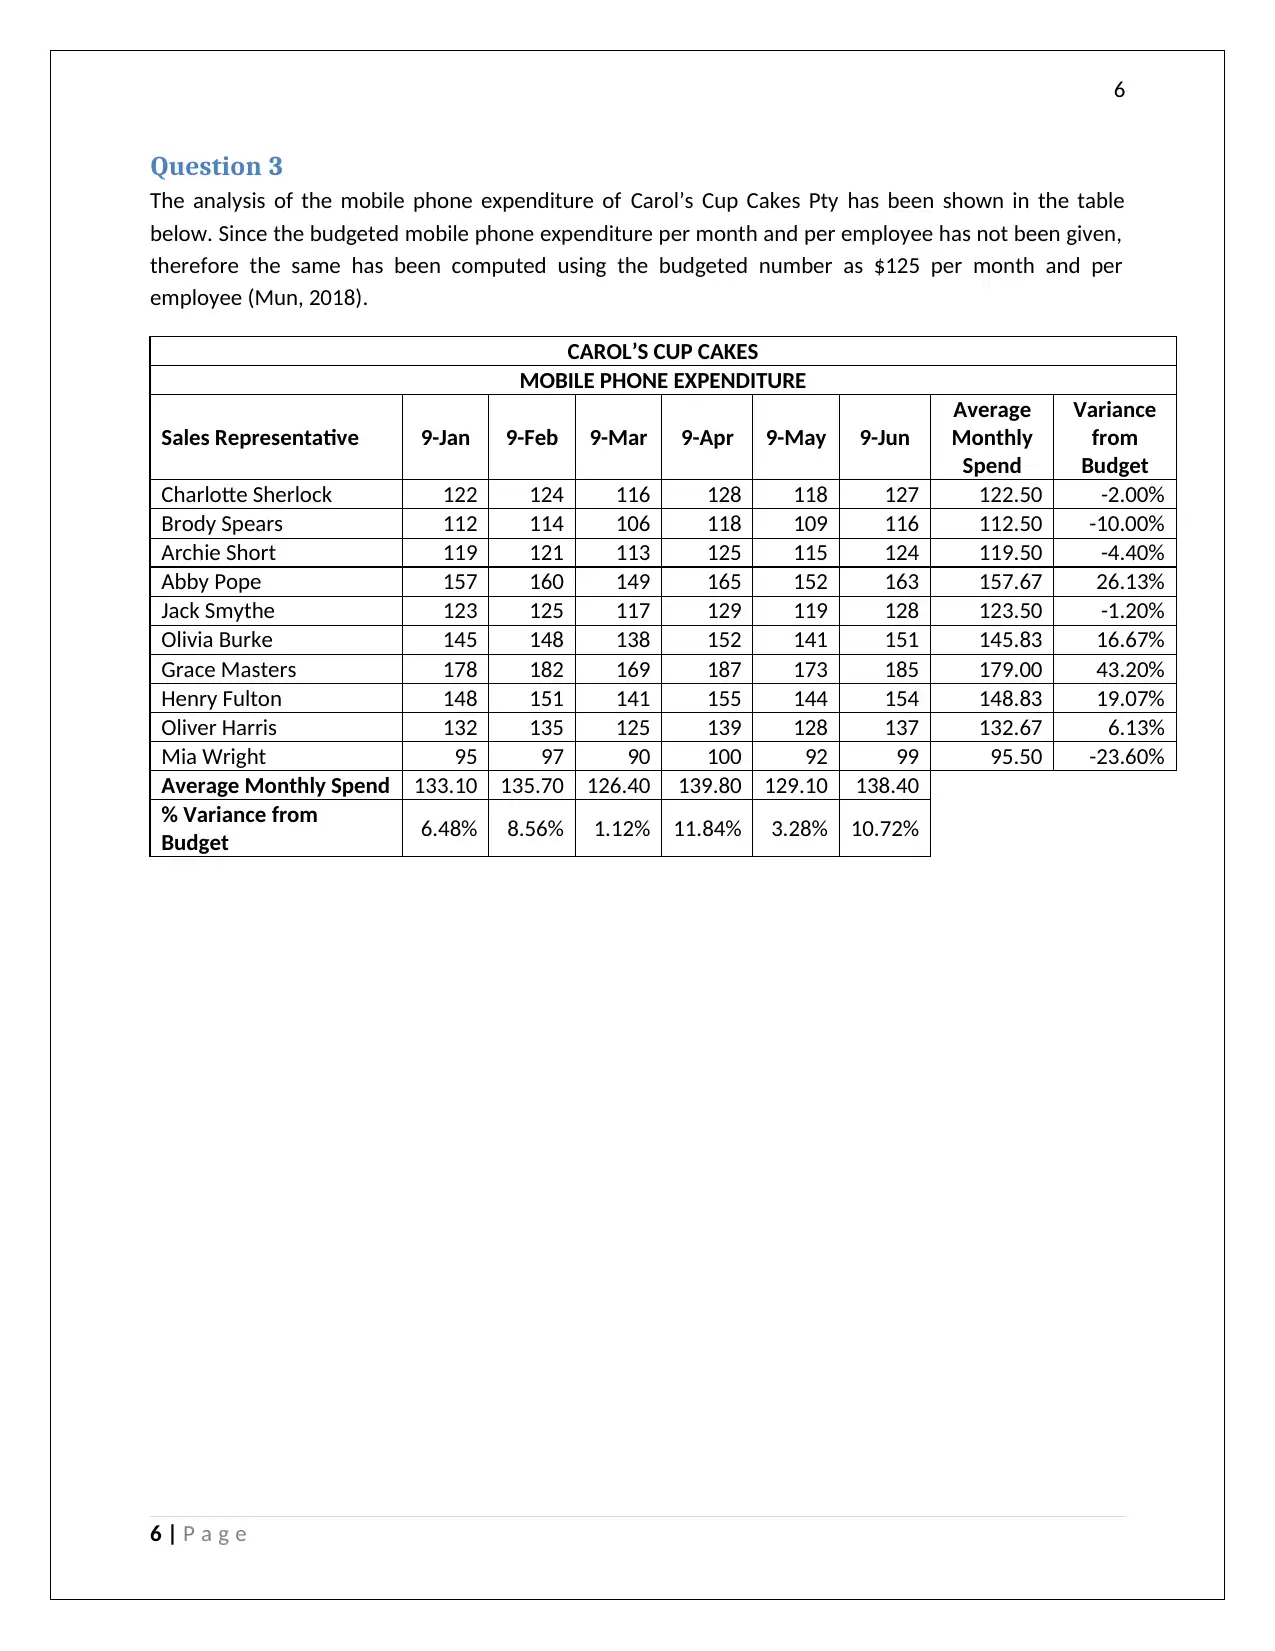
Question 3
The analysis of the mobile phone expenditure of Carol’s Cup Cakes Pty has been shown in the table
below. Since the budgeted mobile phone expenditure per month and per employee has not been given,
therefore the same has been computed using the budgeted number as $125 per month and per
employee (Mun, 2018).
CAROL’S CUP CAKES
MOBILE PHONE EXPENDITURE
Sales Representative 9-Jan 9-Feb 9-Mar 9-Apr 9-May 9-Jun
Average
Monthly
Spend
Variance
from
Budget
Charlotte Sherlock 122 124 116 128 118 127 122.50 -2.00%
Brody Spears 112 114 106 118 109 116 112.50 -10.00%
Archie Short 119 121 113 125 115 124 119.50 -4.40%
Abby Pope 157 160 149 165 152 163 157.67 26.13%
Jack Smythe 123 125 117 129 119 128 123.50 -1.20%
Olivia Burke 145 148 138 152 141 151 145.83 16.67%
Grace Masters 178 182 169 187 173 185 179.00 43.20%
Henry Fulton 148 151 141 155 144 154 148.83 19.07%
Oliver Harris 132 135 125 139 128 137 132.67 6.13%
Mia Wright 95 97 90 100 92 99 95.50 -23.60%
Average Monthly Spend 133.10 135.70 126.40 139.80 129.10 138.40
% Variance from
Budget 6.48% 8.56% 1.12% 11.84% 3.28% 10.72%
6 | P a g e
Paraphrase This Document
Need a fresh take? Get an instant paraphrase of this document with our AI Paraphraser
7
Part B
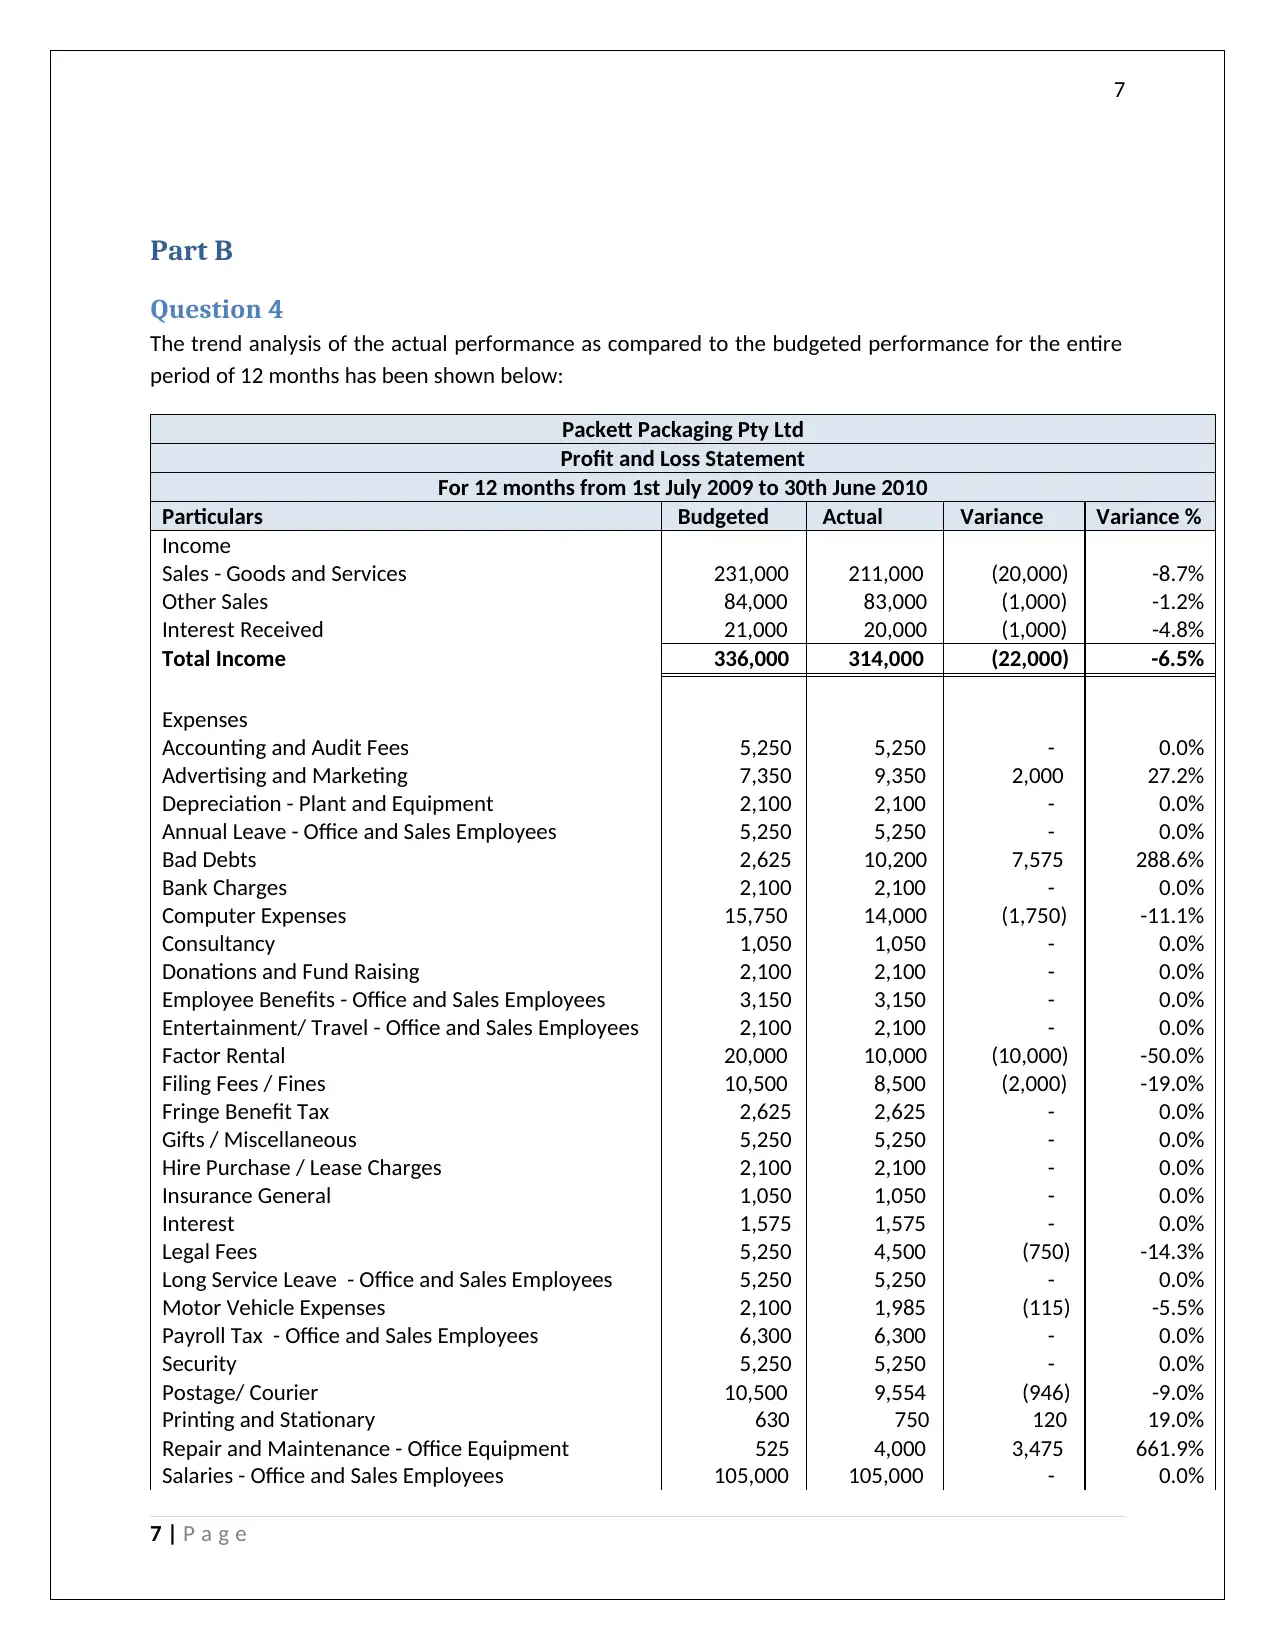
Question 4
The trend analysis of the actual performance as compared to the budgeted performance for the entire
period of 12 months has been shown below:
Packett Packaging Pty Ltd
Profit and Loss Statement
For 12 months from 1st July 2009 to 30th June 2010
Particulars Budgeted Actual Variance Variance %
Income
Sales - Goods and Services 231,000 211,000 (20,000) -8.7%
Other Sales 84,000 83,000 (1,000) -1.2%
Interest Received 21,000 20,000 (1,000) -4.8%
Total Income 336,000 314,000 (22,000) -6.5%
Expenses
Accounting and Audit Fees 5,250 5,250 - 0.0%
Advertising and Marketing 7,350 9,350 2,000 27.2%
Depreciation - Plant and Equipment 2,100 2,100 - 0.0%
Annual Leave - Office and Sales Employees 5,250 5,250 - 0.0%
Bad Debts 2,625 10,200 7,575 288.6%
Bank Charges 2,100 2,100 - 0.0%
Computer Expenses 15,750 14,000 (1,750) -11.1%
Consultancy 1,050 1,050 - 0.0%
Donations and Fund Raising 2,100 2,100 - 0.0%
Employee Benefits - Office and Sales Employees 3,150 3,150 - 0.0%
Entertainment/ Travel - Office and Sales Employees 2,100 2,100 - 0.0%
Factor Rental 20,000 10,000 (10,000) -50.0%
Filing Fees / Fines 10,500 8,500 (2,000) -19.0%
Fringe Benefit Tax 2,625 2,625 - 0.0%
Gifts / Miscellaneous 5,250 5,250 - 0.0%
Hire Purchase / Lease Charges 2,100 2,100 - 0.0%
Insurance General 1,050 1,050 - 0.0%
Interest 1,575 1,575 - 0.0%
Legal Fees 5,250 4,500 (750) -14.3%
Long Service Leave - Office and Sales Employees 5,250 5,250 - 0.0%
Motor Vehicle Expenses 2,100 1,985 (115) -5.5%
Payroll Tax - Office and Sales Employees 6,300 6,300 - 0.0%
Security 5,250 5,250 - 0.0%
Postage/ Courier 10,500 9,554 (946) -9.0%
Printing and Stationary 630 750 120 19.0%
Repair and Maintenance - Office Equipment 525 4,000 3,475 661.9%
Salaries - Office and Sales Employees 105,000 105,000 - 0.0%
7 | P a g e
Part B
Question 4
The trend analysis of the actual performance as compared to the budgeted performance for the entire
period of 12 months has been shown below:
Packett Packaging Pty Ltd
Profit and Loss Statement
For 12 months from 1st July 2009 to 30th June 2010
Particulars Budgeted Actual Variance Variance %
Income
Sales - Goods and Services 231,000 211,000 (20,000) -8.7%
Other Sales 84,000 83,000 (1,000) -1.2%
Interest Received 21,000 20,000 (1,000) -4.8%
Total Income 336,000 314,000 (22,000) -6.5%
Expenses
Accounting and Audit Fees 5,250 5,250 - 0.0%
Advertising and Marketing 7,350 9,350 2,000 27.2%
Depreciation - Plant and Equipment 2,100 2,100 - 0.0%
Annual Leave - Office and Sales Employees 5,250 5,250 - 0.0%
Bad Debts 2,625 10,200 7,575 288.6%
Bank Charges 2,100 2,100 - 0.0%
Computer Expenses 15,750 14,000 (1,750) -11.1%
Consultancy 1,050 1,050 - 0.0%
Donations and Fund Raising 2,100 2,100 - 0.0%
Employee Benefits - Office and Sales Employees 3,150 3,150 - 0.0%
Entertainment/ Travel - Office and Sales Employees 2,100 2,100 - 0.0%
Factor Rental 20,000 10,000 (10,000) -50.0%
Filing Fees / Fines 10,500 8,500 (2,000) -19.0%
Fringe Benefit Tax 2,625 2,625 - 0.0%
Gifts / Miscellaneous 5,250 5,250 - 0.0%
Hire Purchase / Lease Charges 2,100 2,100 - 0.0%
Insurance General 1,050 1,050 - 0.0%
Interest 1,575 1,575 - 0.0%
Legal Fees 5,250 4,500 (750) -14.3%
Long Service Leave - Office and Sales Employees 5,250 5,250 - 0.0%
Motor Vehicle Expenses 2,100 1,985 (115) -5.5%
Payroll Tax - Office and Sales Employees 6,300 6,300 - 0.0%
Security 5,250 5,250 - 0.0%
Postage/ Courier 10,500 9,554 (946) -9.0%
Printing and Stationary 630 750 120 19.0%
Repair and Maintenance - Office Equipment 525 4,000 3,475 661.9%
Salaries - Office and Sales Employees 105,000 105,000 - 0.0%
7 | P a g e
8
Staff Amenities - Office and Sales Employees 1,050 950 (100) -9.5%
Staff Training Courses - Office and Sales Employees 10,500 10,500 - 0.0%
Staff Uniform - Office and Sales Employees 1,575 1,575 - 0.0%
Superannuation - Office and Sales Employees 9,450 9,450 - 0.0%
Sundry Expenses 945 805 (140) -14.8%
Telephone expenses 10,500 10,500 - 0.0%
Workers Comp - Office and Sales Employees 10,500 10,500 - 0.0%
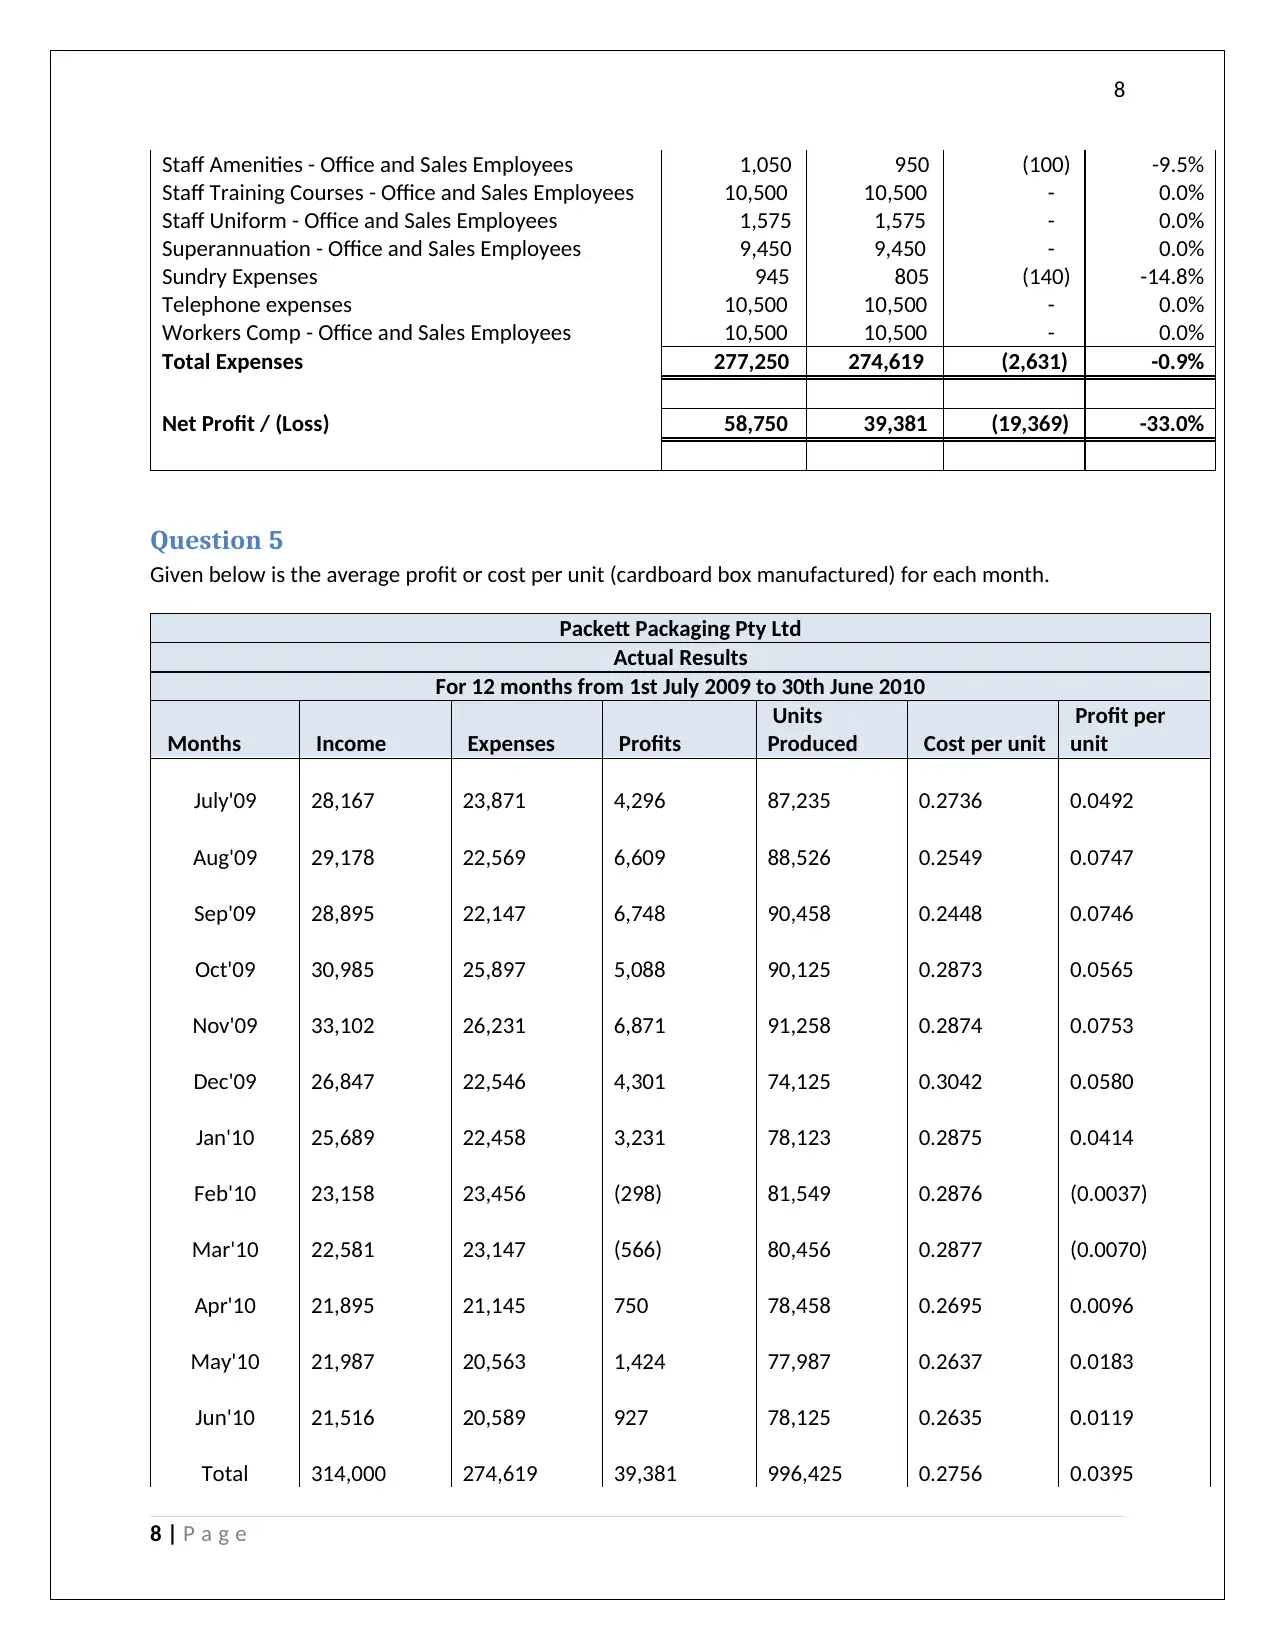
Total Expenses 277,250 274,619 (2,631) -0.9%
Net Profit / (Loss) 58,750 39,381 (19,369) -33.0%
Question 5
Given below is the average profit or cost per unit (cardboard box manufactured) for each month.
Packett Packaging Pty Ltd
Actual Results
For 12 months from 1st July 2009 to 30th June 2010
Months Income Expenses Profits
Units
Produced Cost per unit
Profit per
unit
July'09 28,167 23,871 4,296 87,235 0.2736 0.0492
Aug'09 29,178 22,569 6,609 88,526 0.2549 0.0747
Sep'09 28,895 22,147 6,748 90,458 0.2448 0.0746
Oct'09 30,985 25,897 5,088 90,125 0.2873 0.0565
Nov'09 33,102 26,231 6,871 91,258 0.2874 0.0753
Dec'09 26,847 22,546 4,301 74,125 0.3042 0.0580
Jan'10 25,689 22,458 3,231 78,123 0.2875 0.0414
Feb'10 23,158 23,456 (298) 81,549 0.2876 (0.0037)
Mar'10 22,581 23,147 (566) 80,456 0.2877 (0.0070)
Apr'10 21,895 21,145 750 78,458 0.2695 0.0096
May'10 21,987 20,563 1,424 77,987 0.2637 0.0183
Jun'10 21,516 20,589 927 78,125 0.2635 0.0119
Total 314,000 274,619 39,381 996,425 0.2756 0.0395
8 | P a g e
Staff Amenities - Office and Sales Employees 1,050 950 (100) -9.5%
Staff Training Courses - Office and Sales Employees 10,500 10,500 - 0.0%
Staff Uniform - Office and Sales Employees 1,575 1,575 - 0.0%
Superannuation - Office and Sales Employees 9,450 9,450 - 0.0%
Sundry Expenses 945 805 (140) -14.8%
Telephone expenses 10,500 10,500 - 0.0%
Workers Comp - Office and Sales Employees 10,500 10,500 - 0.0%
Total Expenses 277,250 274,619 (2,631) -0.9%
Net Profit / (Loss) 58,750 39,381 (19,369) -33.0%
Question 5
Given below is the average profit or cost per unit (cardboard box manufactured) for each month.
Packett Packaging Pty Ltd
Actual Results
For 12 months from 1st July 2009 to 30th June 2010
Months Income Expenses Profits
Units
Produced Cost per unit
Profit per
unit
July'09 28,167 23,871 4,296 87,235 0.2736 0.0492
Aug'09 29,178 22,569 6,609 88,526 0.2549 0.0747
Sep'09 28,895 22,147 6,748 90,458 0.2448 0.0746
Oct'09 30,985 25,897 5,088 90,125 0.2873 0.0565
Nov'09 33,102 26,231 6,871 91,258 0.2874 0.0753
Dec'09 26,847 22,546 4,301 74,125 0.3042 0.0580
Jan'10 25,689 22,458 3,231 78,123 0.2875 0.0414
Feb'10 23,158 23,456 (298) 81,549 0.2876 (0.0037)
Mar'10 22,581 23,147 (566) 80,456 0.2877 (0.0070)
Apr'10 21,895 21,145 750 78,458 0.2695 0.0096
May'10 21,987 20,563 1,424 77,987 0.2637 0.0183
Jun'10 21,516 20,589 927 78,125 0.2635 0.0119
Total 314,000 274,619 39,381 996,425 0.2756 0.0395
8 | P a g e
⊘ This is a preview!⊘
Do you want full access?
Subscribe today to unlock all pages.
Trusted by 1+ million students worldwide
9
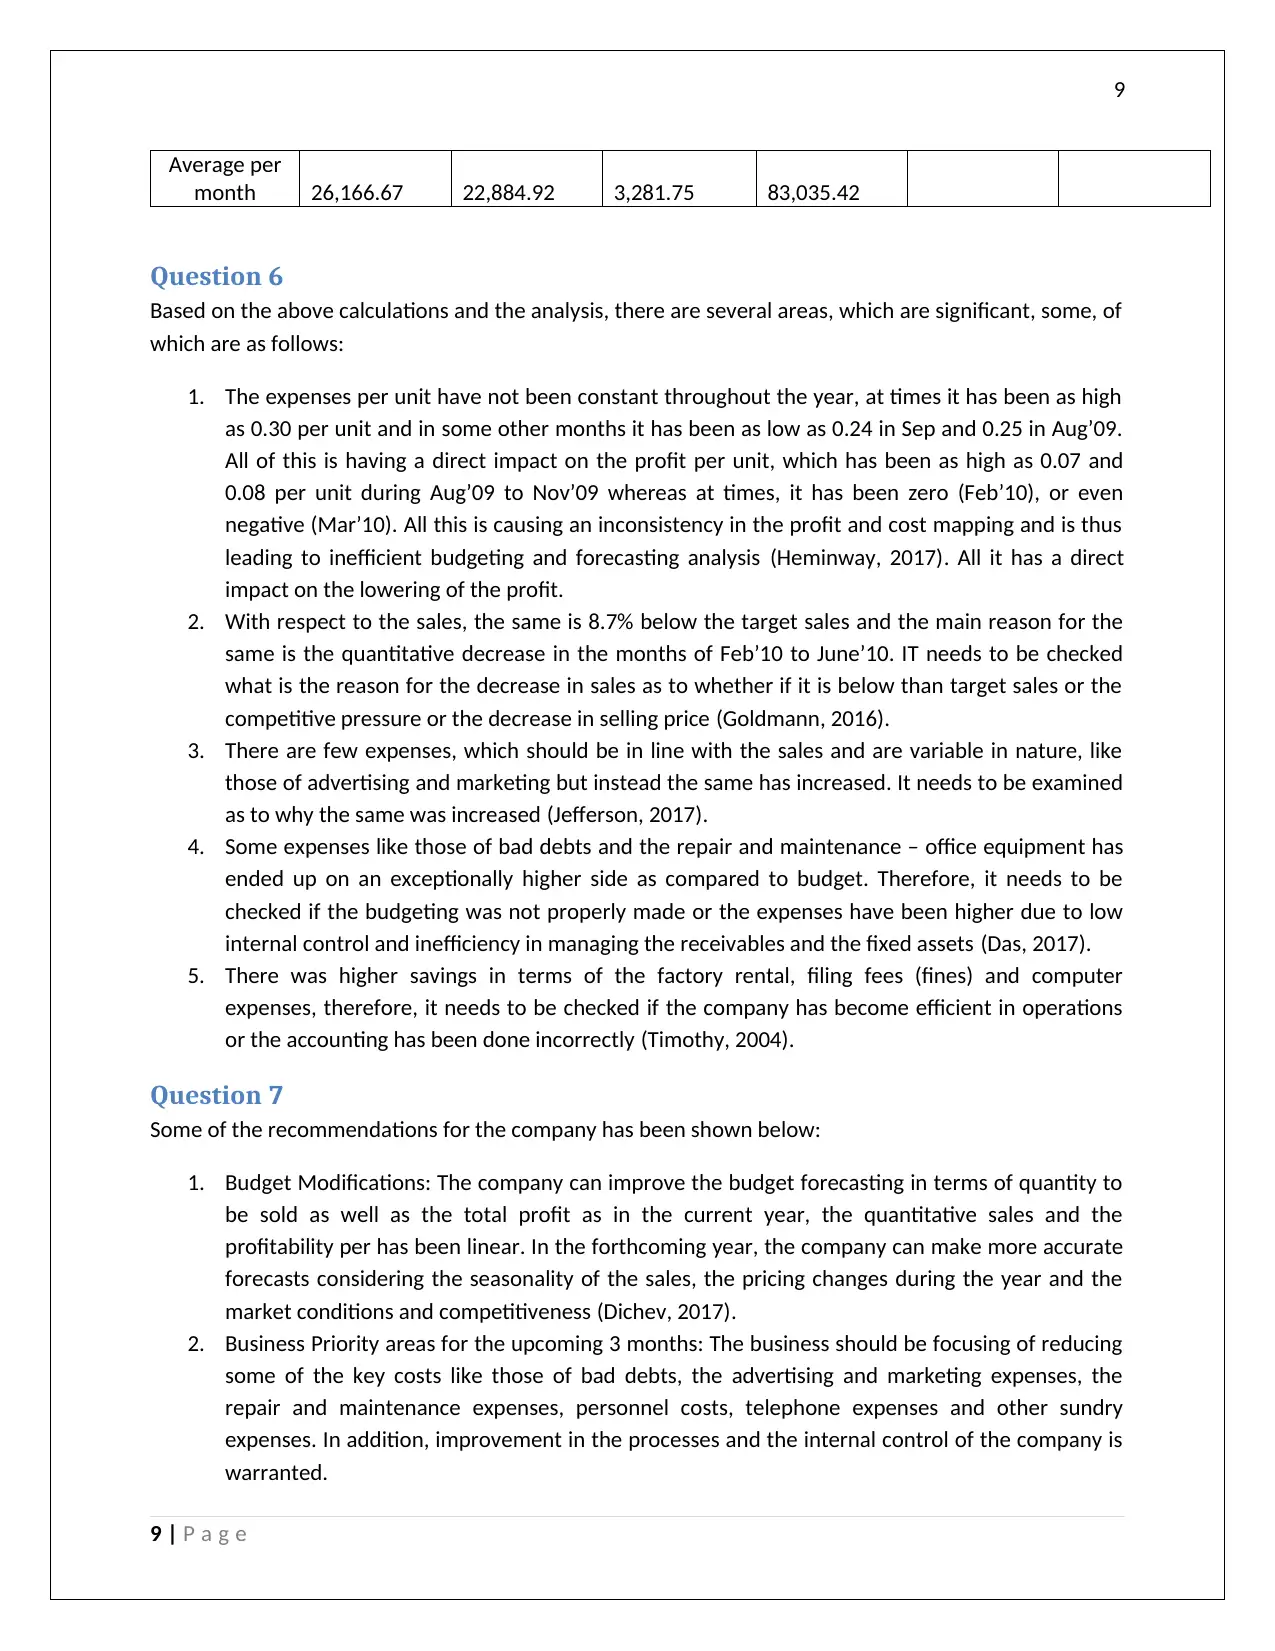
Average per
month 26,166.67 22,884.92 3,281.75 83,035.42
Question 6
Based on the above calculations and the analysis, there are several areas, which are significant, some, of
which are as follows:
1. The expenses per unit have not been constant throughout the year, at times it has been as high
as 0.30 per unit and in some other months it has been as low as 0.24 in Sep and 0.25 in Aug’09.
All of this is having a direct impact on the profit per unit, which has been as high as 0.07 and
0.08 per unit during Aug’09 to Nov’09 whereas at times, it has been zero (Feb’10), or even
negative (Mar’10). All this is causing an inconsistency in the profit and cost mapping and is thus
leading to inefficient budgeting and forecasting analysis (Heminway, 2017). All it has a direct
impact on the lowering of the profit.
2. With respect to the sales, the same is 8.7% below the target sales and the main reason for the
same is the quantitative decrease in the months of Feb’10 to June’10. IT needs to be checked
what is the reason for the decrease in sales as to whether if it is below than target sales or the
competitive pressure or the decrease in selling price (Goldmann, 2016).
3. There are few expenses, which should be in line with the sales and are variable in nature, like
those of advertising and marketing but instead the same has increased. It needs to be examined
as to why the same was increased (Jefferson, 2017).
4. Some expenses like those of bad debts and the repair and maintenance – office equipment has
ended up on an exceptionally higher side as compared to budget. Therefore, it needs to be
checked if the budgeting was not properly made or the expenses have been higher due to low
internal control and inefficiency in managing the receivables and the fixed assets (Das, 2017).
5. There was higher savings in terms of the factory rental, filing fees (fines) and computer
expenses, therefore, it needs to be checked if the company has become efficient in operations
or the accounting has been done incorrectly (Timothy, 2004).
Question 7
Some of the recommendations for the company has been shown below:
1. Budget Modifications: The company can improve the budget forecasting in terms of quantity to
be sold as well as the total profit as in the current year, the quantitative sales and the
profitability per has been linear. In the forthcoming year, the company can make more accurate
forecasts considering the seasonality of the sales, the pricing changes during the year and the
market conditions and competitiveness (Dichev, 2017).
2. Business Priority areas for the upcoming 3 months: The business should be focusing of reducing
some of the key costs like those of bad debts, the advertising and marketing expenses, the
repair and maintenance expenses, personnel costs, telephone expenses and other sundry
expenses. In addition, improvement in the processes and the internal control of the company is
warranted.
9 | P a g e
Paraphrase This Document
Need a fresh take? Get an instant paraphrase of this document with our AI Paraphraser
10
3. Opportunities to improve performance: The Company needs to focus on entering into the new
markets and increasing the bottom-line as well as the top line. This is help the company in
growing and improving the margins. It should also be focusing on decreasing the major variable
costs, which can help the company in increasing the net profits (Calvasina & Calvasina, 2017).
References
Alexander, F. (2016). The Changing Face of Accountability. The Journal of Higher Education, 71(4), 411-
431.
Arnott, D., Lizama, F., & Song, Y. (2017). Patterns of business intelligence systems use in organizations.
Decision Support Systems, 97, 58-68.
Belton, P. (2017). Competitive Strategy: Creating and Sustaining Superior Performance. London: Macat
International ltd.
Calvasina, R. V., & Calvasina, E. J. (2017). Standard Costing Games that Managers Play. Journal of
Management Accounting Research, 12(2), 33-65.
Choy, Y. K. (2018). Cost-benefit Analysis, Values, Wellbeing and Ethics: An Indigenous Worldview
Analysis. Ecological Economics, 145. Retrieved from
https://doi.org/10.1016/j.ecolecon.2017.08.005
Das, P. (2017). Financing Pattern and Utilization of Fixed Assets - A Study. Asian Journal of Social Science
Studies, 2(2), 10-17.
Dichev, I. (2017). On the conceptual foundations of financial reporting. Accounting and Business
Research, 47(6), 617-632. doi:https://doi.org/10.1080/00014788.2017.1299620
Goldmann, K. (2016). Financial Liquidity and Profitability Management in Practice of Polish Business.
Financial Environment and Business Development, 4(3), 103-112.
Heminway, J. (2017). Shareholder Wealth Maximization as a Function of Statutes, Decisional Law, and
Organic Documents. SSRN, 1-35.
Jefferson, M. (2017). Energy, Complexity and Wealth Maximization, R. Ayres. Springer, Switzerland .
Technological Forecasting and Social Change, 353-354.
Mun, K. a. (2018). A close look at the role of regulatory fit in consumers’ responses to unethical firms.
Timothy, G. (2004, November). Managing interest rate risk in a rising rate environment. RMA Journal,
Risk Management Association (RMA).
10 | P a g e

11
11 | P a g e
11 | P a g e
⊘ This is a preview!⊘
Do you want full access?
Subscribe today to unlock all pages.
Trusted by 1+ million students worldwide
1 out of 12
Related Documents


Your All-in-One AI-Powered Toolkit for Academic Success.
+13062052269
info@desklib.com
Available 24*7 on WhatsApp / Email
![[object Object]](/_next/static/media/star-bottom.7253800d.svg)
Unlock your academic potential
Copyright © 2020–2026 A2Z Services. All Rights Reserved. Developed and managed by ZUCOL.