Accounting for Business: Financial Statement, BEP & Ratio Analysis

Verified

Added on  2023/06/04

|9
|907
|95
Homework Assignment
AI Summary
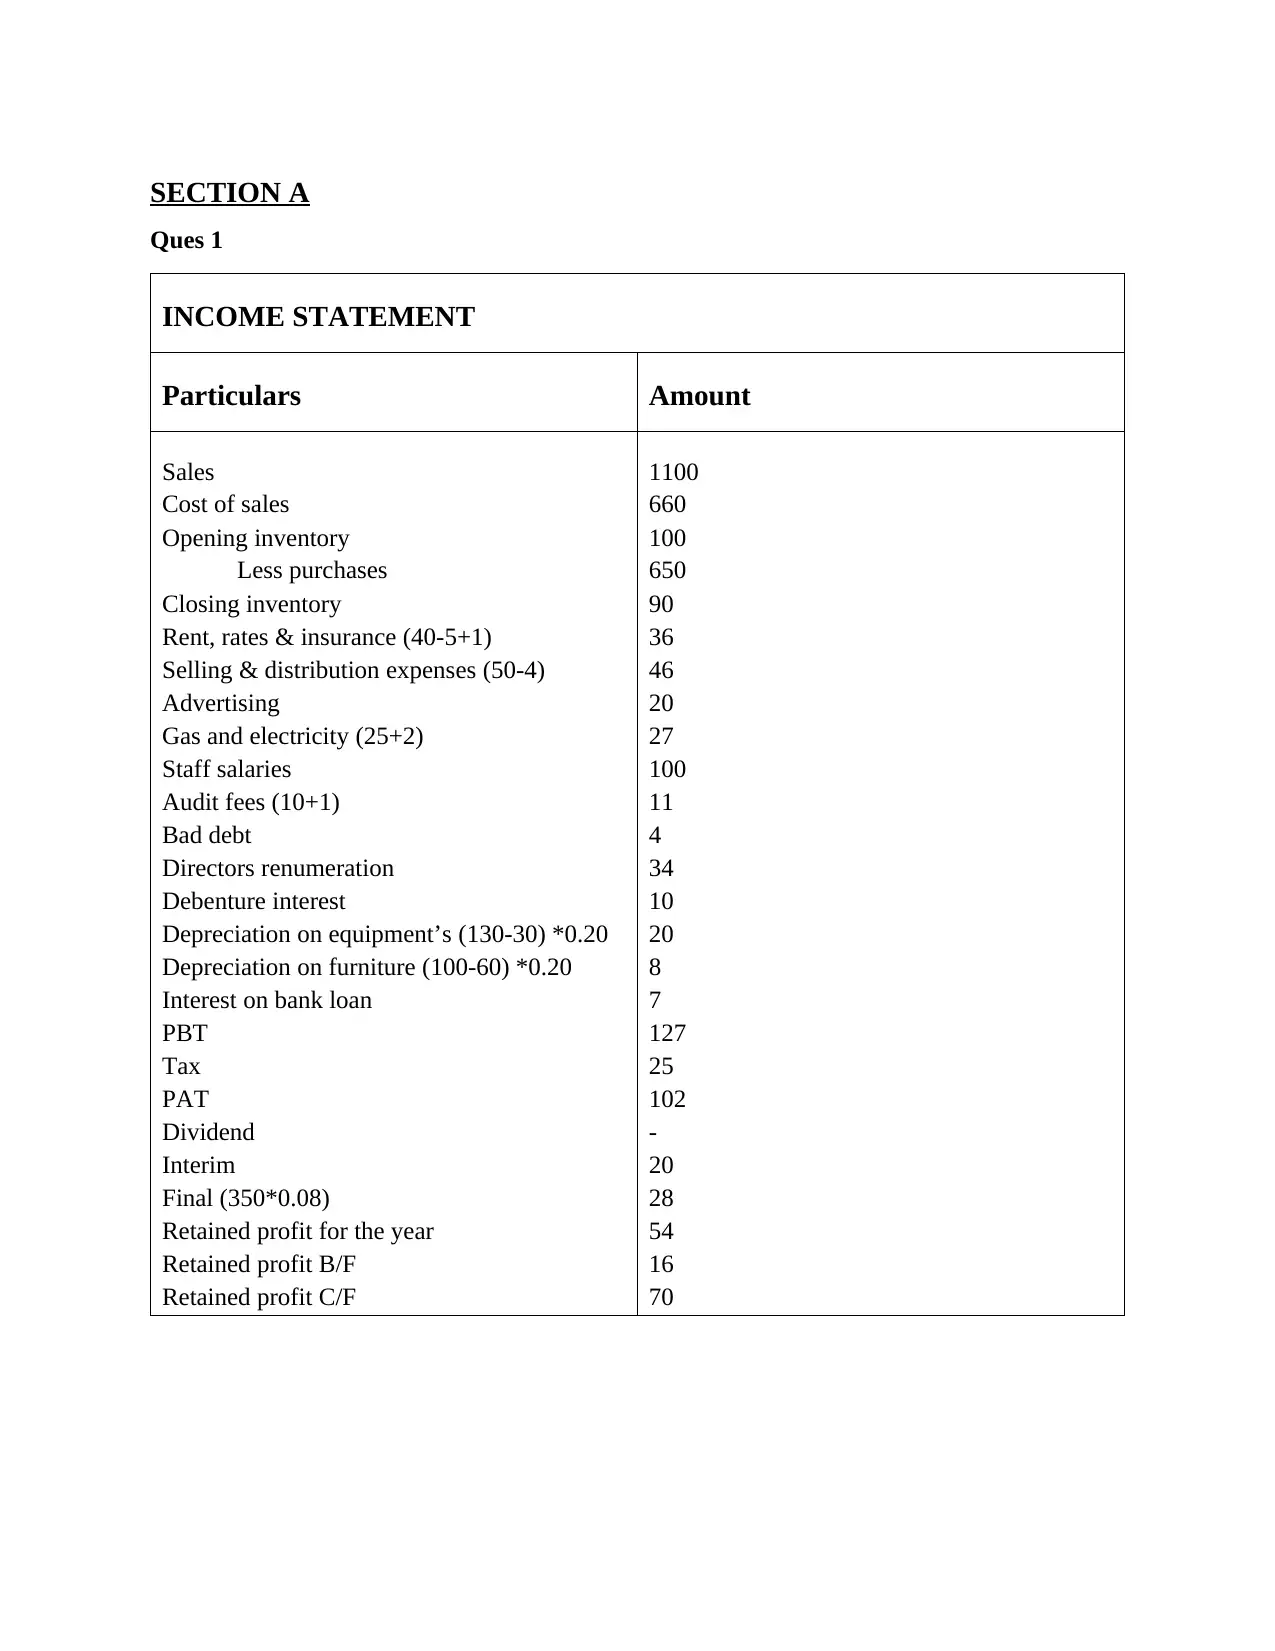
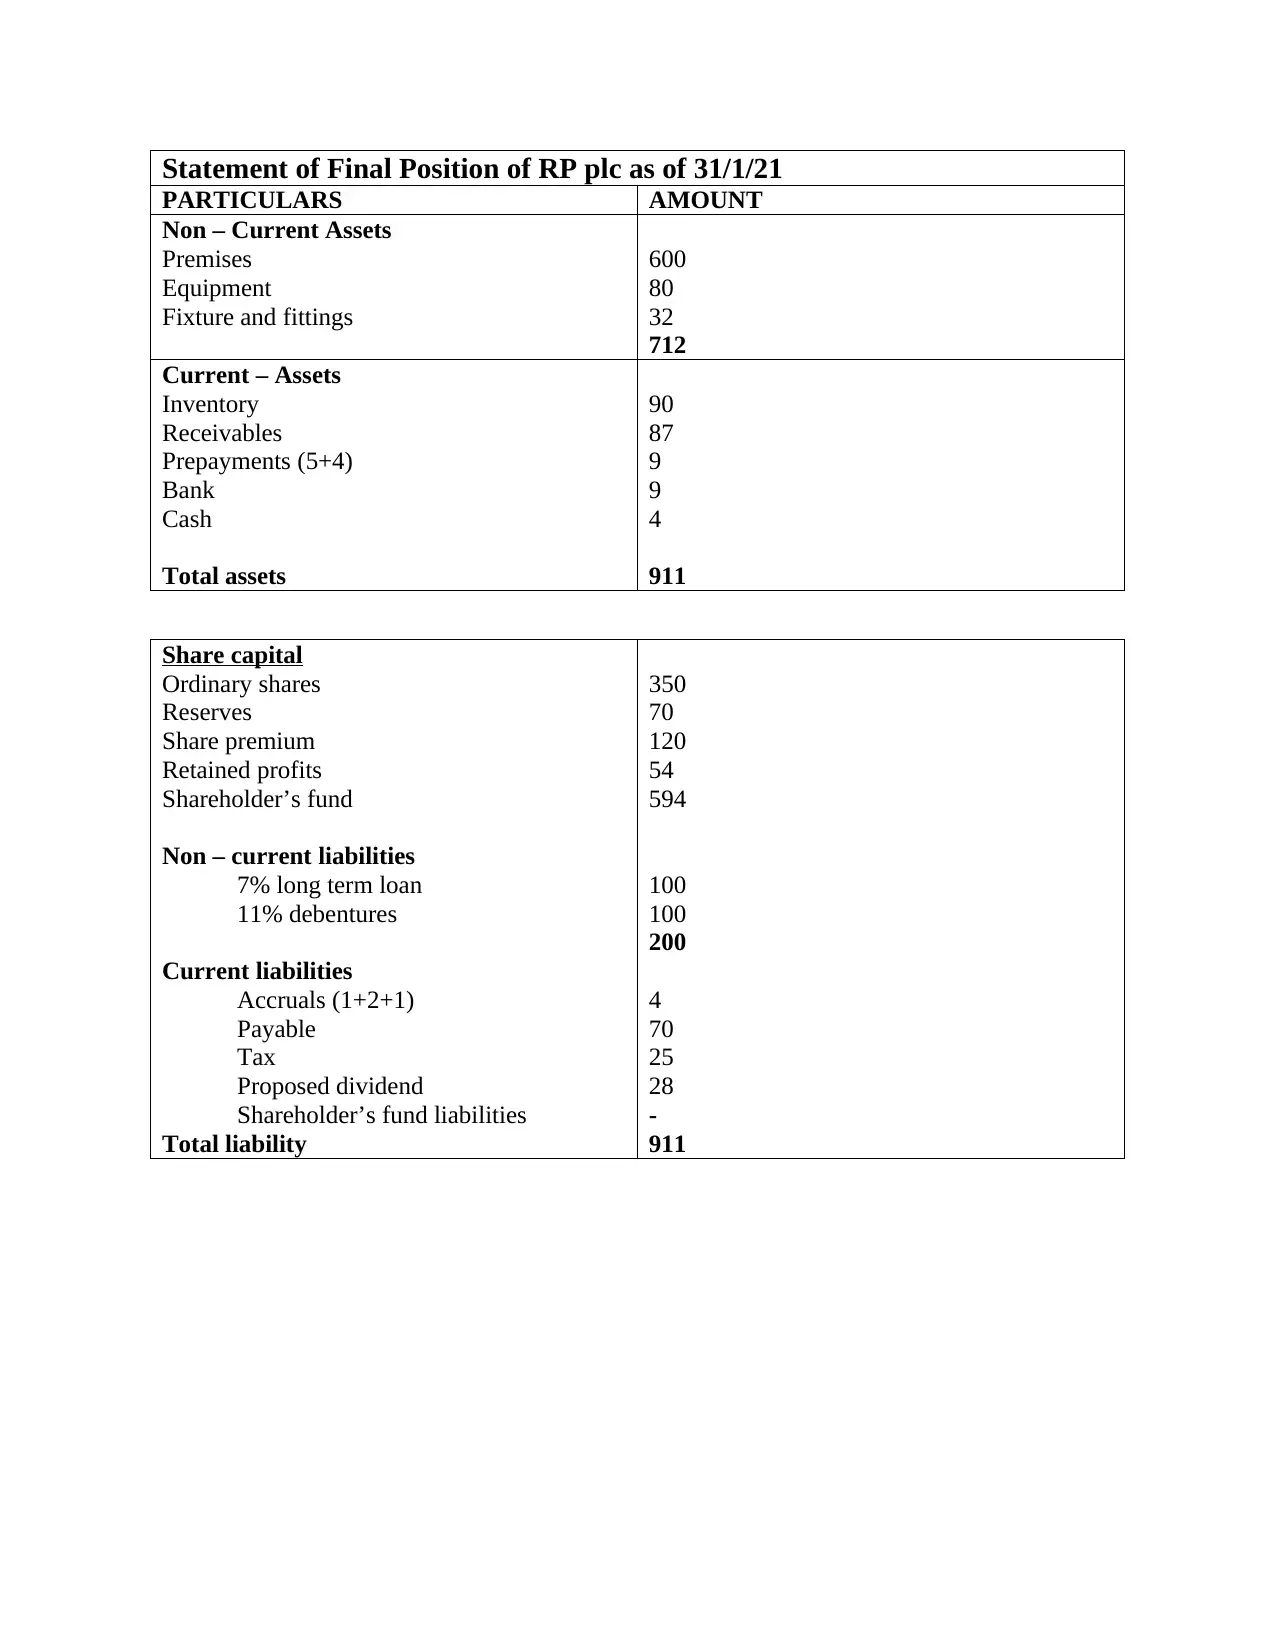
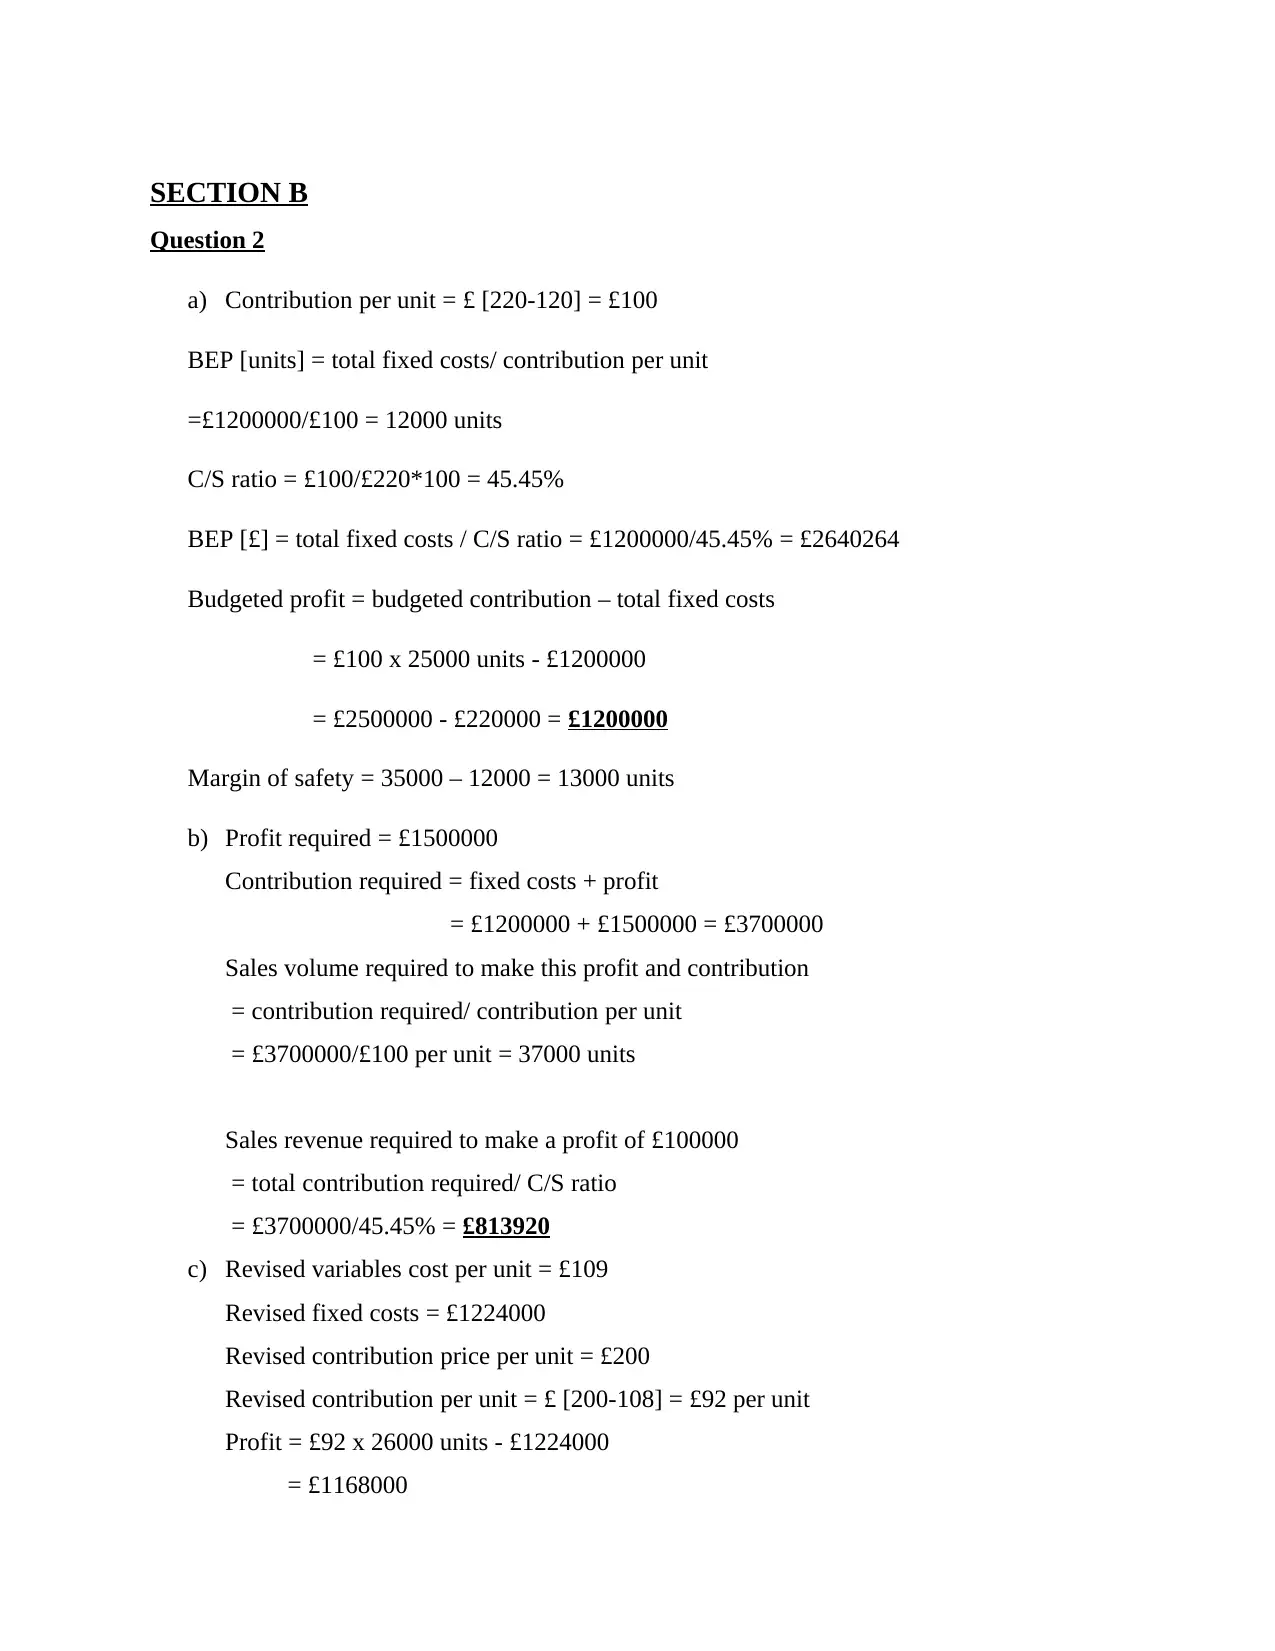
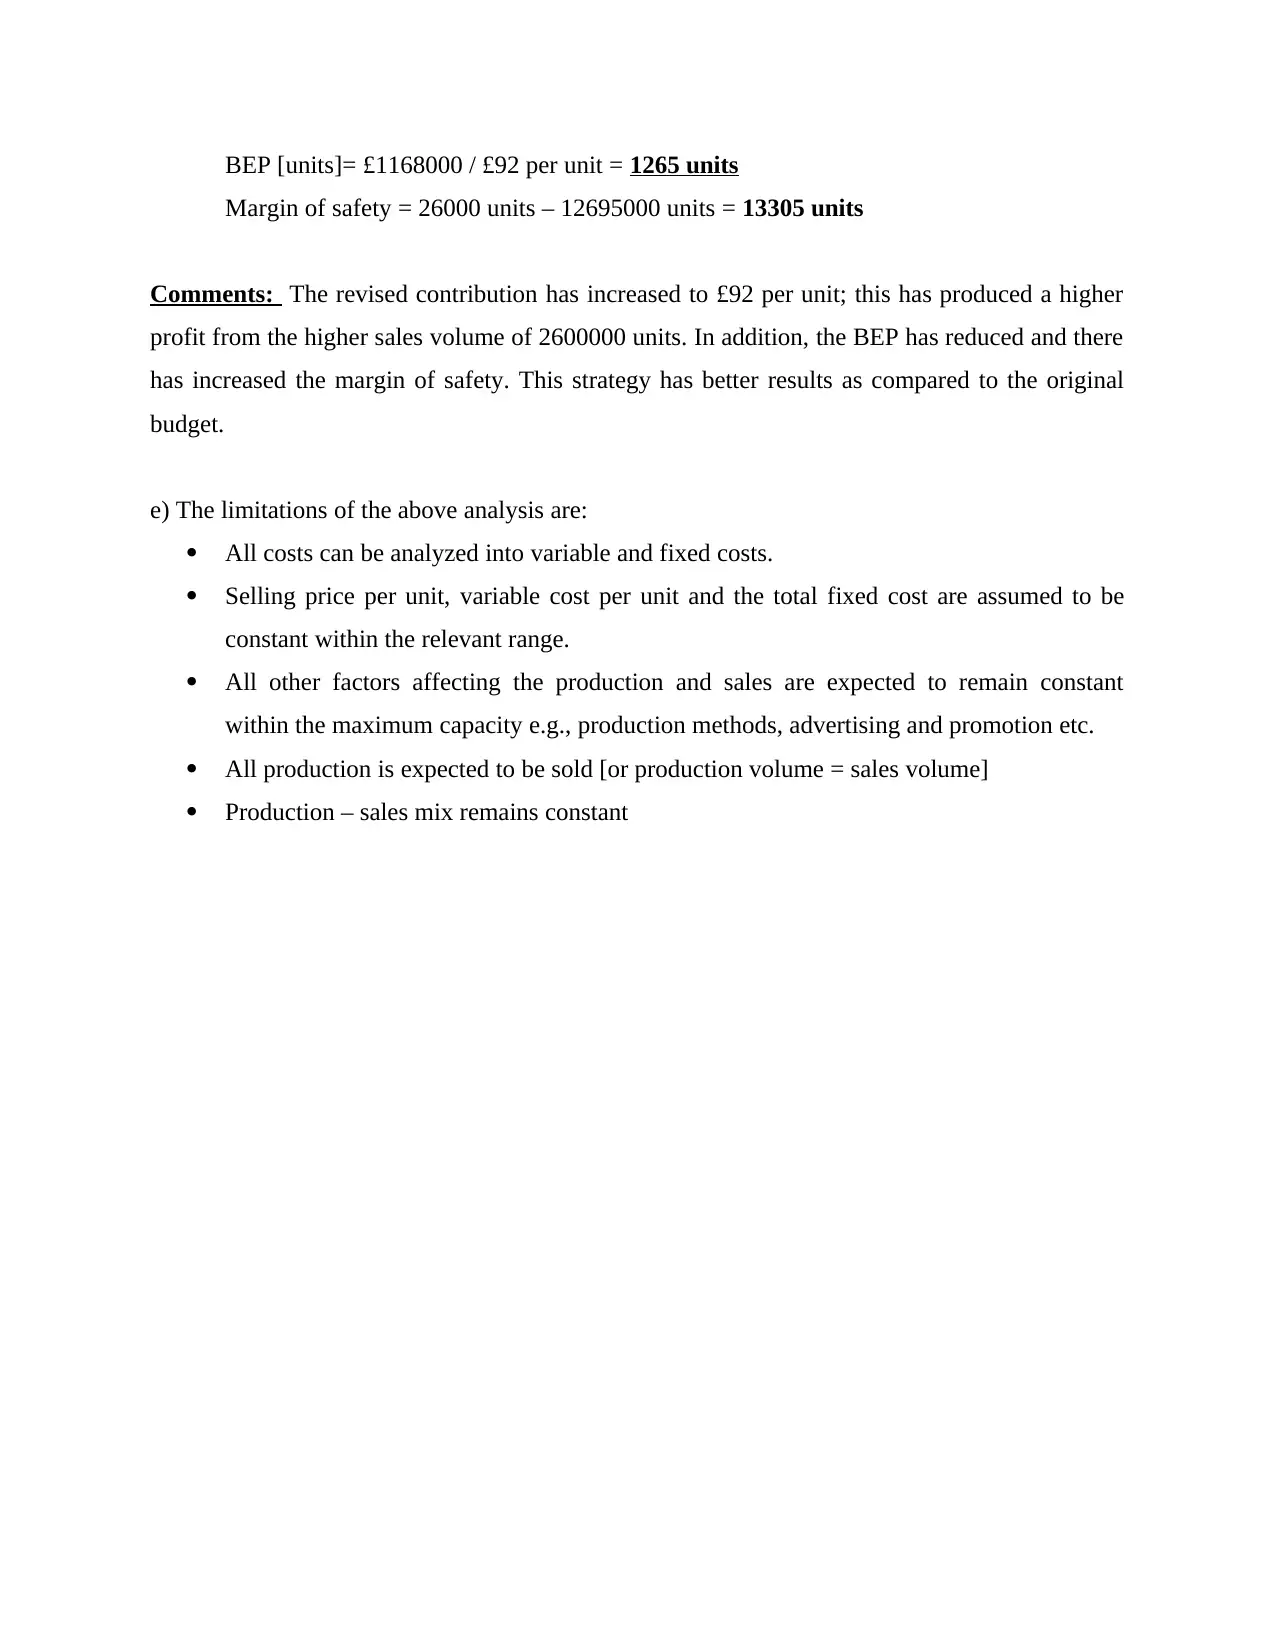
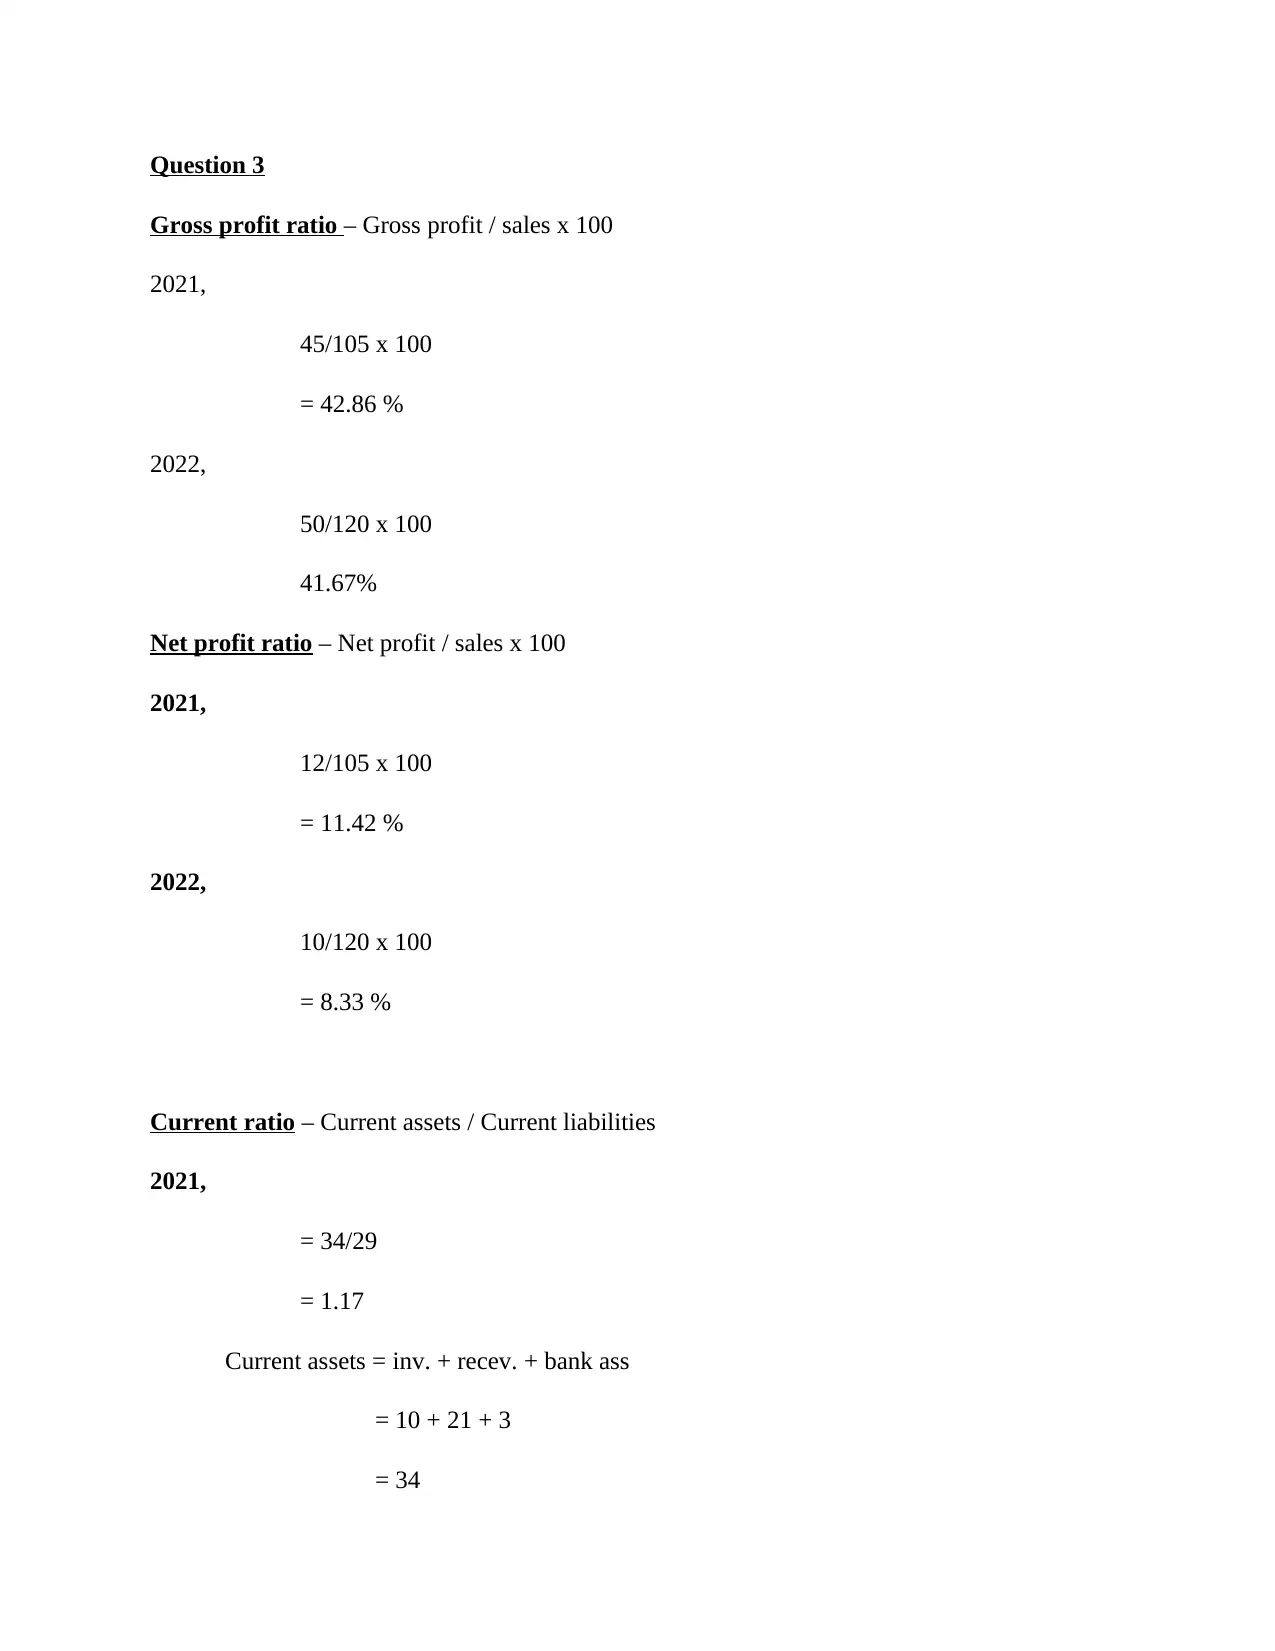
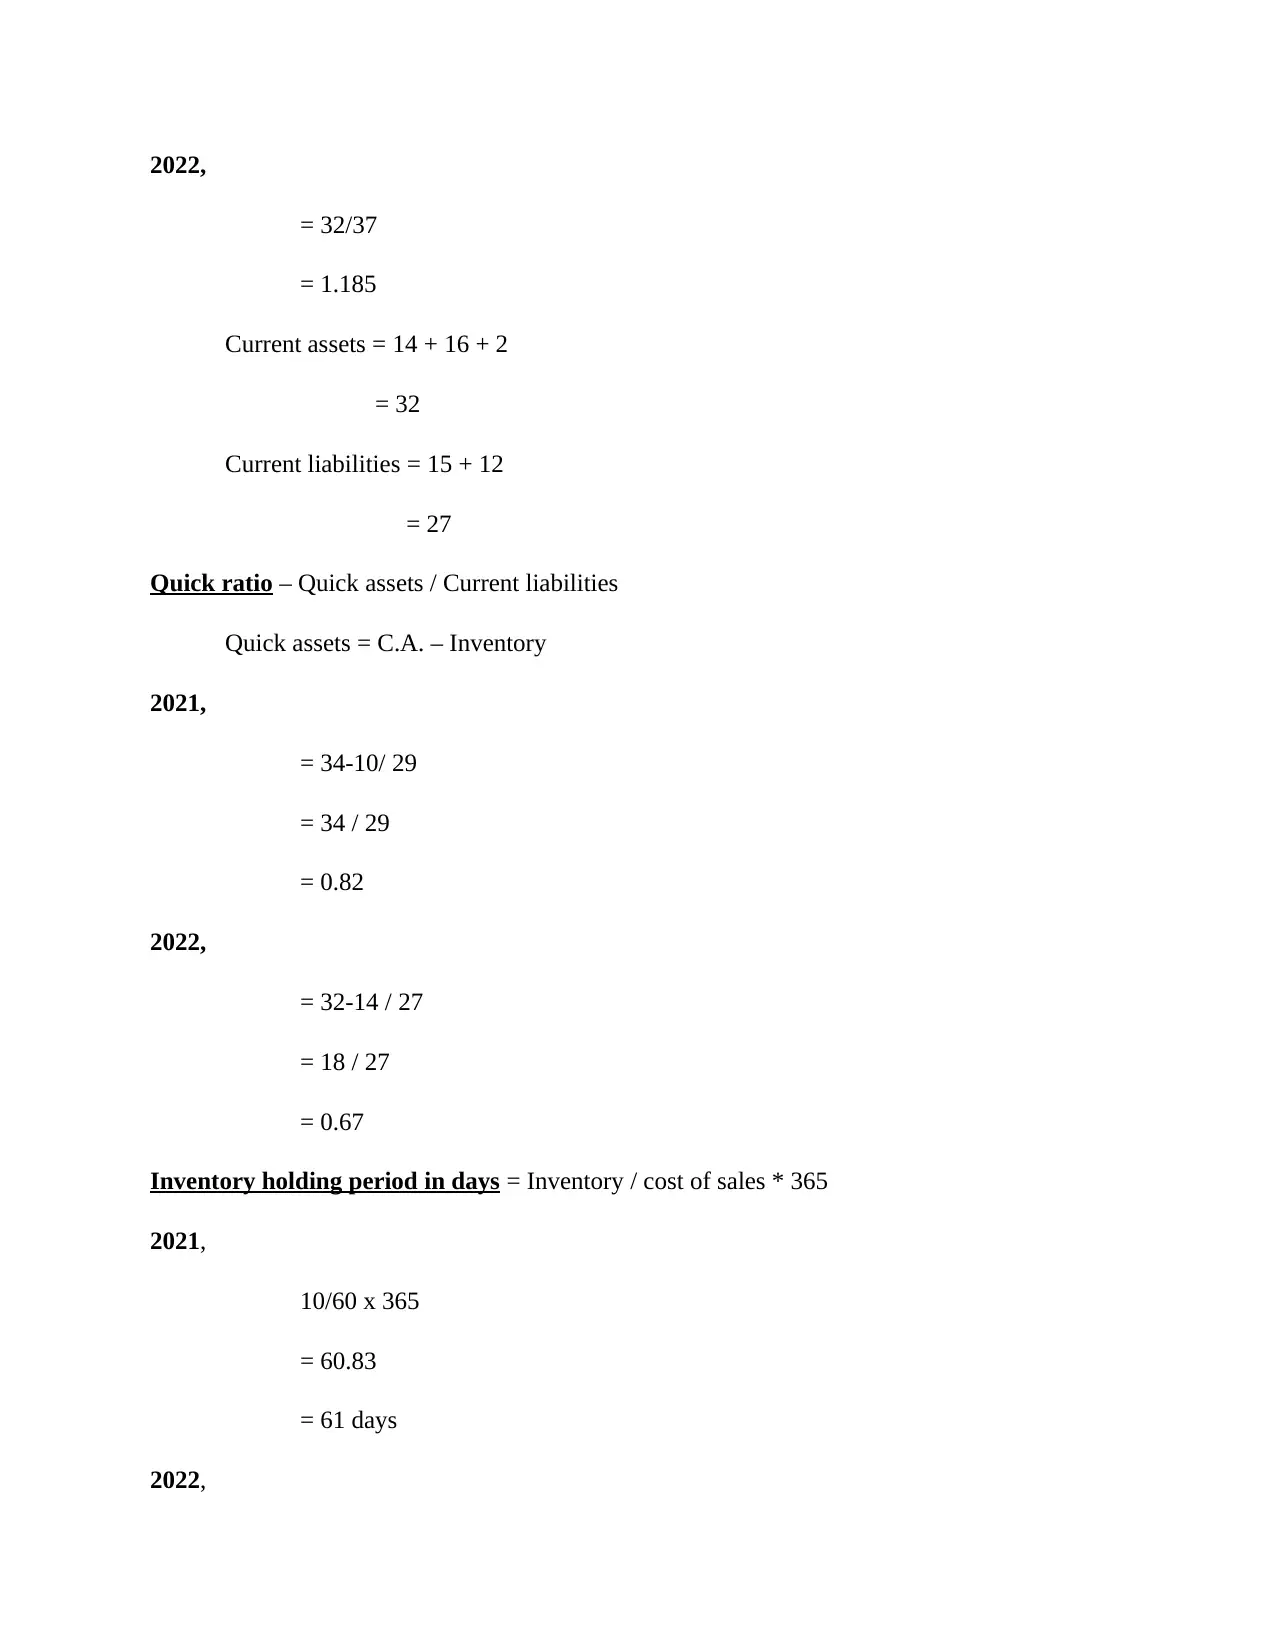
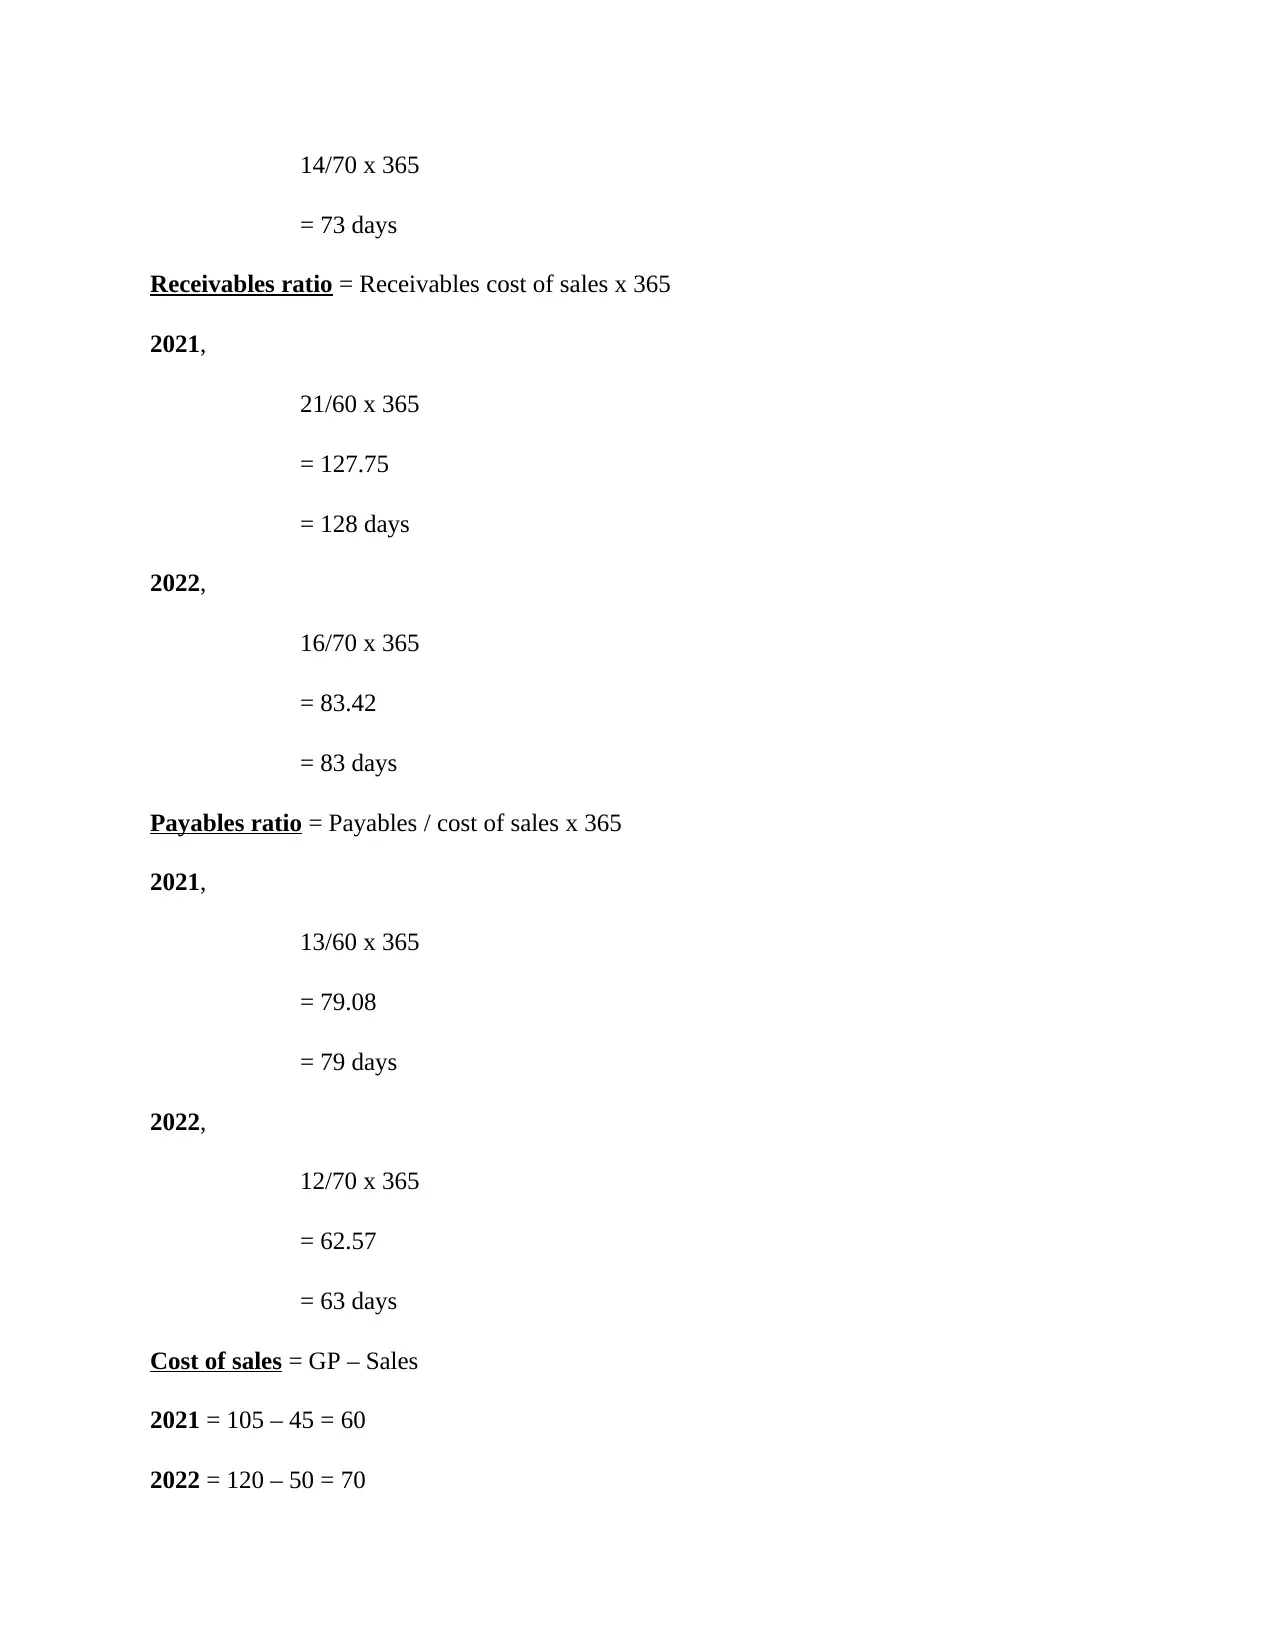
This assignment solution covers key aspects of accounting for business, including the preparation and analysis of financial statements, break-even point (BEP) calculations, and ratio analysis. The income statement provides a detailed breakdown of revenues, expenses, and profit, while the statement of financial position presents a snapshot of assets, liabilities, and equity. The BEP analysis calculates the sales volume required to cover fixed costs, and the impact of revised cost structures on profitability. Ratio analysis assesses the company's profitability, liquidity, and efficiency, highlighting areas of strength and weakness. The analysis provides insights into the company's financial performance and position, aiding in decision-making and strategic planning. Desklib provides a platform for students to access such solved assignments and past papers for effective learning and academic support.
tabler-icon-diamond-filled.svg

Contribute Materials

Your contribution can guide someone’s learning journey. Share your documents today.
Document Page
Accounting for
Business
tabler-icon-diamond-filled.svg

Secure Best Marks with AI Grader

Need help grading? Try our AI Grader for instant feedback on your assignments.
Document Page
SECTION A
Ques 1
INCOME STATEMENT
Particulars Amount
Sales
Cost of sales
Opening inventory
Less purchases
Closing inventory
Rent, rates & insurance (40-5+1)
Selling & distribution expenses (50-4)
Advertising
Gas and electricity (25+2)
Staff salaries
Audit fees (10+1)
Bad debt
Directors renumeration
Debenture interest
Depreciation on equipment’s (130-30) *0.20
Depreciation on furniture (100-60) *0.20
Interest on bank loan
PBT
Tax
PAT
Dividend
Interim
Final (350*0.08)
Retained profit for the year
Retained profit B/F
Retained profit C/F
1100
660
100
650
90
36
46
20
27
100
11
4
34
10
20
8
7
127
25
102
-
20
28
54
16
70
Document Page
Statement of Final Position of RP plc as of 31/1/21
PARTICULARS AMOUNT
Non – Current Assets
Premises
Equipment
Fixture and fittings
600
80
32
712
Current – Assets
Inventory
Receivables
Prepayments (5+4)
Bank
Cash
Total assets
90
87
9
9
4
911
Share capital
Ordinary shares
Reserves
Share premium
Retained profits
Shareholder’s fund
Non – current liabilities
7% long term loan
11% debentures
Current liabilities
Accruals (1+2+1)
Payable
Tax
Proposed dividend
Shareholder’s fund liabilities
Total liability
350
70
120
54
594
100
100
200
4
70
25
28
-
911
Document Page
SECTION B
Question 2
a) Contribution per unit = £ [220-120] = £100
BEP [units] = total fixed costs/ contribution per unit
=£1200000/£100 = 12000 units
C/S ratio = £100/£220*100 = 45.45%
BEP [£] = total fixed costs / C/S ratio = £1200000/45.45% = £2640264
Budgeted profit = budgeted contribution – total fixed costs
= £100 x 25000 units - £1200000
= £2500000 - £220000 = £1200000
Margin of safety = 35000 – 12000 = 13000 units
b) Profit required = £1500000
Contribution required = fixed costs + profit
= £1200000 + £1500000 = £3700000
Sales volume required to make this profit and contribution
= contribution required/ contribution per unit
= £3700000/£100 per unit = 37000 units
Sales revenue required to make a profit of £100000
= total contribution required/ C/S ratio
= £3700000/45.45% = £813920
c) Revised variables cost per unit = £109
Revised fixed costs = £1224000
Revised contribution price per unit = £200
Revised contribution per unit = £ [200-108] = £92 per unit
Profit = £92 x 26000 units - £1224000
= £1168000
tabler-icon-diamond-filled.svg

Secure Best Marks with AI Grader

Need help grading? Try our AI Grader for instant feedback on your assignments.
Document Page
BEP [units]= £1168000 / £92 per unit = 1265 units
Margin of safety = 26000 units – 12695000 units = 13305 units
Comments: The revised contribution has increased to £92 per unit; this has produced a higher
profit from the higher sales volume of 2600000 units. In addition, the BEP has reduced and there
has increased the margin of safety. This strategy has better results as compared to the original
budget.
e) The limitations of the above analysis are:
All costs can be analyzed into variable and fixed costs.
Selling price per unit, variable cost per unit and the total fixed cost are assumed to be
constant within the relevant range.
All other factors affecting the production and sales are expected to remain constant
within the maximum capacity e.g., production methods, advertising and promotion etc.
All production is expected to be sold [or production volume = sales volume]
Production – sales mix remains constant
Document Page
Question 3
Gross profit ratio – Gross profit / sales x 100
2021,
45/105 x 100
= 42.86 %
2022,
50/120 x 100
41.67%
Net profit ratio – Net profit / sales x 100
2021,
12/105 x 100
= 11.42 %
2022,
10/120 x 100
= 8.33 %
Current ratio – Current assets / Current liabilities
2021,
= 34/29
= 1.17
Current assets = inv. + recev. + bank ass
= 10 + 21 + 3
= 34
Document Page
2022,
= 32/37
= 1.185
Current assets = 14 + 16 + 2
= 32
Current liabilities = 15 + 12
= 27
Quick ratio – Quick assets / Current liabilities
Quick assets = C.A. – Inventory
2021,
= 34-10/ 29
= 34 / 29
= 0.82
2022,
= 32-14 / 27
= 18 / 27
= 0.67
Inventory holding period in days = Inventory / cost of sales * 365
2021,
10/60 x 365
= 60.83
= 61 days
2022,
tabler-icon-diamond-filled.svg

Paraphrase This Document

Need a fresh take? Get an instant paraphrase of this document with our AI Paraphraser
Document Page
14/70 x 365
= 73 days
Receivables ratio = Receivables cost of sales x 365
2021,
21/60 x 365
= 127.75
= 128 days
2022,
16/70 x 365
= 83.42
= 83 days
Payables ratio = Payables / cost of sales x 365
2021,
13/60 x 365
= 79.08
= 79 days
2022,
12/70 x 365
= 62.57
= 63 days
Cost of sales = GP – Sales
2021 = 105 – 45 = 60
2022 = 120 – 50 = 70
Document Page
Thus, it is not in ideal position to pay its short-term liabilities because its current ratio is
less than 2 for both the years. Ideally the current ratio must be 2 times higher than the current
liabilities. Debtors and payables ration has also been increased in the year 2022.
chevron_up_icon
1 out of 9
circle_padding
hide_on_mobile
zoom_out_icon
logo.png

Your All-in-One AI-Powered Toolkit for Academic Success.

Available 24*7 on WhatsApp / Email

[object Object]