Accounting for Business: Financial Ratio Analysis and Solutions
VerifiedAdded on 2023/06/04
|9
|890
|66
Homework Assignment
AI Summary
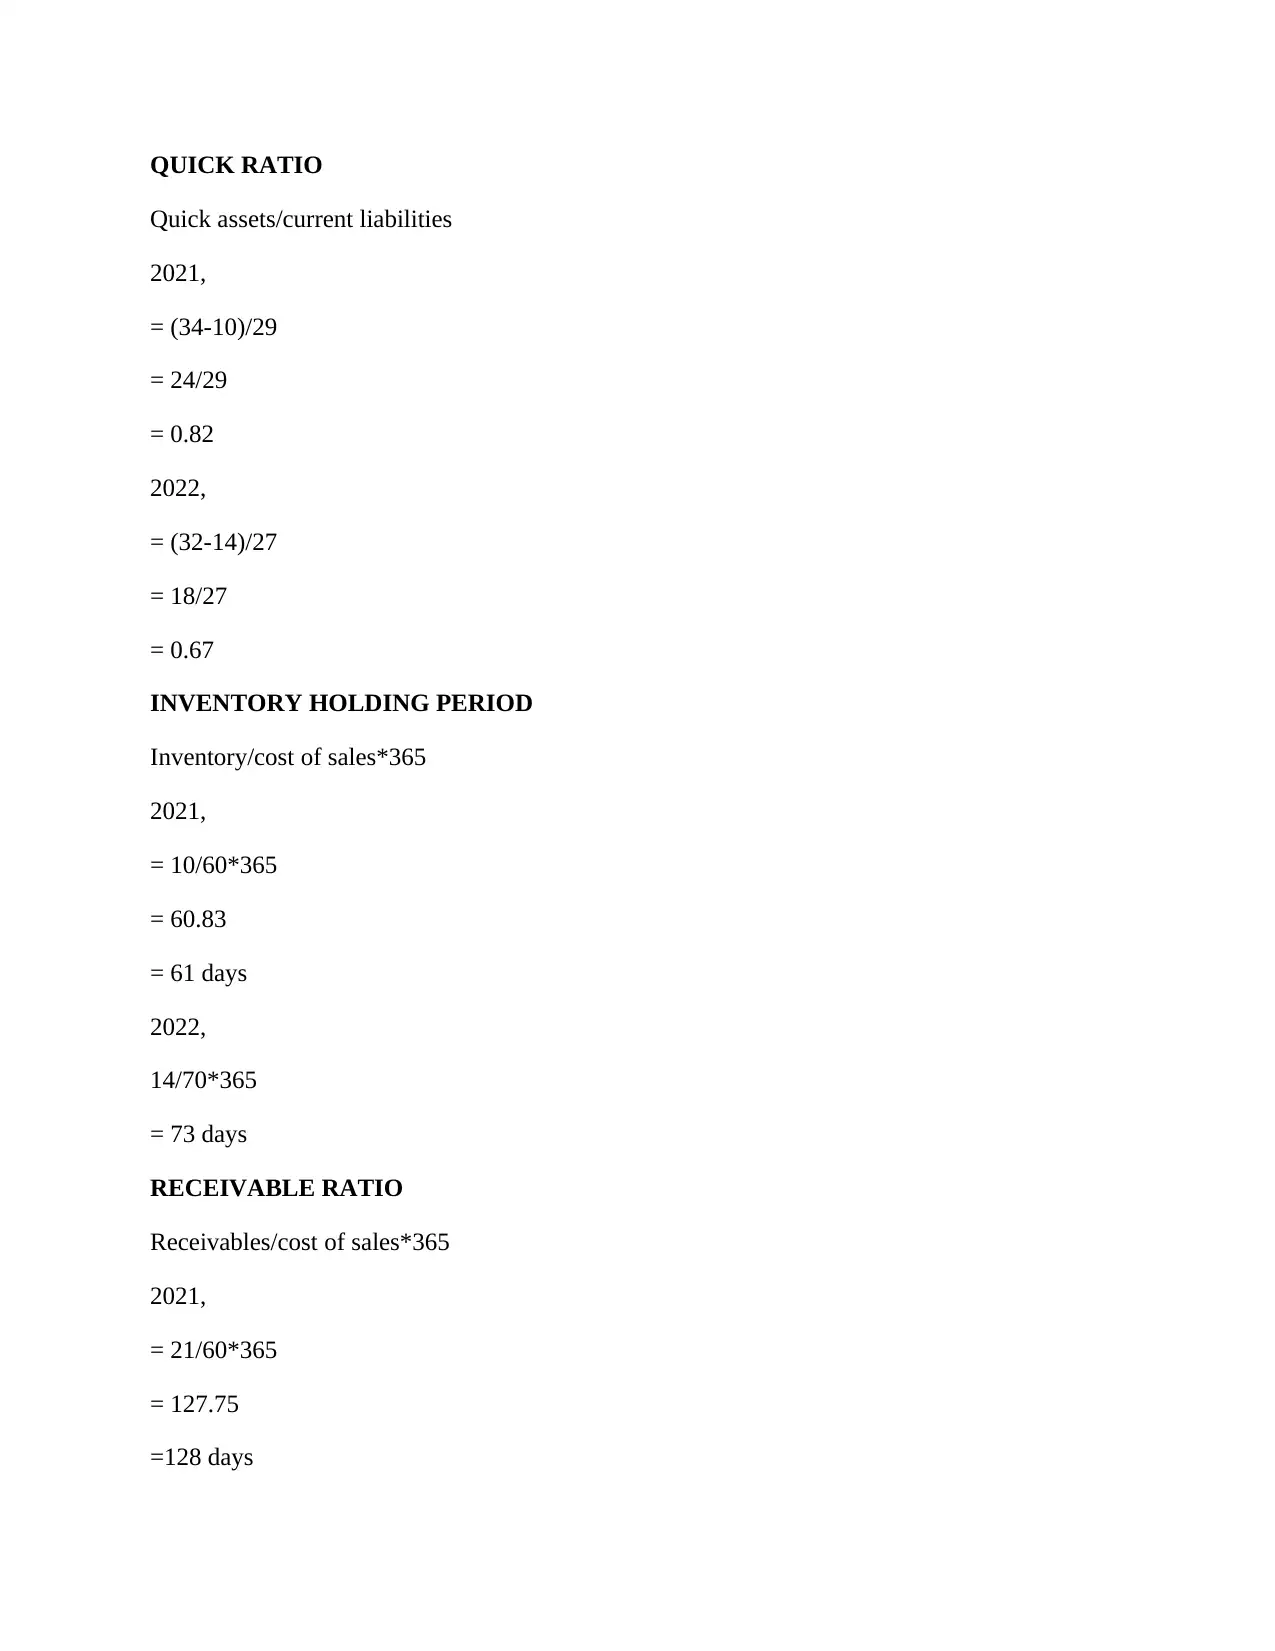
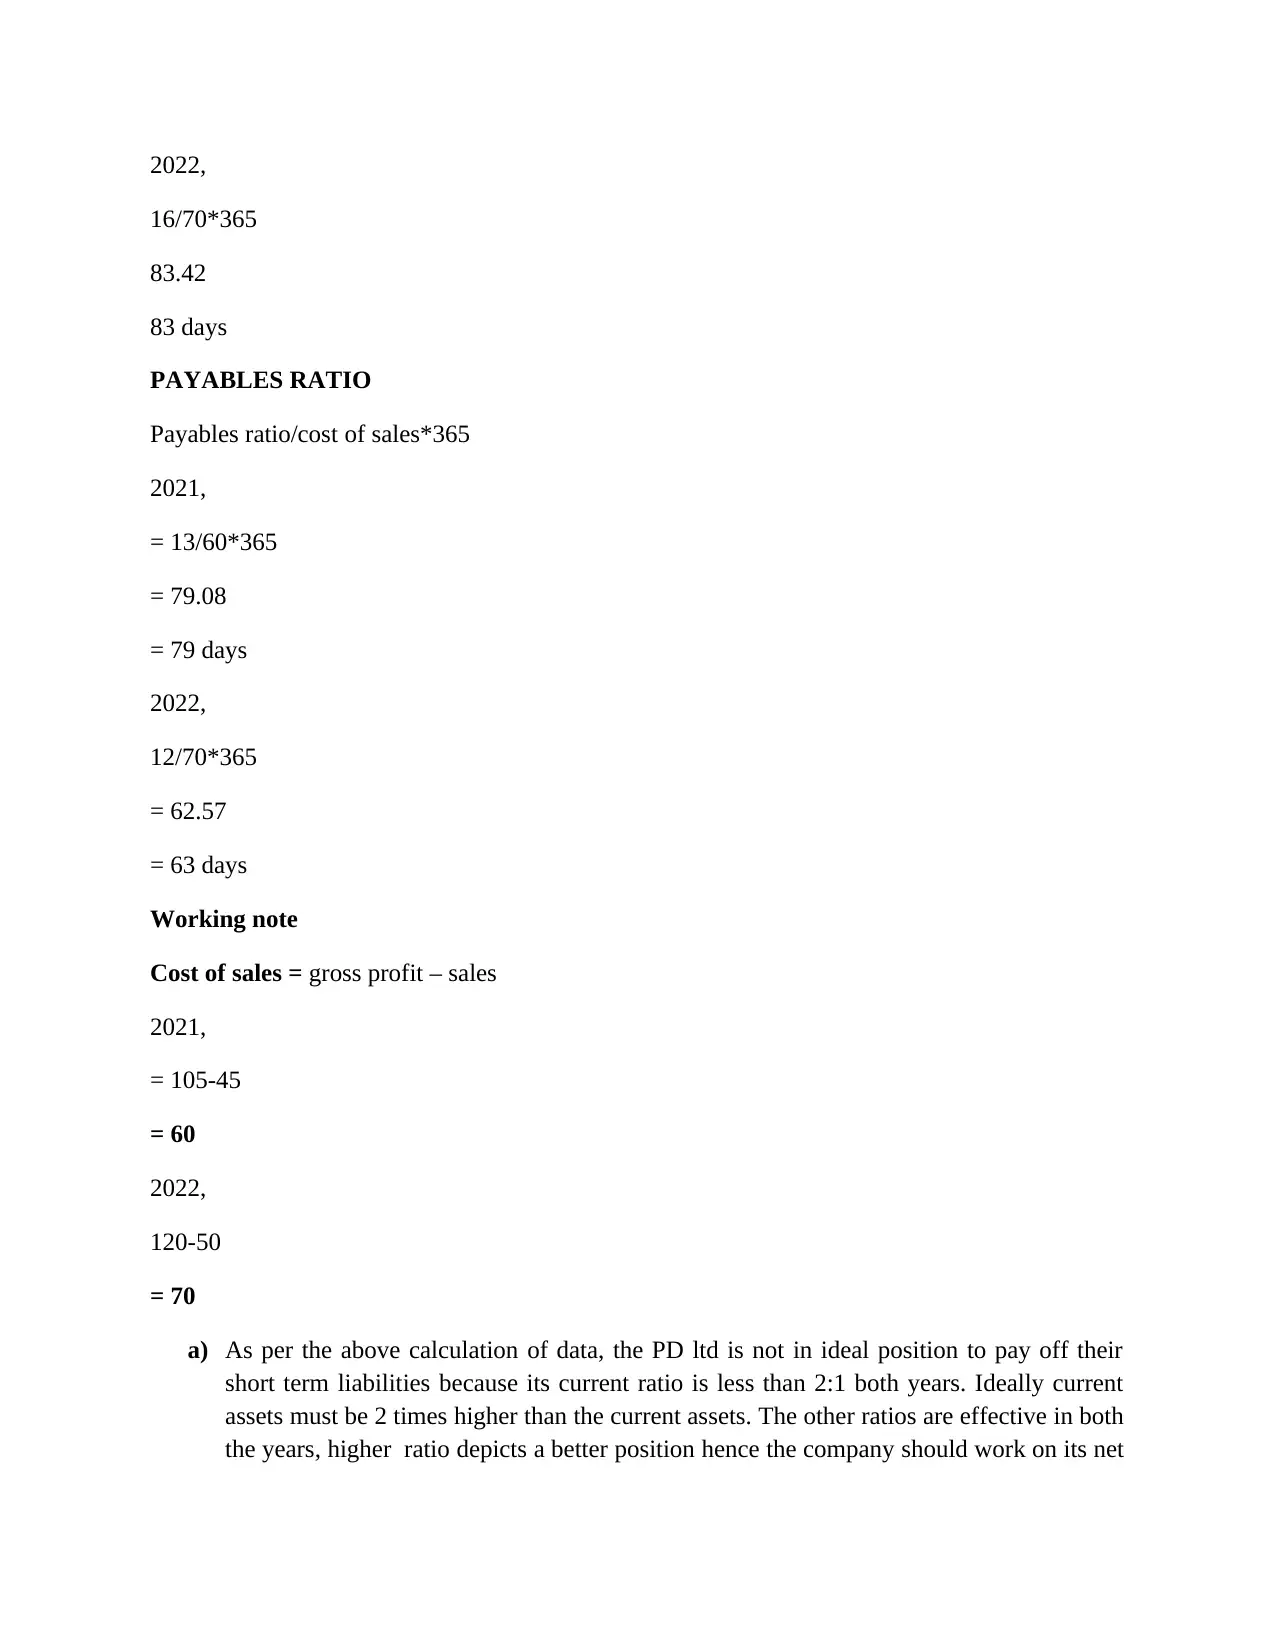
This document presents a comprehensive solution to an accounting assignment, focusing on financial analysis and break-even analysis. The assignment delves into calculating and interpreting various financial ratios, including gross profit ratio, net profit ratio, current ratio, quick ratio, inventory holding period, receivables ratio, and payables ratio. It also includes detailed calculations for break-even points, cost-volume-profit analysis, and margin of safety. The solution provides a step-by-step breakdown of the calculations and interpretations, offering insights into a company's financial performance and position. The document also includes an analysis of the limitations of the models used and provides a list of references. This assignment is a valuable resource for students studying business accounting, offering a clear understanding of key financial concepts and their practical application.

Accounting for business
Paraphrase This Document
Need a fresh take? Get an instant paraphrase of this document with our AI Paraphraser

Table of Contents
Accounting for business...................................................................................................................1
Question 2........................................................................................................................................3
Question 3........................................................................................................................................5
Gross profit ratio:.............................................................................................................................5
References......................................................................................................................................10

Question 2
a) Contribution per unit = £ [220 – 120] = £100
BEP [units] = Total fixed costs / Contribution per unit
= £1200000 / £100 = 12,000 units
C/S ratio = £100 / £220*100 = 45.45%
BEP [£] = Total fixed costs / C/S ratio = £1200,000 / 45.45% = £2640264
Budgeted profit = Budgeted contribution – Total fixed costs
= £100 x 25,000 units - £12,00, 000
= £25,00,000 - £220,000 = £1200,000
Margin of safety = 35,000 – 12,000 = 13,000 units
b) Profit required = £1500,000
Contribution required = Fixed costs + profit
= £1200,000 + £1500,000 = £2700,000
Sales volume required to make this profit and contribution
= Contribution required / Contribution per unit
= £2700,000 / £100 per unit = 27,000 units
Sales revenue required to make a profit of £100,000
= Total contribution required / C/S ratio
= £2700,000 / 45.45% = £1227150
⊘ This is a preview!⊘
Do you want full access?
Subscribe today to unlock all pages.

Trusted by 1+ million students worldwide

c)
Revised variable costs per unit = £109
Revised fixed costs = £1224000
Revised selling price per unit = £200
Revised contribution per unit = £ [200 – 108] = £92 per unit
Profit = £92 x 26,000 units - £1224,000
= £1168000
BEP [units] = £1168000 / £92 per unit = 12695 units
Margin of safety = 26,000 units – 12695,000 units = 13,305units
Comments: The revised contribution has increased to £92 per unit; this has produced a higher
profit from the higher sales volume of 2600,000 units. In addition, the BEP has reduced and
there has increased the margin of safety. This strategy has better results compared to the original
budget.
e)
The limitations of the above analysis are:
• All costs can be analysed into variable and fixed costs.
• Selling price per unit, variable cost per unit and the total fixed costs are assumed to
constant within the relevant range [ i.e. the maximum capacity]
• All other factors affecting the production and sales are expected to remain constant
within the maximum capacity e.g. production methods, advertising and promotion etc
• All production is expected to be sold [or production volume = sales volume]
• production - sales mix remains constant.
Paraphrase This Document
Need a fresh take? Get an instant paraphrase of this document with our AI Paraphraser

Question 3
Gross profit ratio:
Gross profit/sales*100
2021,
45/105*100
= 42.86%
2022,
50/120*100
= 41.67%
NET PROFIT RATIO:
Net profit/sales*100
2021,
12/105*100
= 11.42%
2022,
10/120*100
= 8.33%
CURRENT RATIO
Current assets/current liabilities
2021,
34/29
= 1.17
2022,
32/27
= 1.18
Gross profit ratio:
Gross profit/sales*100
2021,
45/105*100
= 42.86%
2022,
50/120*100
= 41.67%
NET PROFIT RATIO:
Net profit/sales*100
2021,
12/105*100
= 11.42%
2022,
10/120*100
= 8.33%
CURRENT RATIO
Current assets/current liabilities
2021,
34/29
= 1.17
2022,
32/27
= 1.18

QUICK RATIO
Quick assets/current liabilities
2021,
= (34-10)/29
= 24/29
= 0.82
2022,
= (32-14)/27
= 18/27
= 0.67
INVENTORY HOLDING PERIOD
Inventory/cost of sales*365
2021,
= 10/60*365
= 60.83
= 61 days
2022,
14/70*365
= 73 days
RECEIVABLE RATIO
Receivables/cost of sales*365
2021,
= 21/60*365
= 127.75
=128 days
Quick assets/current liabilities
2021,
= (34-10)/29
= 24/29
= 0.82
2022,
= (32-14)/27
= 18/27
= 0.67
INVENTORY HOLDING PERIOD
Inventory/cost of sales*365
2021,
= 10/60*365
= 60.83
= 61 days
2022,
14/70*365
= 73 days
RECEIVABLE RATIO
Receivables/cost of sales*365
2021,
= 21/60*365
= 127.75
=128 days
⊘ This is a preview!⊘
Do you want full access?
Subscribe today to unlock all pages.

Trusted by 1+ million students worldwide

2022,
16/70*365
83.42
83 days
PAYABLES RATIO
Payables ratio/cost of sales*365
2021,
= 13/60*365
= 79.08
= 79 days
2022,
12/70*365
= 62.57
= 63 days
Working note
Cost of sales = gross profit – sales
2021,
= 105-45
= 60
2022,
120-50
= 70
a) As per the above calculation of data, the PD ltd is not in ideal position to pay off their
short term liabilities because its current ratio is less than 2:1 both years. Ideally current
assets must be 2 times higher than the current assets. The other ratios are effective in both
the years, higher ratio depicts a better position hence the company should work on its net
Paraphrase This Document
Need a fresh take? Get an instant paraphrase of this document with our AI Paraphraser

profit that has come down in the year 2022. The company is paying their creditors more
quickly As per the year of 2022 and 2021.

References
Boyd, J. and Pitre, R., 2020. Creating relevance in managerial accounting. Journal of
education for business, 95(5), pp.331-334.
Abhishek, N. and Divyashree, M.S., 2019. Harmonization of Accounting Standards in
India. MUDRA: Journal of Finance and Accounting, 6(1), pp.84-96.
Appelbaum, D. and Nehmer, R.A., 2020. Auditing cloud-based blockchain accounting
systems. Journal of Information Systems, 34(2), pp.5-21.
Grinko and et al., 2020. Development of an adaptive accounting system on the basis of
quality improvement of information resources. Academy of accounting and financial
studies journal, 24(5), pp.1-7.
Silva, A., Jorge, S. and Rodrigues, L.L., 2021. Enforcement and accounting quality in the
context of IFRS: is there a gap in the literature?. International Journal of Accounting &
Information Management, 29(3), pp.345-367.
⊘ This is a preview!⊘
Do you want full access?
Subscribe today to unlock all pages.

Trusted by 1+ million students worldwide
1 out of 9
Related Documents

Your All-in-One AI-Powered Toolkit for Academic Success.
+13062052269
info@desklib.com
Available 24*7 on WhatsApp / Email
Unlock your academic potential
Copyright © 2020–2025 A2Z Services. All Rights Reserved. Developed and managed by ZUCOL.