Business Finance Project: Business Accounts and Ratio Analysis
VerifiedAdded on 2021/02/20
|11
|1950
|47
Project
AI Summary
This business finance project delves into the core concepts of financial accounting and analysis. The project begins with the presentation of transactions through T-accounts and balance sheet T-accounts. It then moves on to the preparation of a Trading Profit and Loss account and a Balance Sheet for Adya Kumar, followed by an in-depth commentary on the financial position. The core of the project involves the analysis and interpretation of business accounts using ratio analysis, comparing the performance of two companies based on key financial metrics like current ratio, acid test ratio, and gearing ratio. The project culminates in a conclusion summarizing the findings and references to supporting materials. This resource, available on Desklib, provides a comprehensive understanding of financial statement analysis and its practical application.

Business Finance project 6
Accounts
Accounts
Paraphrase This Document
Need a fresh take? Get an instant paraphrase of this document with our AI Paraphraser
Table of Contents
INTRODUCTION................................................................................................................................3
MAIN BODY.......................................................................................................................................3
LO 1......................................................................................................................................................3
1.1 & 1.2 Presenting the set of transactions by preparing relevant T- accounts and Balance Sheet
T- accounts.......................................................................................................................................3
LO 2......................................................................................................................................................6
2.1 Preparing a Trading Profit and Loss account, Balance Sheet for Adya Kumar.........................6
2.2 Comments..................................................................................................................................7
LO 3......................................................................................................................................................8
3.1 Analysing and Interpretation of business accounts using ratio analysis between two
companies........................................................................................................................................8
CONCLUSION..................................................................................................................................10
REFERENCES...................................................................................................................................11
INTRODUCTION
Business finance is related with funding of business operations for successful
accomplishment of business goals and objectives. Every project should be assigned financial
resources as per the plan and strategy for minimizing unnecessary cost expenditure and proper
utilization of resources as well. The present report is based on understanding of double entry system
for business. Also, the report will focus on preparation of final accounts for profit making
organisation. Furthermore, the report will streamline about the importance of financial ratio in
analysing the business financial position.
MAIN BODY
LO 1
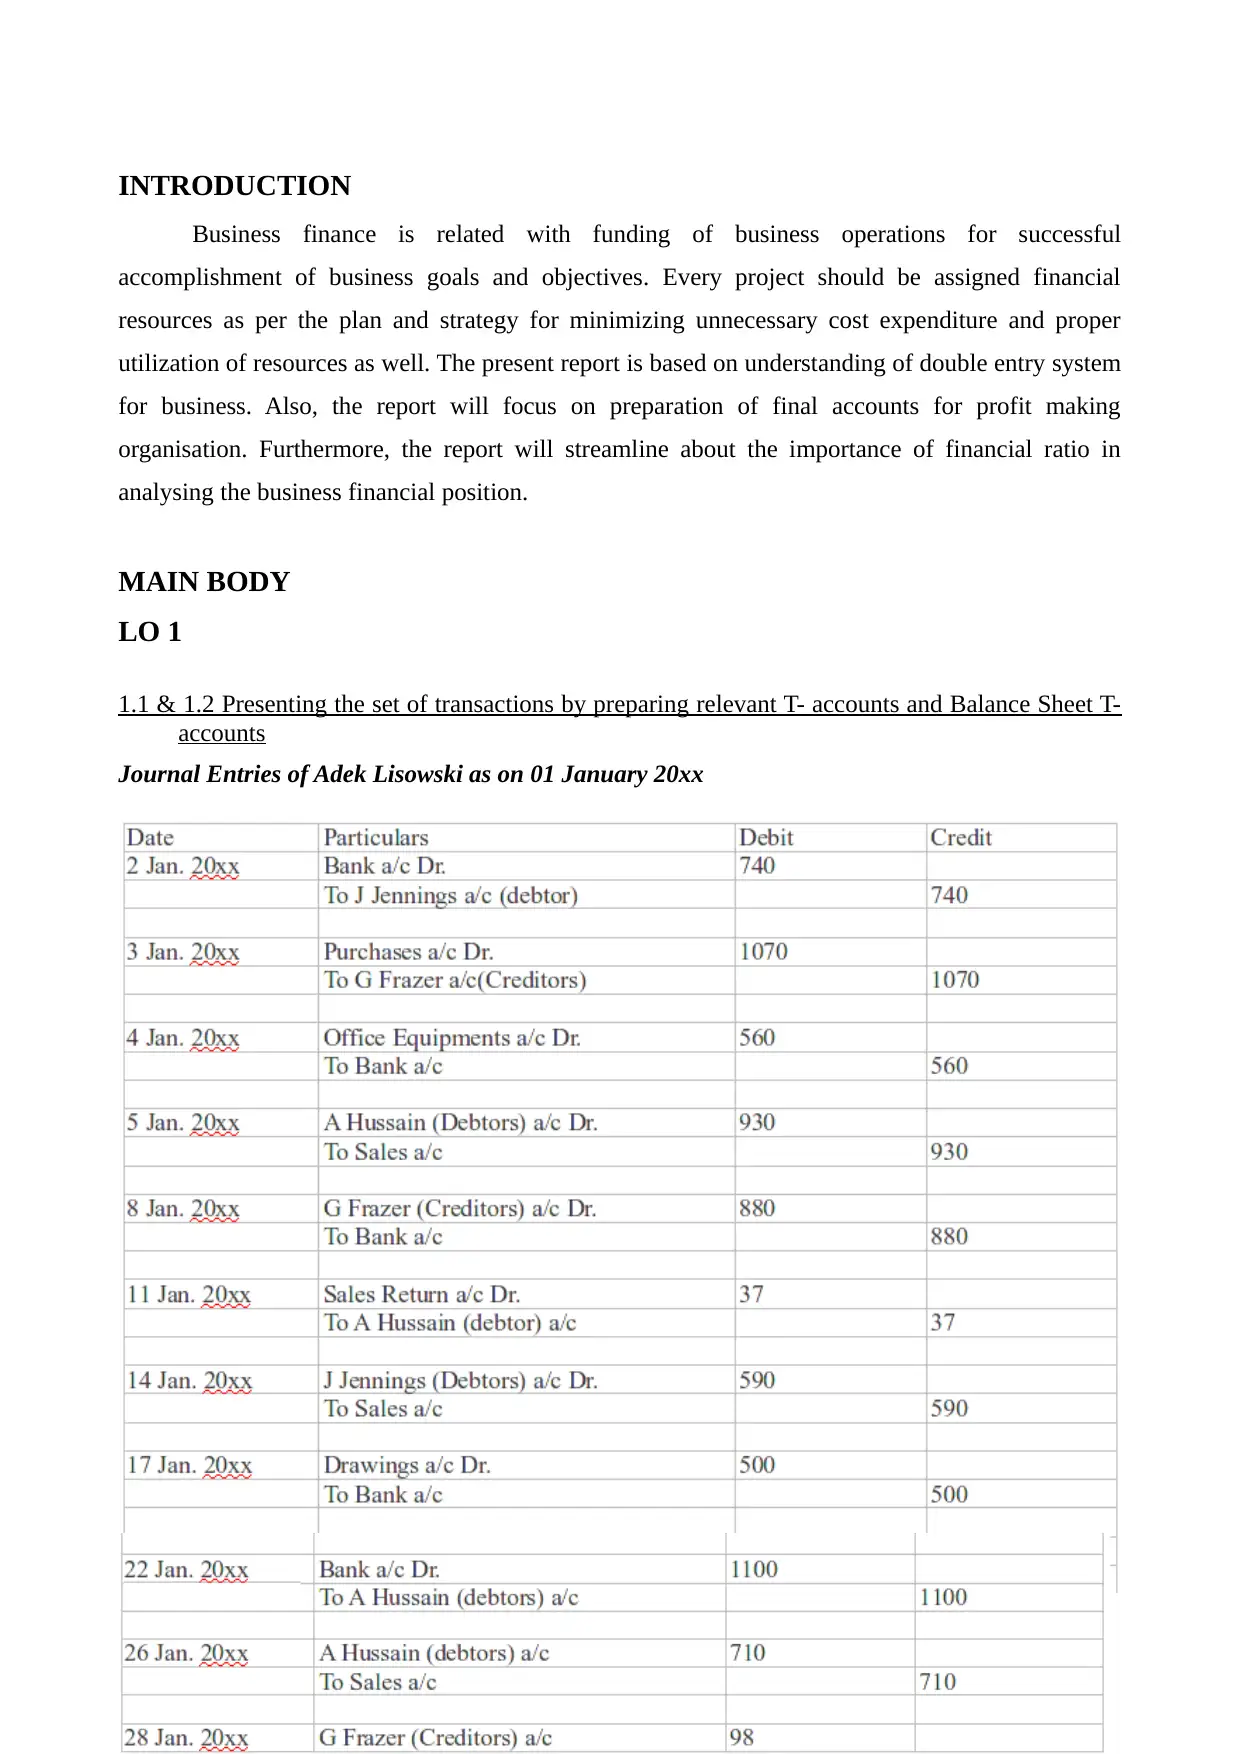
1.1 & 1.2 Presenting the set of transactions by preparing relevant T- accounts and Balance Sheet T-
accounts
Journal Entries of Adek Lisowski as on 01 January 20xx
Business finance is related with funding of business operations for successful
accomplishment of business goals and objectives. Every project should be assigned financial
resources as per the plan and strategy for minimizing unnecessary cost expenditure and proper
utilization of resources as well. The present report is based on understanding of double entry system
for business. Also, the report will focus on preparation of final accounts for profit making
organisation. Furthermore, the report will streamline about the importance of financial ratio in
analysing the business financial position.
MAIN BODY
LO 1
1.1 & 1.2 Presenting the set of transactions by preparing relevant T- accounts and Balance Sheet T-
accounts
Journal Entries of Adek Lisowski as on 01 January 20xx
⊘ This is a preview!⊘
Do you want full access?
Subscribe today to unlock all pages.
Trusted by 1+ million students worldwide
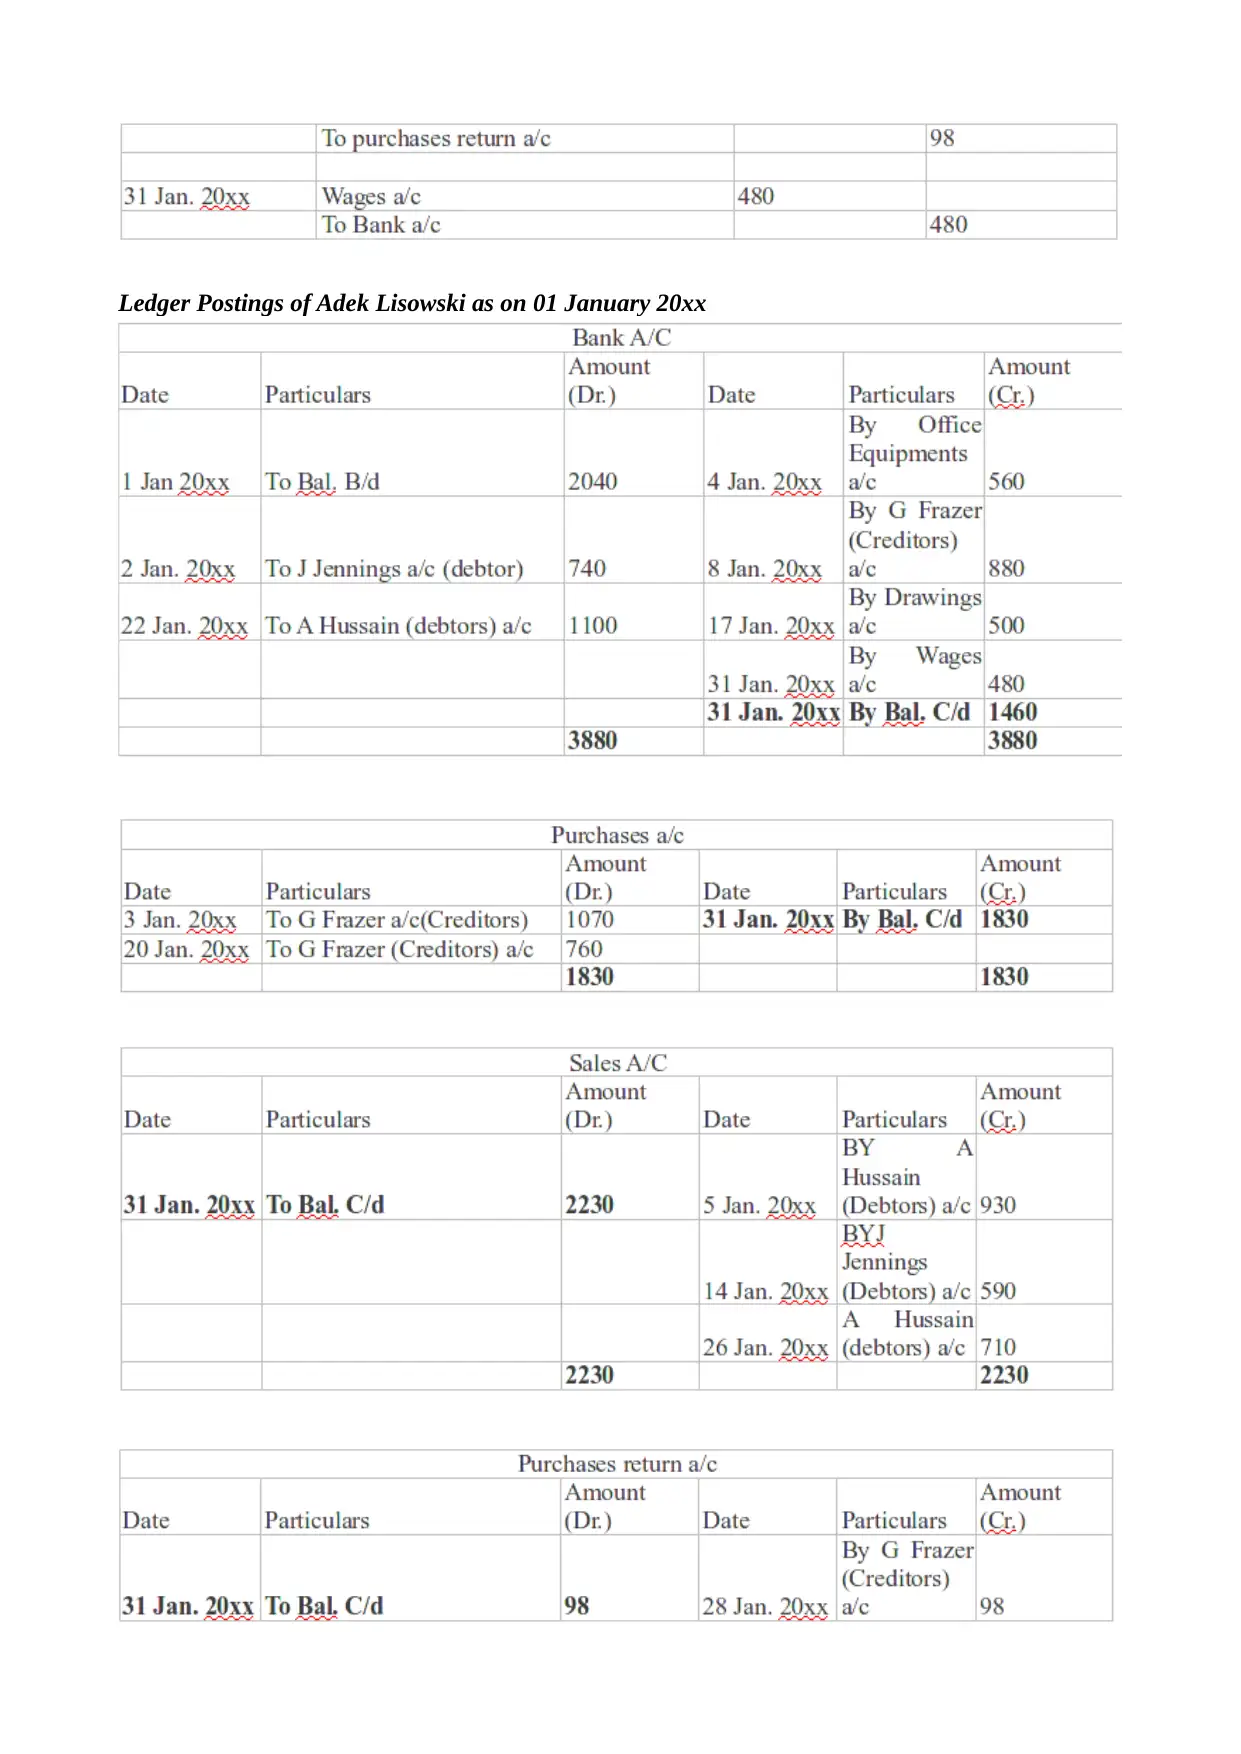
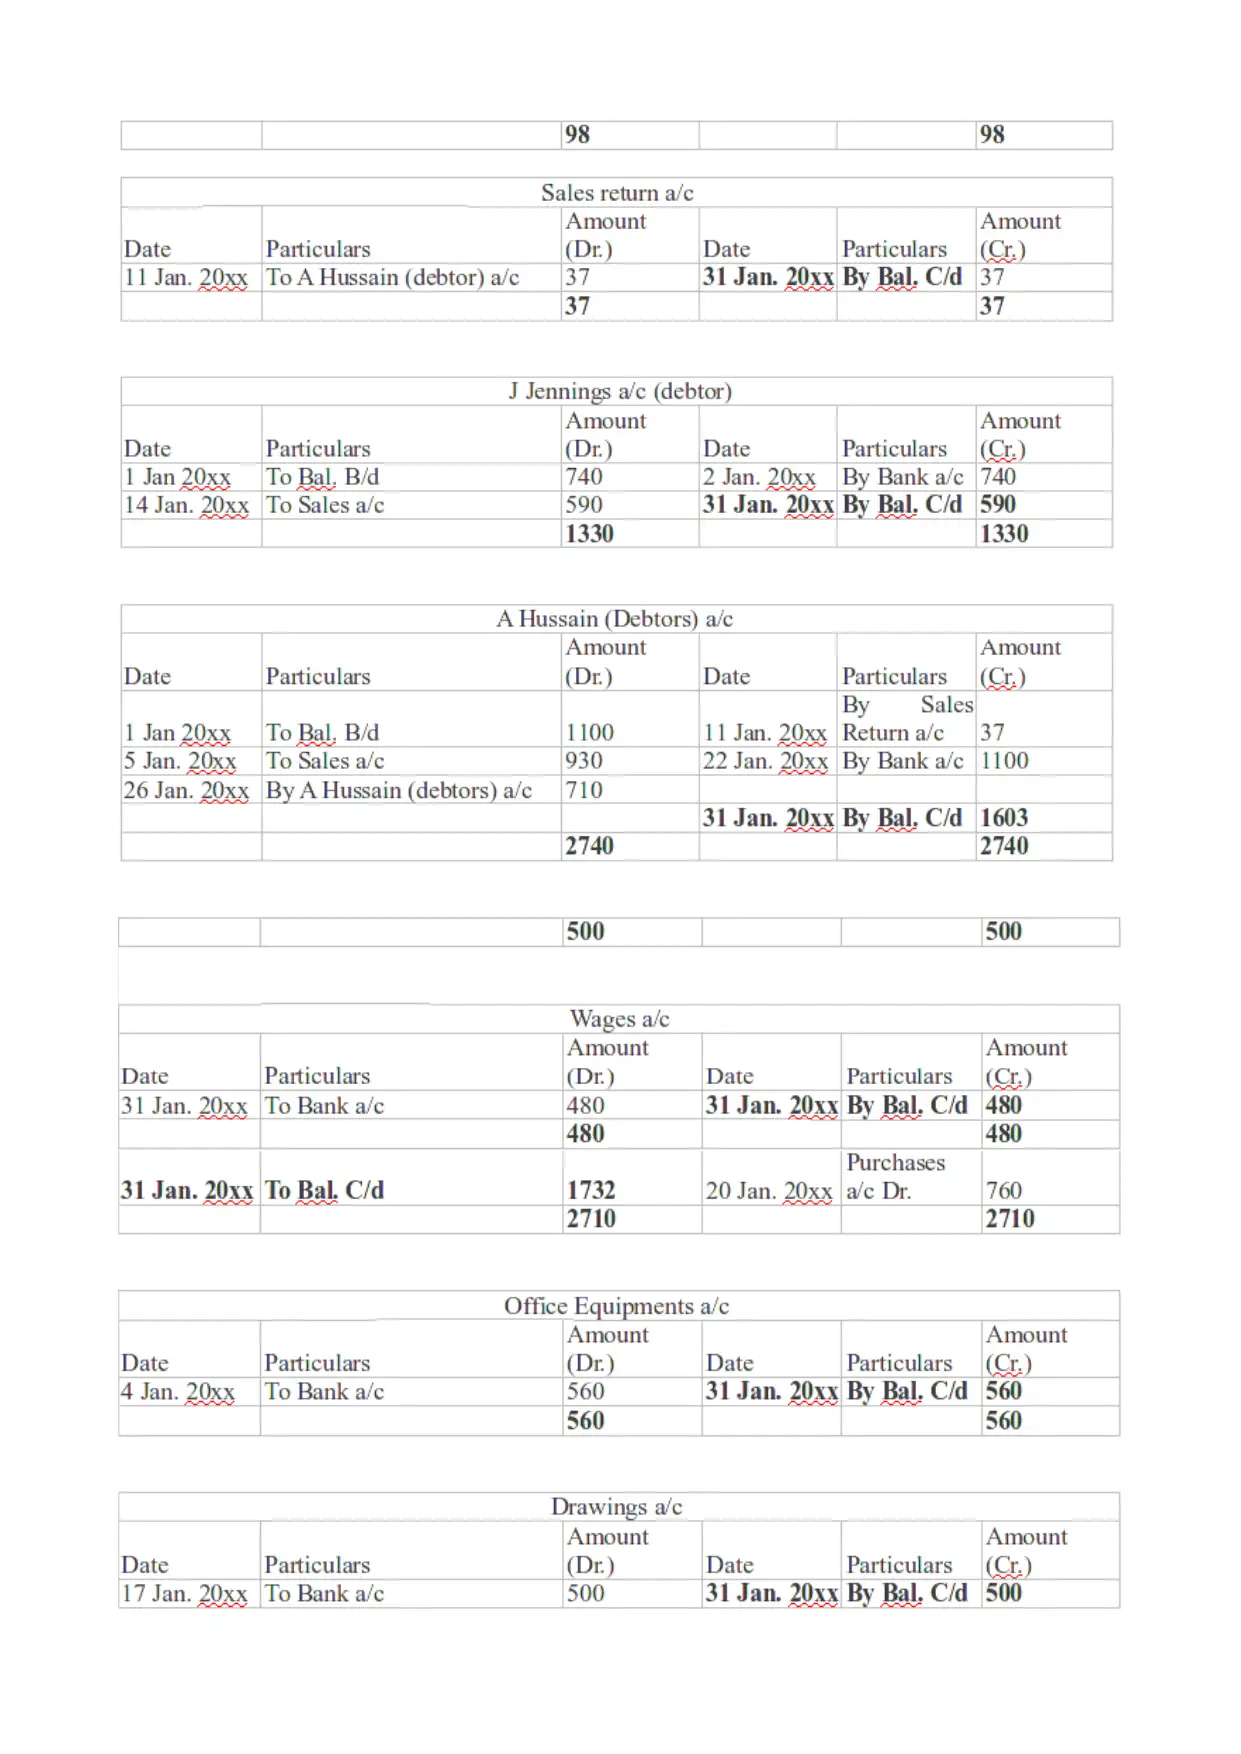
Ledger Postings of Adek Lisowski as on 01 January 20xx
Paraphrase This Document
Need a fresh take? Get an instant paraphrase of this document with our AI Paraphraser
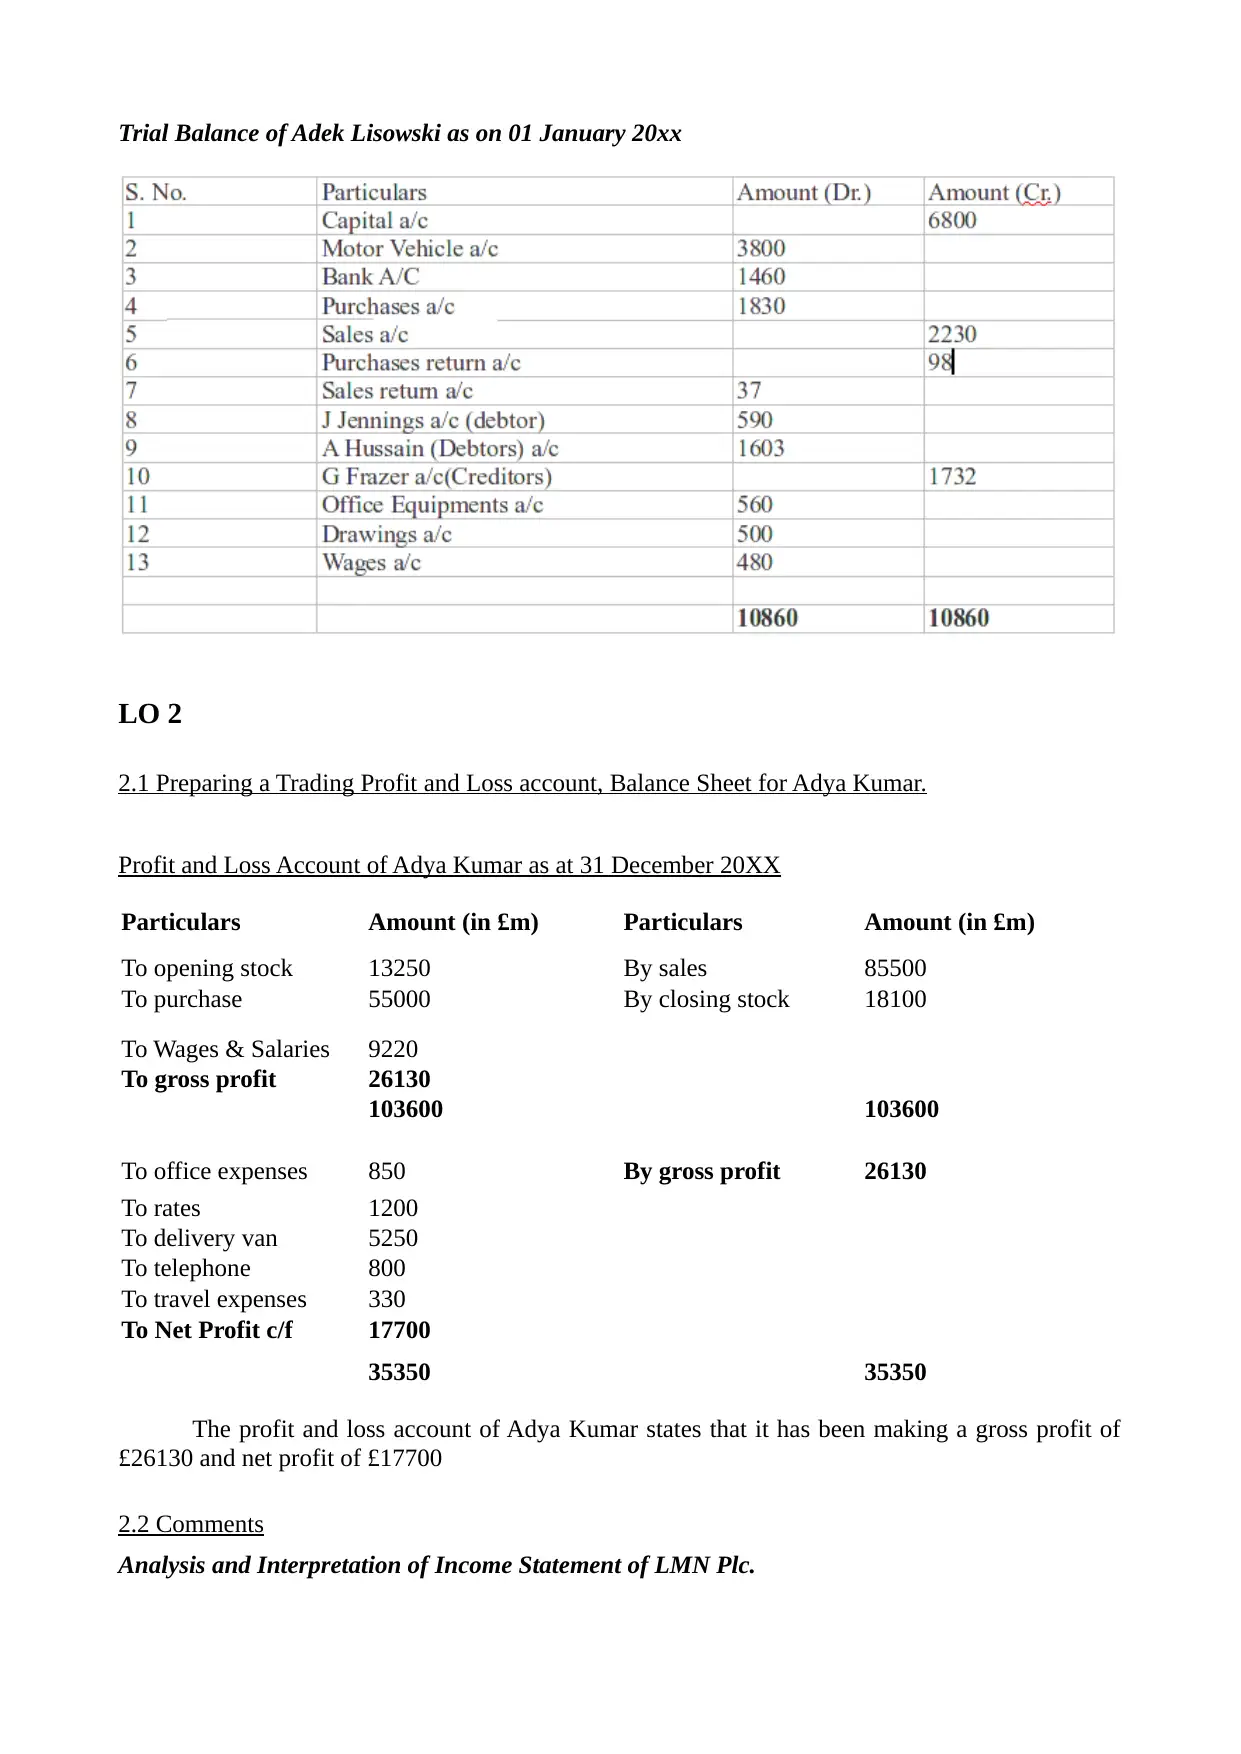
Trial Balance of Adek Lisowski as on 01 January 20xx
LO 2
2.1 Preparing a Trading Profit and Loss account, Balance Sheet for Adya Kumar.
Profit and Loss Account of Adya Kumar as at 31 December 20XX
Particulars Amount (in £m) Particulars Amount (in £m)
To opening stock 13250 By sales 85500
To purchase 55000 By closing stock 18100
To Wages & Salaries 9220
To gross profit 26130
103600 103600
To office expenses 850 By gross profit 26130
To rates 1200
To delivery van 5250
To telephone 800
To travel expenses 330
To Net Profit c/f 17700
35350 35350
The profit and loss account of Adya Kumar states that it has been making a gross profit of
£26130 and net profit of £17700
2.2 Comments
Analysis and Interpretation of Income Statement of LMN Plc.
⊘ This is a preview!⊘
Do you want full access?
Subscribe today to unlock all pages.
Trusted by 1+ million students worldwide
Balance Sheet of Adya Kumar as at 31 December 20XX
Statement of Financial Position 20XX
£ (m) £ (m)
Non-Current Assets -
Current Assets
Inventory 18100
Trade Receivables 1350
Bank 2700
22150
TOTAL ASSETS 22150
Capital
Share Capital 70000
Less: Net loss 47300
Less: Drawings -8100
Shareholder’s Equity 14600
Current Liabilities
Trade Payables 7550
7550
Non-current liabilities -
TOTAL LIABILITIES 22150
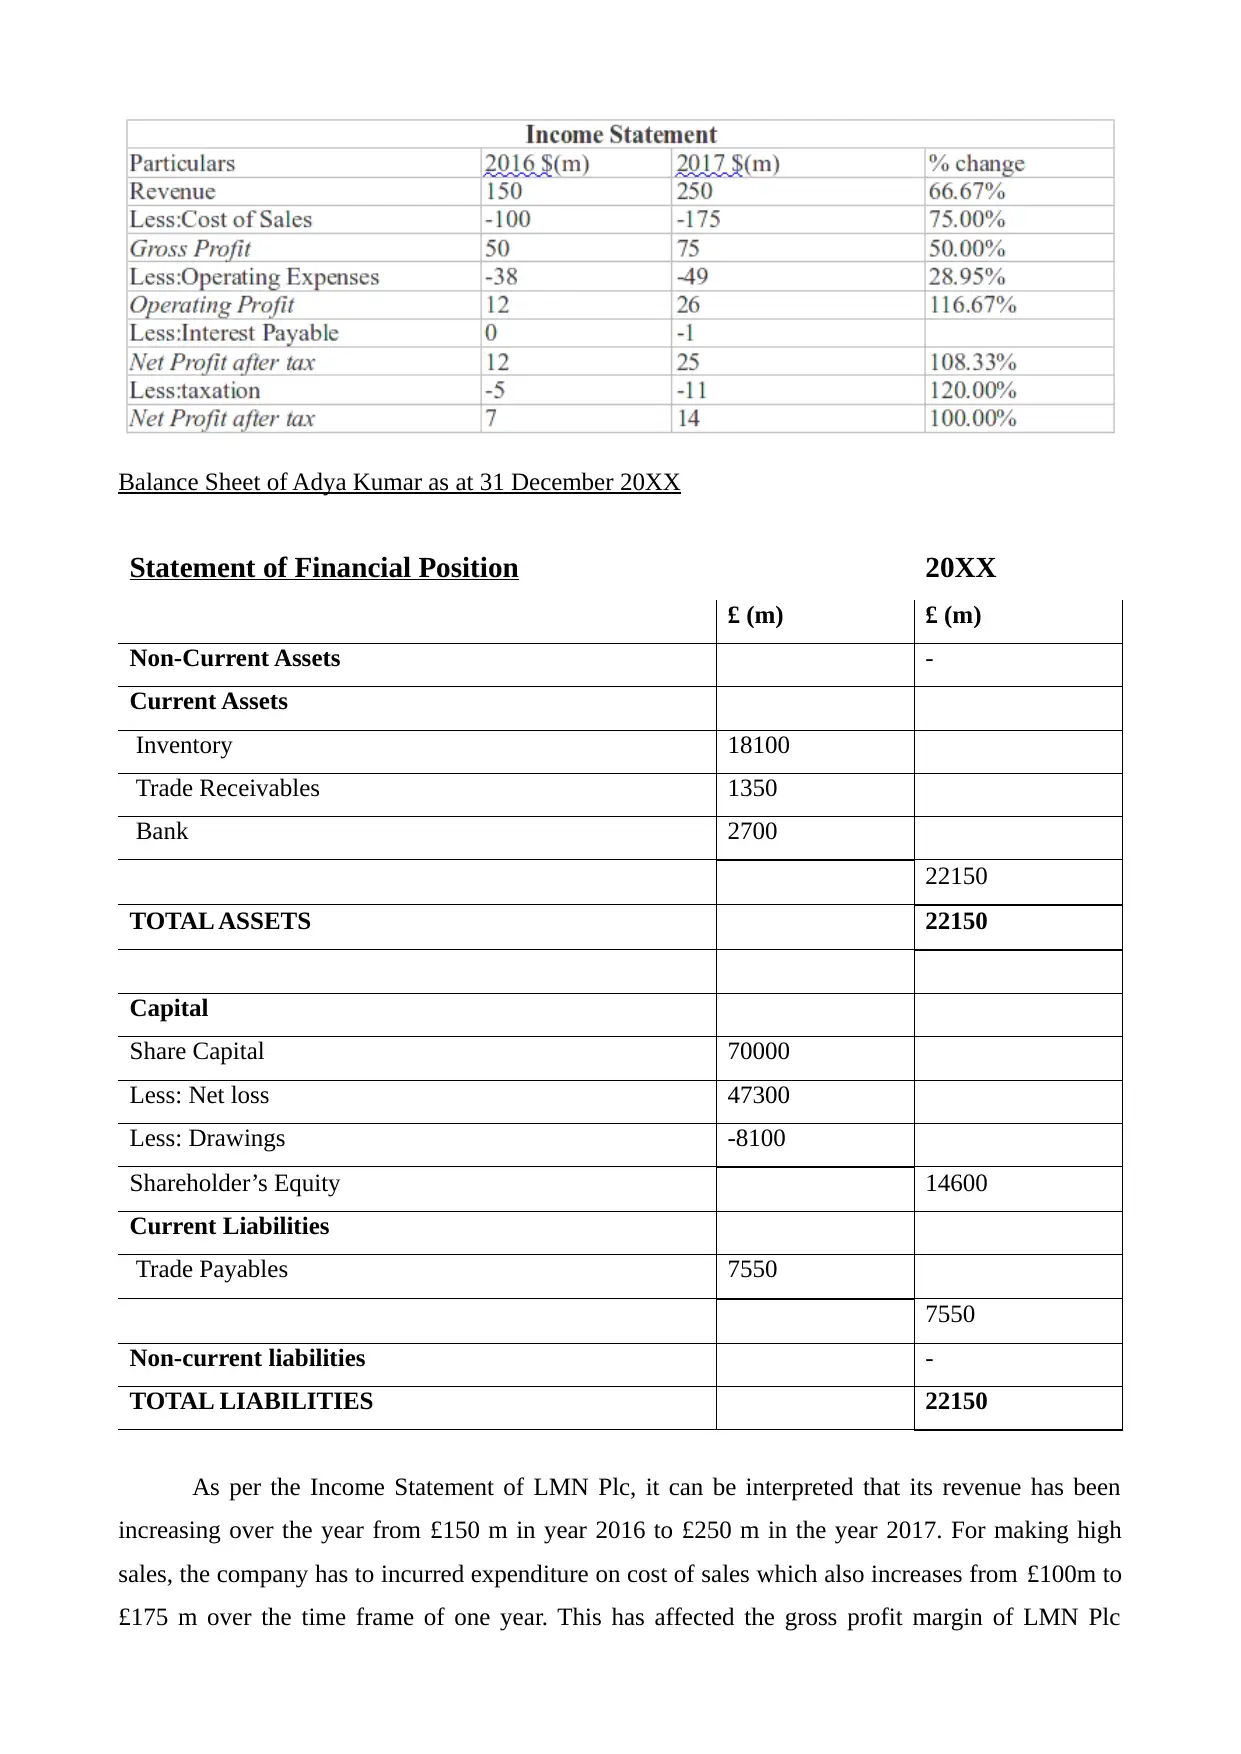
As per the Income Statement of LMN Plc, it can be interpreted that its revenue has been
increasing over the year from £150 m in year 2016 to £250 m in the year 2017. For making high
sales, the company has to incurred expenditure on cost of sales which also increases from £100m to
£175 m over the time frame of one year. This has affected the gross profit margin of LMN Plc
Statement of Financial Position 20XX
£ (m) £ (m)
Non-Current Assets -
Current Assets
Inventory 18100
Trade Receivables 1350
Bank 2700
22150
TOTAL ASSETS 22150
Capital
Share Capital 70000
Less: Net loss 47300
Less: Drawings -8100
Shareholder’s Equity 14600
Current Liabilities
Trade Payables 7550
7550
Non-current liabilities -
TOTAL LIABILITIES 22150
As per the Income Statement of LMN Plc, it can be interpreted that its revenue has been
increasing over the year from £150 m in year 2016 to £250 m in the year 2017. For making high
sales, the company has to incurred expenditure on cost of sales which also increases from £100m to
£175 m over the time frame of one year. This has affected the gross profit margin of LMN Plc
Paraphrase This Document
Need a fresh take? Get an instant paraphrase of this document with our AI Paraphraser
which has increases upto £75 m in one year making improvement in the overall performance level.
Also, after making all the deduction of operational nature the operating profit of LMN Plc doubled
from £12 m in the year 2016 to £26 m in 2017 which is a sign of high growth and success for the
company. Also, after making payment of interest and tax amount, the net profit margin has reached
to double level i.e. £14 in the year 2017 from £7 m in 2016.
In the Statement of Financial position of LMN Plc, when it comes to asset side it can be said
that company has increased it Non current Asset along with Inventory and Trade receivables (Tian
and et.al., 2016). But the cash holding of the company has decreased from £10 m to £4 m in one
year. In case of Reserves, the company has focuses on retention of profit amount for future business
expansion making reserves level high. Also, the trade payables and overdraft facility has been
increasing with rapid phase along with addition of loan amount in the year 2017. From balance
sheet, it can be concluded that business has been growing and earning high profit (Chen and et.al.,
2019).
LO 3
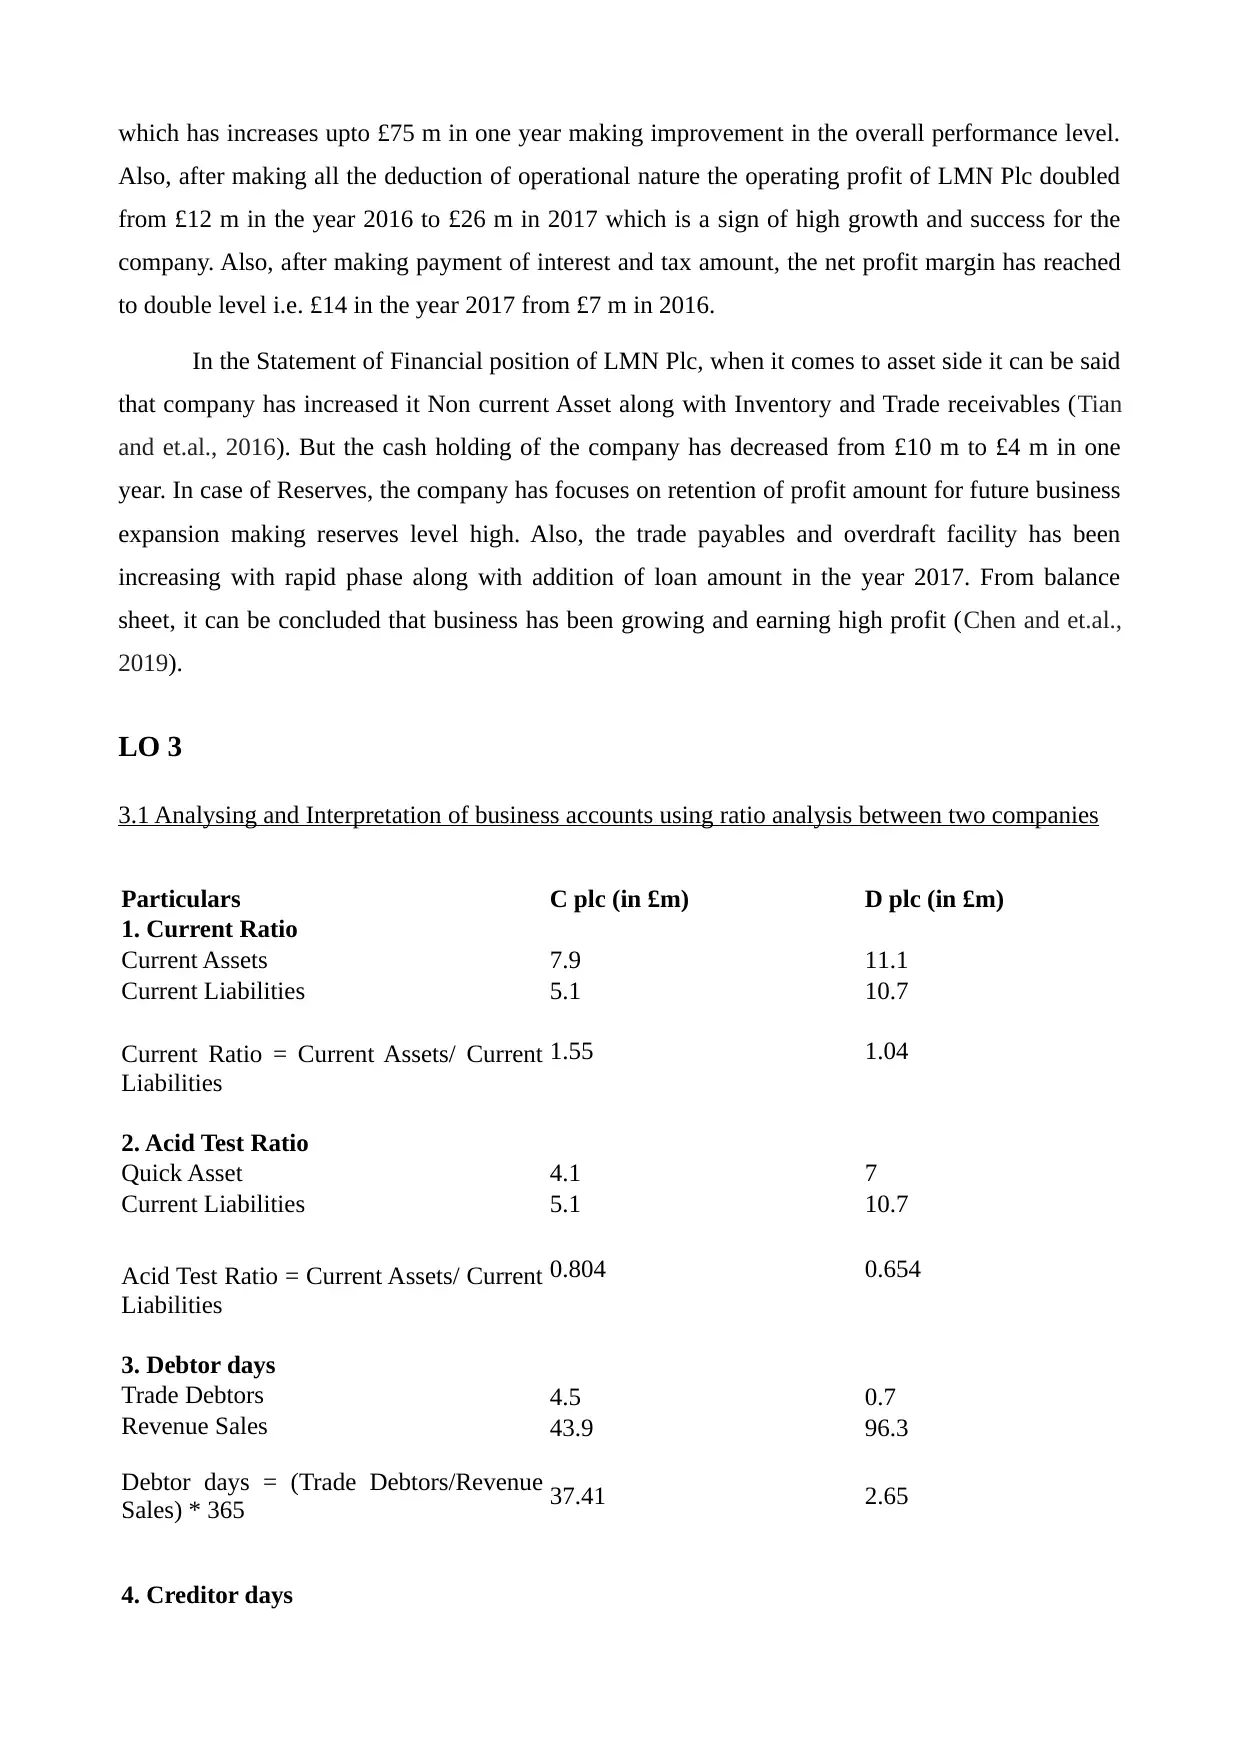
3.1 Analysing and Interpretation of business accounts using ratio analysis between two companies
Particulars C plc (in £m) D plc (in £m)
1. Current Ratio
Current Assets 7.9 11.1
Current Liabilities 5.1 10.7
Current Ratio = Current Assets/ Current
Liabilities
1.55 1.04
2. Acid Test Ratio
Quick Asset 4.1 7
Current Liabilities 5.1 10.7
Acid Test Ratio = Current Assets/ Current
Liabilities
0.804 0.654
3. Debtor days
Trade Debtors 4.5 0.7
Revenue Sales 43.9 96.3
Debtor days = (Trade Debtors/Revenue
Sales) * 365 37.41 2.65
4. Creditor days
Also, after making all the deduction of operational nature the operating profit of LMN Plc doubled
from £12 m in the year 2016 to £26 m in 2017 which is a sign of high growth and success for the
company. Also, after making payment of interest and tax amount, the net profit margin has reached
to double level i.e. £14 in the year 2017 from £7 m in 2016.
In the Statement of Financial position of LMN Plc, when it comes to asset side it can be said
that company has increased it Non current Asset along with Inventory and Trade receivables (Tian
and et.al., 2016). But the cash holding of the company has decreased from £10 m to £4 m in one
year. In case of Reserves, the company has focuses on retention of profit amount for future business
expansion making reserves level high. Also, the trade payables and overdraft facility has been
increasing with rapid phase along with addition of loan amount in the year 2017. From balance
sheet, it can be concluded that business has been growing and earning high profit (Chen and et.al.,
2019).
LO 3
3.1 Analysing and Interpretation of business accounts using ratio analysis between two companies
Particulars C plc (in £m) D plc (in £m)
1. Current Ratio
Current Assets 7.9 11.1
Current Liabilities 5.1 10.7
Current Ratio = Current Assets/ Current
Liabilities
1.55 1.04
2. Acid Test Ratio
Quick Asset 4.1 7
Current Liabilities 5.1 10.7
Acid Test Ratio = Current Assets/ Current
Liabilities
0.804 0.654
3. Debtor days
Trade Debtors 4.5 0.7
Revenue Sales 43.9 96.3
Debtor days = (Trade Debtors/Revenue
Sales) * 365 37.41 2.65
4. Creditor days
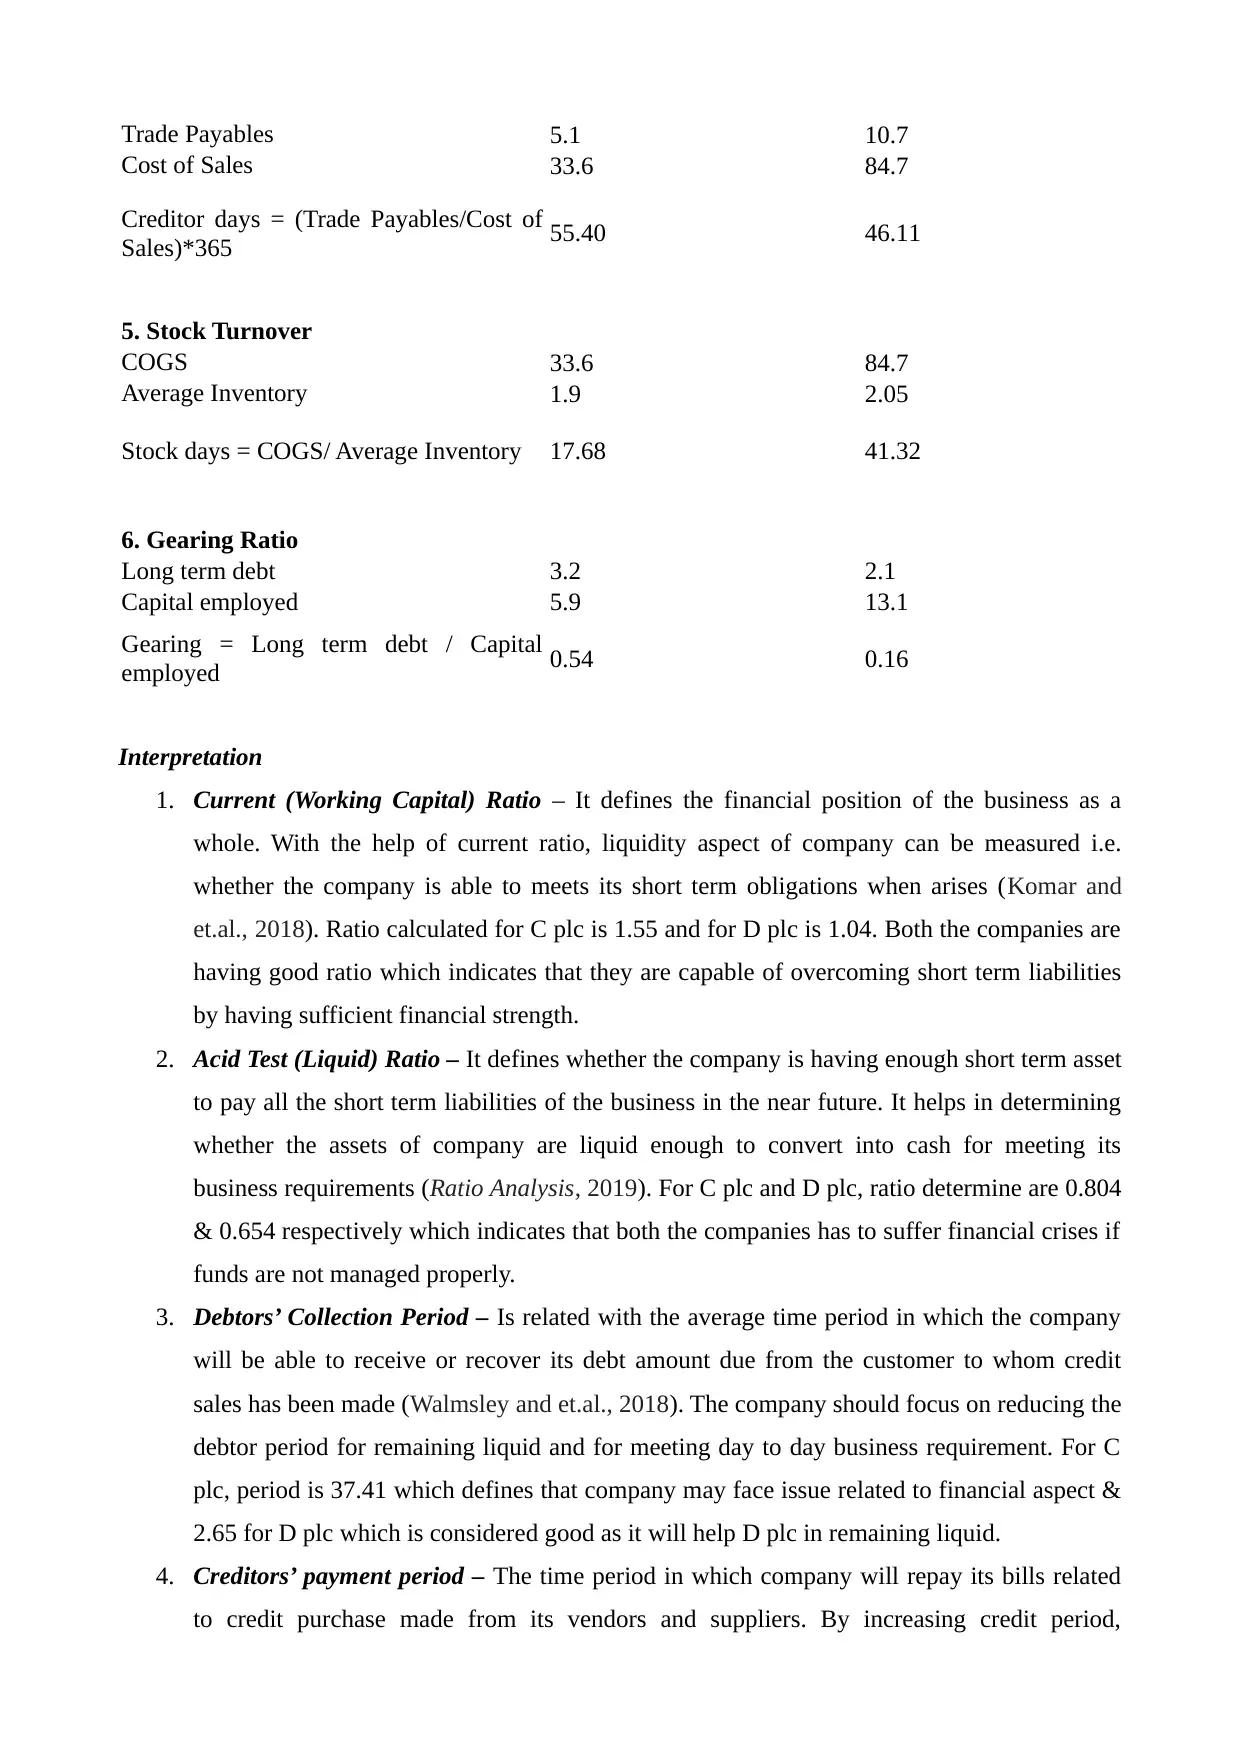
Trade Payables 5.1 10.7
Cost of Sales 33.6 84.7
Creditor days = (Trade Payables/Cost of
Sales)*365 55.40 46.11
5. Stock Turnover
COGS 33.6 84.7
Average Inventory 1.9 2.05
Stock days = COGS/ Average Inventory 17.68 41.32
6. Gearing Ratio
Long term debt 3.2 2.1
Capital employed 5.9 13.1
Gearing = Long term debt / Capital
employed 0.54 0.16
Interpretation
1. Current (Working Capital) Ratio – It defines the financial position of the business as a
whole. With the help of current ratio, liquidity aspect of company can be measured i.e.
whether the company is able to meets its short term obligations when arises (Komar and
et.al., 2018). Ratio calculated for C plc is 1.55 and for D plc is 1.04. Both the companies are
having good ratio which indicates that they are capable of overcoming short term liabilities
by having sufficient financial strength.
2. Acid Test (Liquid) Ratio – It defines whether the company is having enough short term asset
to pay all the short term liabilities of the business in the near future. It helps in determining
whether the assets of company are liquid enough to convert into cash for meeting its
business requirements (Ratio Analysis, 2019). For C plc and D plc, ratio determine are 0.804
& 0.654 respectively which indicates that both the companies has to suffer financial crises if
funds are not managed properly.
3. Debtors’ Collection Period – Is related with the average time period in which the company
will be able to receive or recover its debt amount due from the customer to whom credit
sales has been made (Walmsley and et.al., 2018). The company should focus on reducing the
debtor period for remaining liquid and for meeting day to day business requirement. For C
plc, period is 37.41 which defines that company may face issue related to financial aspect &
2.65 for D plc which is considered good as it will help D plc in remaining liquid.
4. Creditors’ payment period – The time period in which company will repay its bills related
to credit purchase made from its vendors and suppliers. By increasing credit period,
⊘ This is a preview!⊘
Do you want full access?
Subscribe today to unlock all pages.
Trusted by 1+ million students worldwide
company will have enough cash with itself which helps in smooth functioning. 55.40 &
46.11 is days calculated for C plc & D plc respectively. For C plc it is better as it will have
cash with it for long time for meeting its current working capital need as compared to D plc.
5. Stock Turnover Ratio – Is ratio which determines how effectively the company is using its
business resources and raw material for producing stock (Rashmi and et.al., 2017). This
ratio helps in evaluating the effectiveness of the business in converting its stock into sales
and thus earning profit. In 17.68 days, C plc will be able to convert its stock into sales which
is very good as it is required to incurred any cost expenses for making sales & 41.32 days is
required for D plc to make sales.
6. Gearing Ratio – It is a measure which helps in assessing how much the operations of
company is financed by debt and equity option. For C plc 0.54 is ratio which states that
company is having high degree of financial leverage & 0.16 is ratio for D plc which is good.
CONCLUSION
From the above report it can be concluded that by having sound and effective business
policies, plans and strategies related to business and financial operations, every business
organisation can achieve high profitability in an easy manner. Also, ensuing proper and accurate
allocation of business resources, every department can make its use for having high productivity. By
presenting financial information in the correct manner with the help of double entry system, a
company can make its business as well as investment related decision properly. Further the report
has defined that by making correct presentation of financial as well as accounting information with
the help of financial accounts, the financial position of business can be evaluated. At last, the report
has discussed that, both the companies named as D plc and C plc are performing better. But C plc is
much better as it is having good current ratio which helps it in remaining liquid. Also, C plc is
having good creditor period and take less time to convert its stock into sales as compared to D plc.
Paraphrase This Document
Need a fresh take? Get an instant paraphrase of this document with our AI Paraphraser
REFERENCES
Books and Journals
Chen, Q. and et.al., 2019. A Balance-Sheet-Based Measure of Accounting Quality. Available at
SSRN 3315505.
Komar, N. and et.al., 2018. Forage ratio analysis of the southern house mosquito in college station,
Texas. Vector-Borne and Zoonotic Diseases. 18(9). pp.485-490.
Rashmi, D. and et.al., 2017. Stable isotope ratio analysis in determining the geographical
traceability of Indian wheat. Food control. 79. pp.169-176.
Tian, J. Y. and et.al., 2016. August. Improvement and enhancement of the income statement. In 3d
International Conference on Applied Social Science Research (ICASSR 2015). Atlantis
Press.
Walmsley, T. G. And et.al., 2018. Energy Ratio analysis and accounting for renewable and non-
renewable electricity generation: A review. Renewable and Sustainable Energy
Reviews. 98. pp.328-345.
Online
Ratio Analysis, 2019. [Online]. Available through: <https://www.accountingtools.com/articles/ratio-
analysis.html >.
1 out of 11


Your All-in-One AI-Powered Toolkit for Academic Success.
+13062052269
info@desklib.com
Available 24*7 on WhatsApp / Email
![[object Object]](/_next/static/media/star-bottom.7253800d.svg)
Unlock your academic potential
Copyright © 2020–2026 A2Z Services. All Rights Reserved. Developed and managed by ZUCOL.