Data Handling Report for Amazures Flair: Business Performance Analysis
VerifiedAdded on 2020/12/18
|8
|1004
|323
Report
AI Summary
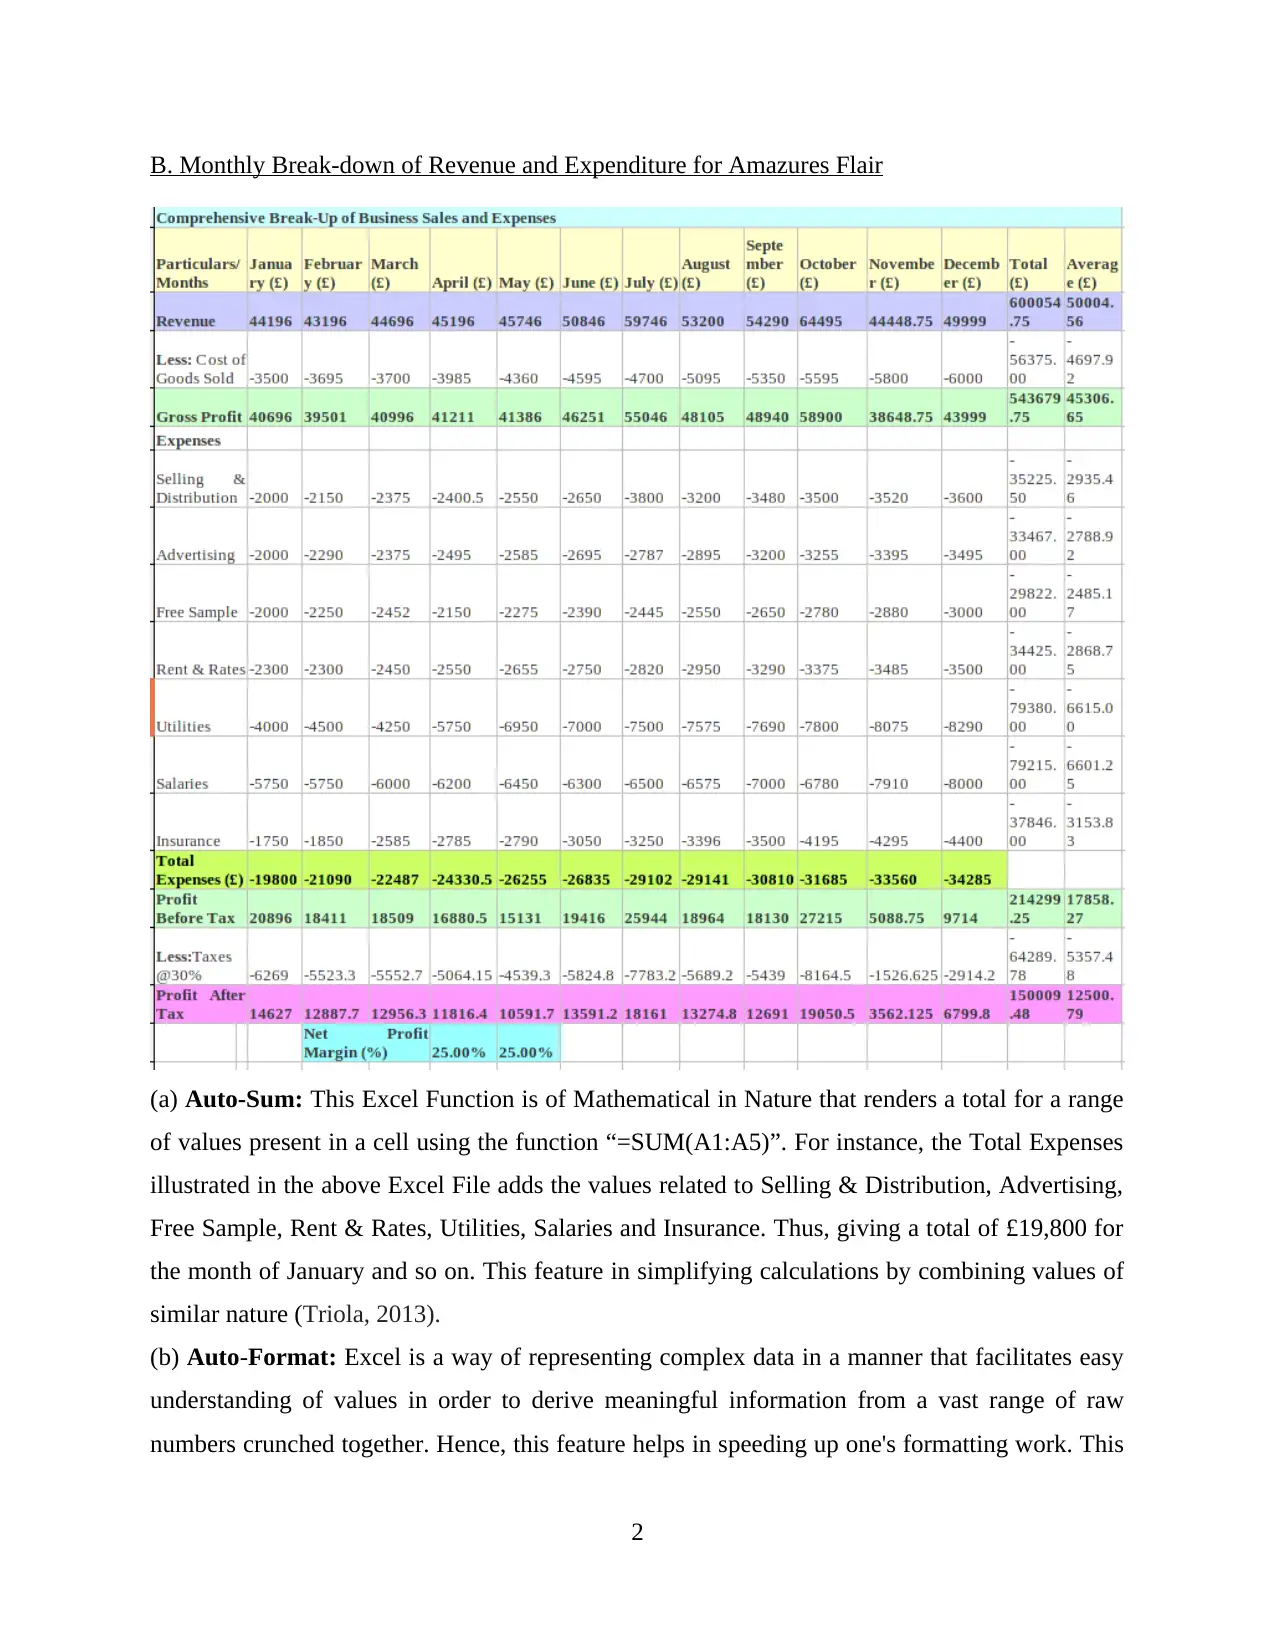
This report provides a comprehensive analysis of Amazures Flair, a retail business based in West London. The report delves into the company's business overview, highlighting its focus on womenswear and its combination of online and offline revenue streams. The analysis includes a detailed breakdown of monthly revenue and expenditure using Excel, demonstrating the application of various Excel functions such as Auto-Sum, Auto-Format, Average Formula, Percentage, and password protection. The report further presents the data through bar charts and graphical representations, illustrating the sources of income and distribution of investment. The evaluation of the spreadsheet design emphasizes the importance of organized and logical data presentation for effective business analysis. The conclusion underscores the significance of external financing for business expansion and the role of spreadsheet design in facilitating financial analysis for attracting capital.

DATA HANDLING
Paraphrase This Document
Need a fresh take? Get an instant paraphrase of this document with our AI Paraphraser

Table of Contents
INTRODUCTION...........................................................................................................................1
TASK 1............................................................................................................................................1
A. Business Overview.................................................................................................................1
B. Monthly Break-down of Revenue and Expenditure for Amazures Flair...............................2
TASK 2............................................................................................................................................5
Evaluating the approach used in designing the spreadsheet.......................................................5
CONCLUSION................................................................................................................................5
REFERENCES................................................................................................................................6

INTRODUCTION
Retail Business is one of the major sectors that dominates the overall economic growth of
United Kingdom. Usually, such ventures are created using a limited amount of capital, that is
mainly employed through Bank Loans and contributions made by Owner's Family and Friends.
This report aims to provide a comprehensive break-up of Amazures Flair which is a clothing
company operating under retail sector using Excel.
TASK 1
A. Business Overview
Amazures Flair is an independent run retail business based out of West London that
offers a wide array of womenswear. Its team works tirelessly to design, produce and deliver a
limited edition of fashion products along with suggestive accessories and gifts based in
accordance with the latest trends. However, its limited availability of products does not hinder its
customers from having a value-enhancing experience as most of its products are priced between
£30 to £150. Amazures' Business model is based on a combination of online and offline revenue
sources of income. As it is a highly skilled based venture, the company requires an adequate
amount of capital in order to meet its daily working capital requirements.
1
⊘ This is a preview!⊘
Do you want full access?
Subscribe today to unlock all pages.

Trusted by 1+ million students worldwide

B. Monthly Break-down of Revenue and Expenditure for Amazures Flair
(a) Auto-Sum: This Excel Function is of Mathematical in Nature that renders a total for a range
of values present in a cell using the function “=SUM(A1:A5)”. For instance, the Total Expenses
illustrated in the above Excel File adds the values related to Selling & Distribution, Advertising,
Free Sample, Rent & Rates, Utilities, Salaries and Insurance. Thus, giving a total of £19,800 for
the month of January and so on. This feature in simplifying calculations by combining values of
similar nature (Triola, 2013).
(b) Auto-Format: Excel is a way of representing complex data in a manner that facilitates easy
understanding of values in order to derive meaningful information from a vast range of raw
numbers crunched together. Hence, this feature helps in speeding up one's formatting work. This
2
Paraphrase This Document
Need a fresh take? Get an instant paraphrase of this document with our AI Paraphraser

will allow preset formatting of the table thus helping in analysing the given information in a
better manner (Harvey, 2018).
(c) Average Formula: This feature of Excel is used by users in order to find out the central
measure of tendency, that is, mean. The function used for this purpose is “=AVERAGE(A1:G1)”
that would give an average Revenue for the year, £50,004.56, as illustrated in the above table.
(d) Percentage: Percentage function of Excel, as the name suggests, facilitates the percent value
of a given range of data. There is no universal formula for this function, however, one may use
“=O14/A2”. Other than this, there is a direct function “%” given in the Excel itself, which
furthermore simplifies its related calculations.
(e) Password Protecting Spreadsheet: Every user aims to protect their work in order to prevent
the possibility of cloning work. This is an important part of business organisations as values
related to their sales and expenses are a highly sensitive matter of concern. Hence, Excel
provides the function of protecting one's spreadsheet using passwords(Walkenbach, 2013).
(f) Presentation of Expenditure using a Bar Chart:
January
February
March
April
May
June
July
August
September
October
November
December
0 5000 10000 15000 20000 25000 30000 35000 40000
19800
21090
22487
24330.5
26255
26835
29102
29141
30810
31685
33560
34285
Expenditure Graph (£)
Total Expenses (£)
Expenses (£)
Months
(g) Graphical Representation Amazures Flair's of Sources of Income:
3

57%
43%
Sources Of Income
Offline
Sales
Online
Sales
The two main sources of a retail business such as Amazures includes Offline and Online
Revenue Streams. Out of these two 57% of the revenues are generated from Offline sales, which
is £345,000 and remaining from online, that is £255,054.75.
(h) Distribution of Investment between Capital, Stock and Operation Money:
19%
47%
34%
Distribution of Investment between Capital, Stock and Operation Money
Capital
Stock
Operation
Money
4
⊘ This is a preview!⊘
Do you want full access?
Subscribe today to unlock all pages.

Trusted by 1+ million students worldwide

TASK 2
Evaluating the approach used in designing the spreadsheet
An ideal spreadsheet design would include data that has been organised in a logical
manner which not only enables understanding but also helps in providing faster and accurate
conclusions to the user of such reports (Alexander and Walkenbach, 2013). In the context of
given case scenario, the spreadsheet has been designed in a manner which depicts the share
contributed by the company in relation to sources of income as well as investment options apart
from providing detailed break-down of amounts in the spreadsheet.
CONCLUSION
From the above report it can be concluded that businesses such as Amazures Flair need
to take help from Banks apart from their personal contributions so as to finance themselves for
expansionary purposes. Such streams may include Stock, Capital as well as Operation Money.
Additionally, it can also be inferred that spreadsheet designing helps in providing such
institutions with an enhanced or detailed break-down of a business' financials in an effective
manner so as to help them in receiving such additional capital on credit from Banks and other
similar entities.
5
Paraphrase This Document
Need a fresh take? Get an instant paraphrase of this document with our AI Paraphraser

REFERENCES
Books and Journal
Triola, M. F., 2013. Elementary statistics using Excel. Pearson.
Harvey, G., 2018. Excel 2019 All-in-one for Dummies. For Dummies.
Walkenbach, J., 2013. Excel 2013 bible. John Wiley & Sons.
Alexander, M. and Walkenbach, J., 2013. Excel dashboards and reports (Vol. 17). John Wiley &
Sons.
6
1 out of 8
Related Documents

Your All-in-One AI-Powered Toolkit for Academic Success.
+13062052269
info@desklib.com
Available 24*7 on WhatsApp / Email
Unlock your academic potential
Copyright © 2020–2025 A2Z Services. All Rights Reserved. Developed and managed by ZUCOL.