Business Analysis and Statistics Case Study: Athlete Panda Retailer

Verified

Added on  2023/06/06

|24
|2724
|383
Case Study
AI Summary
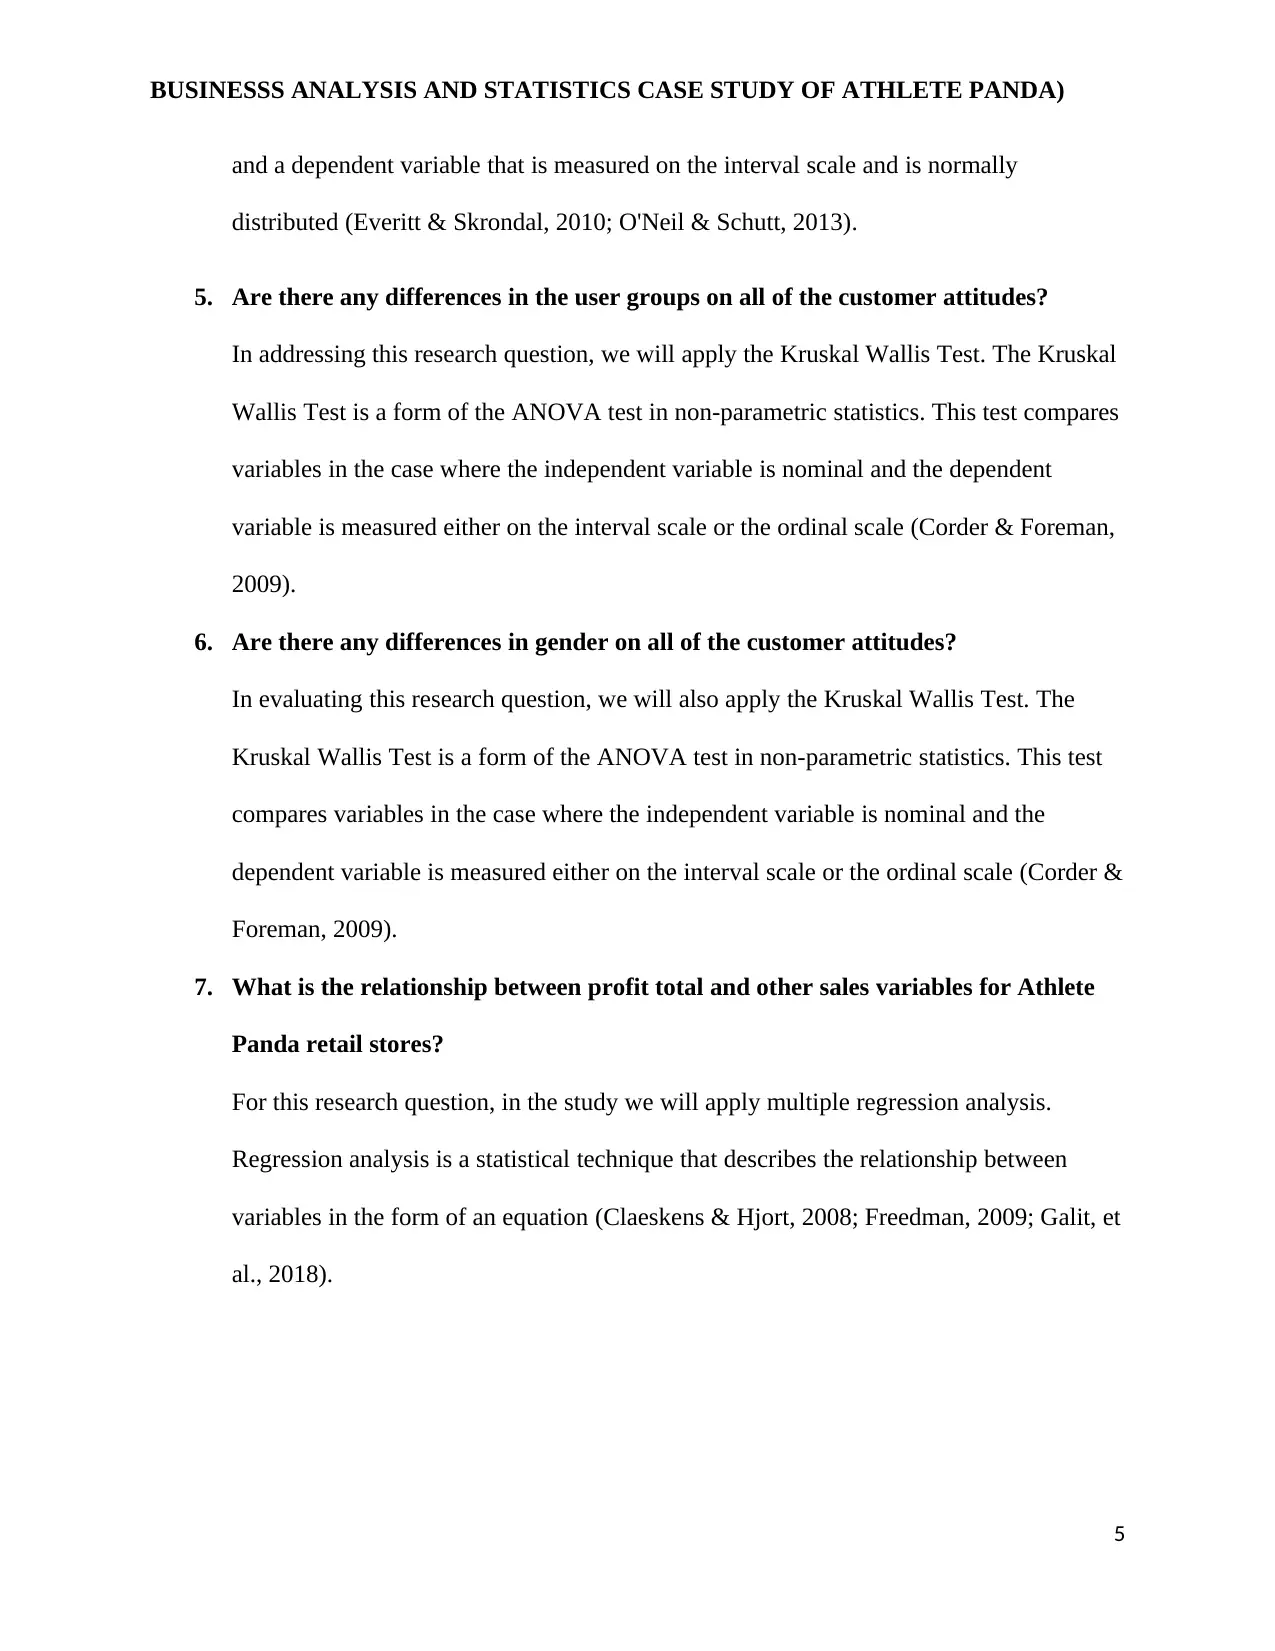
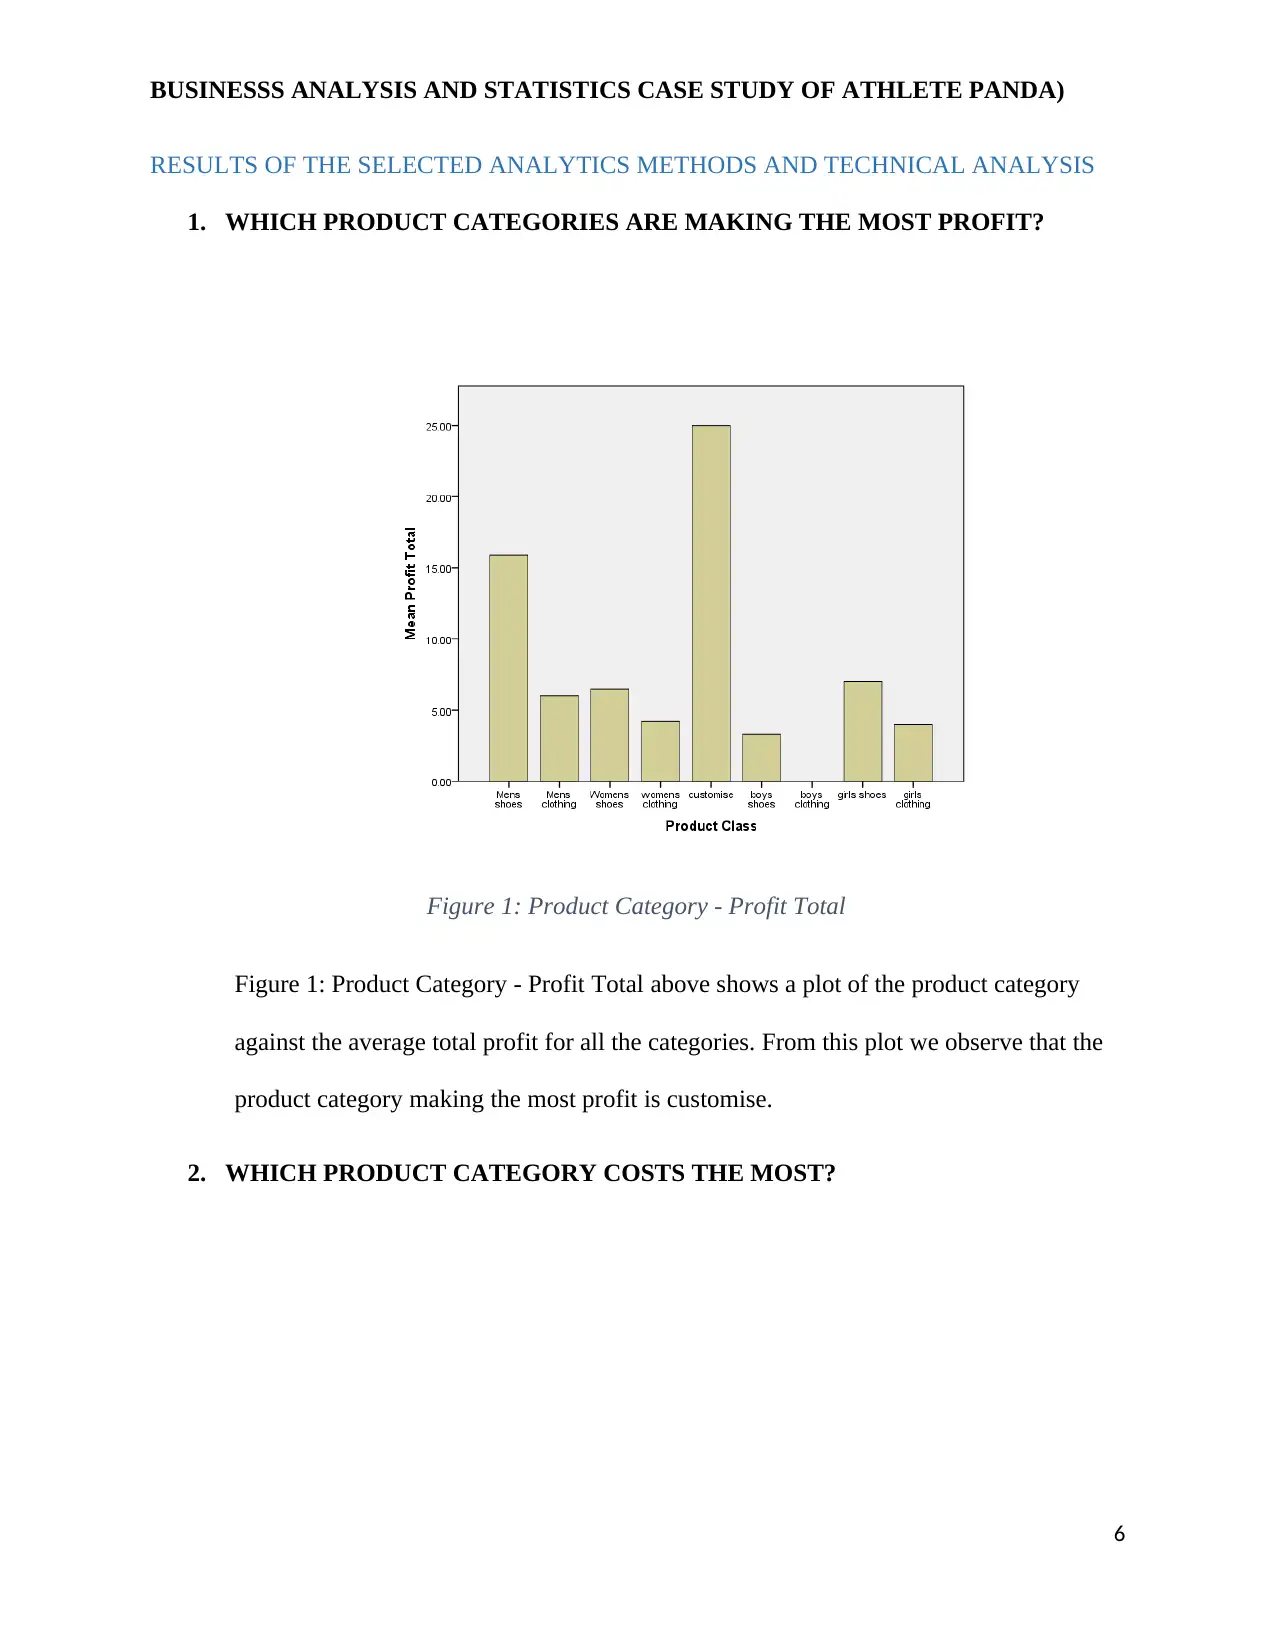
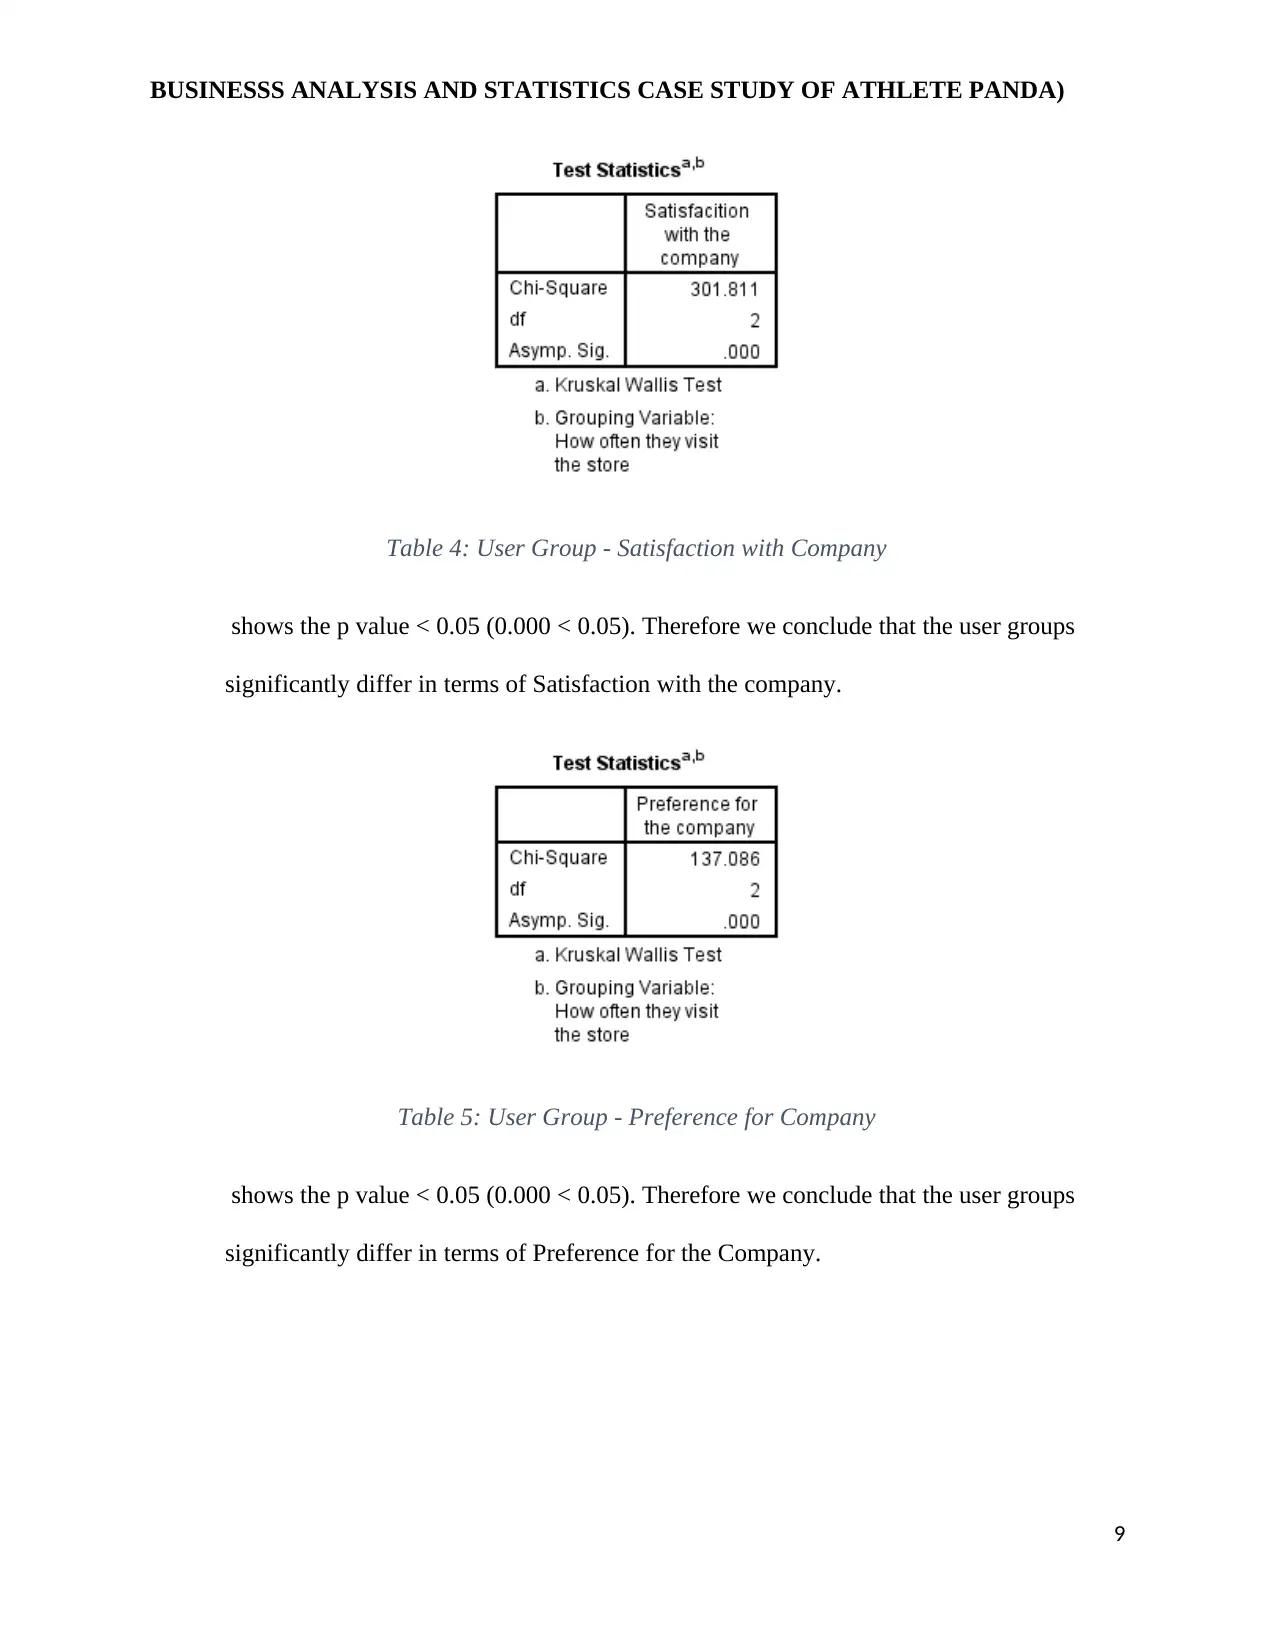
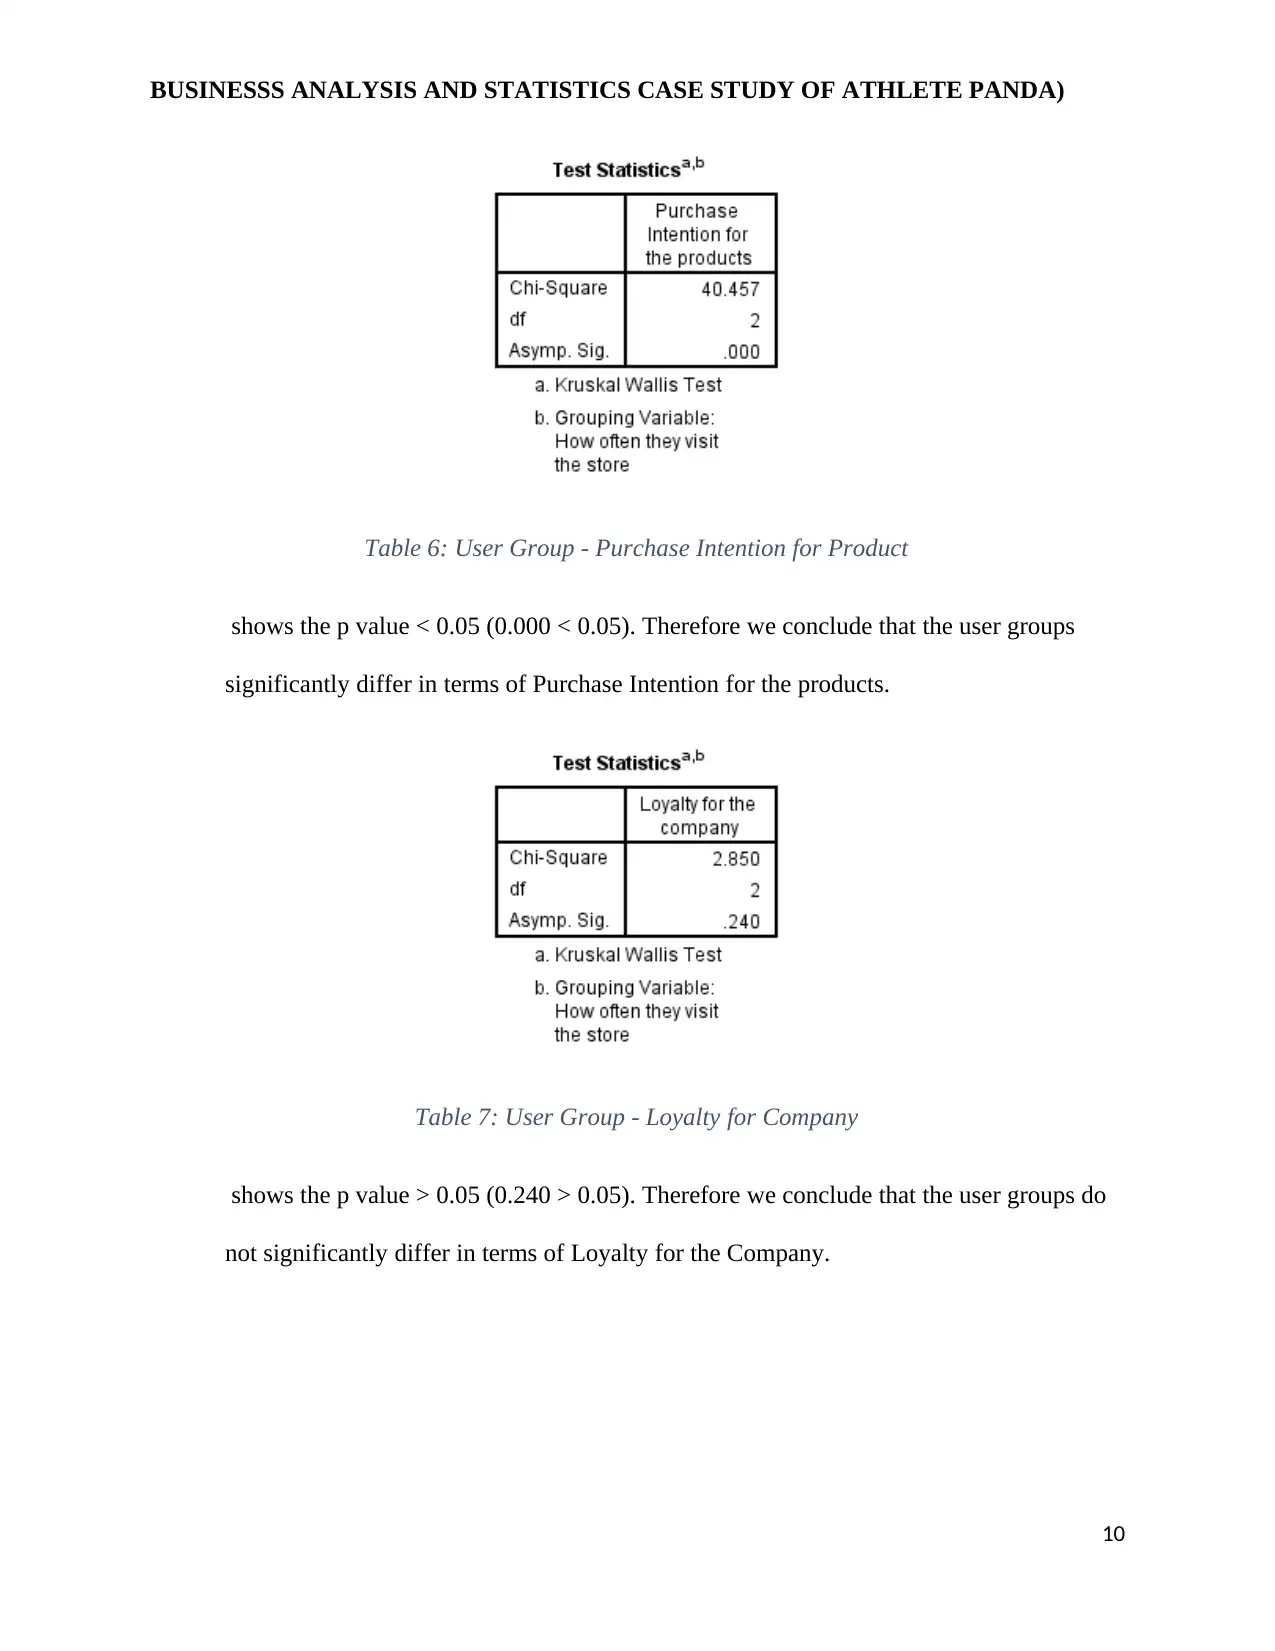
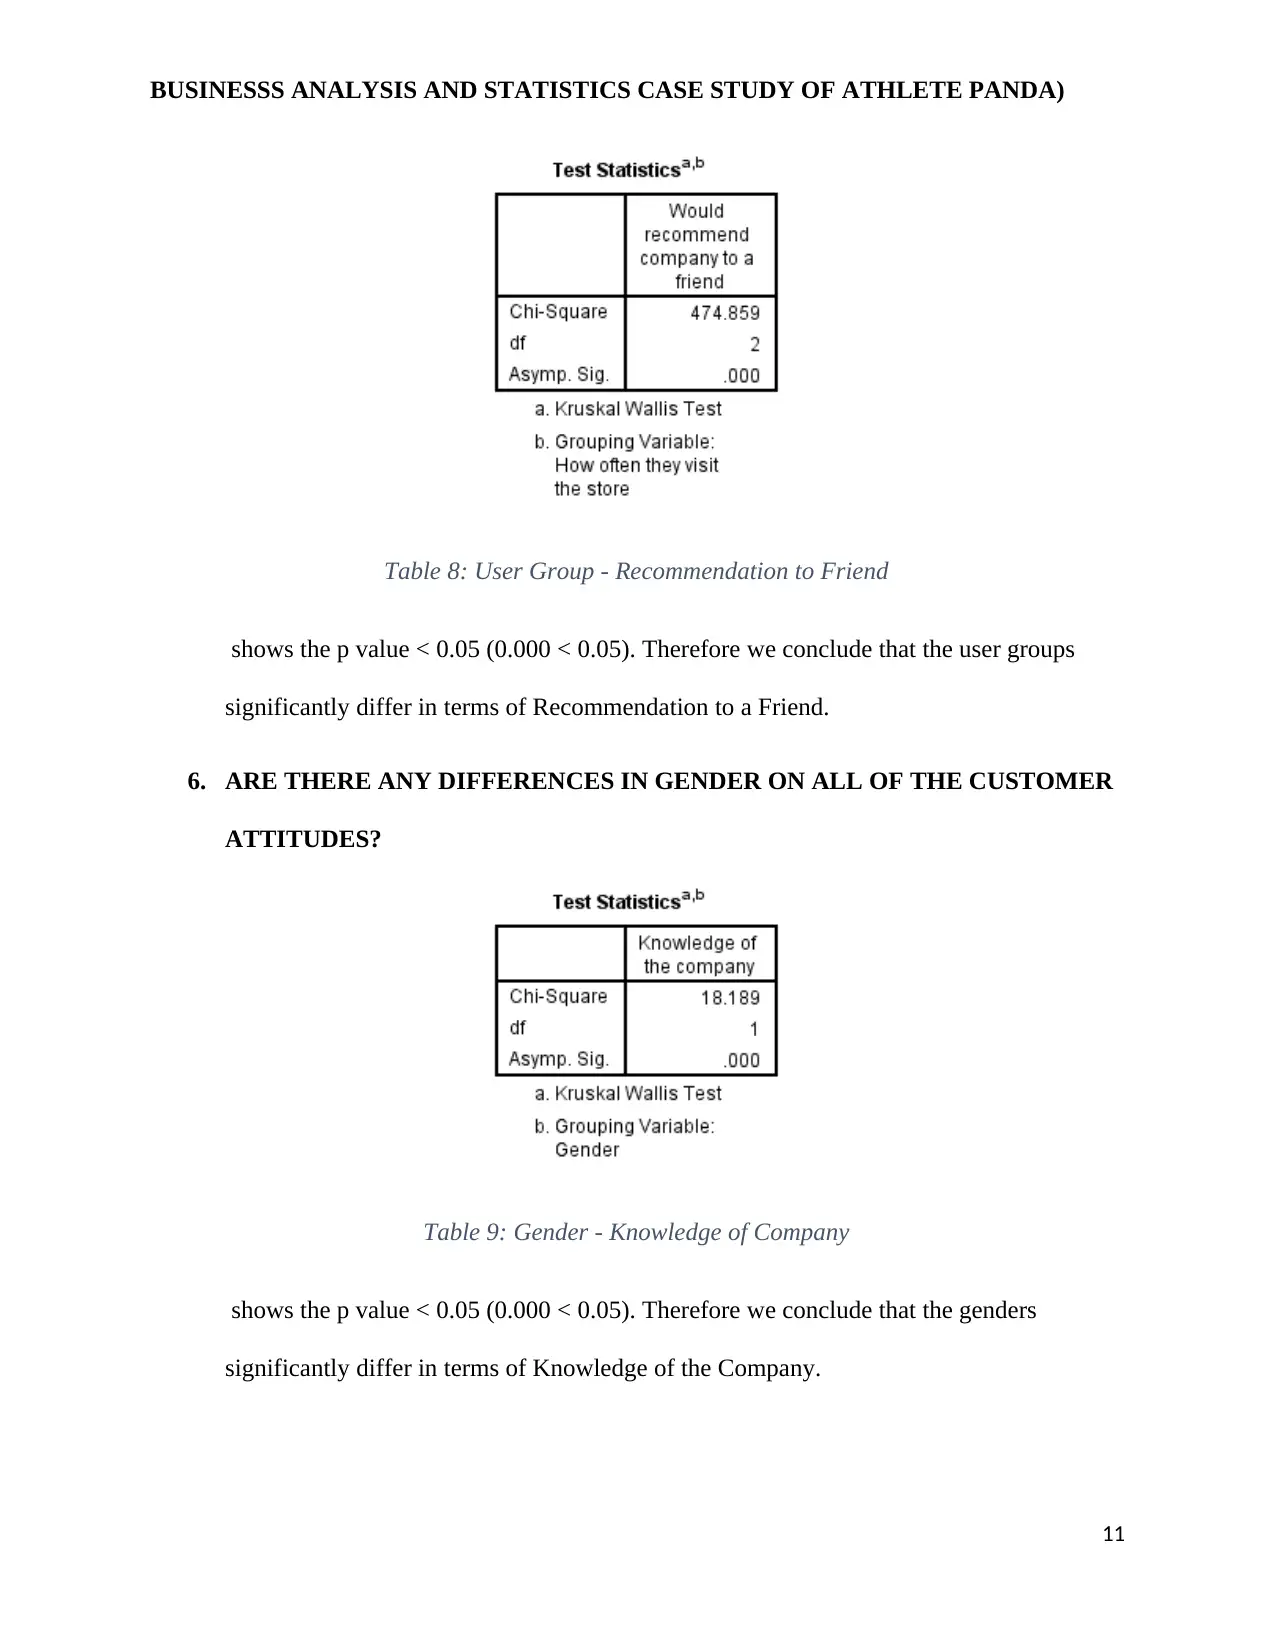
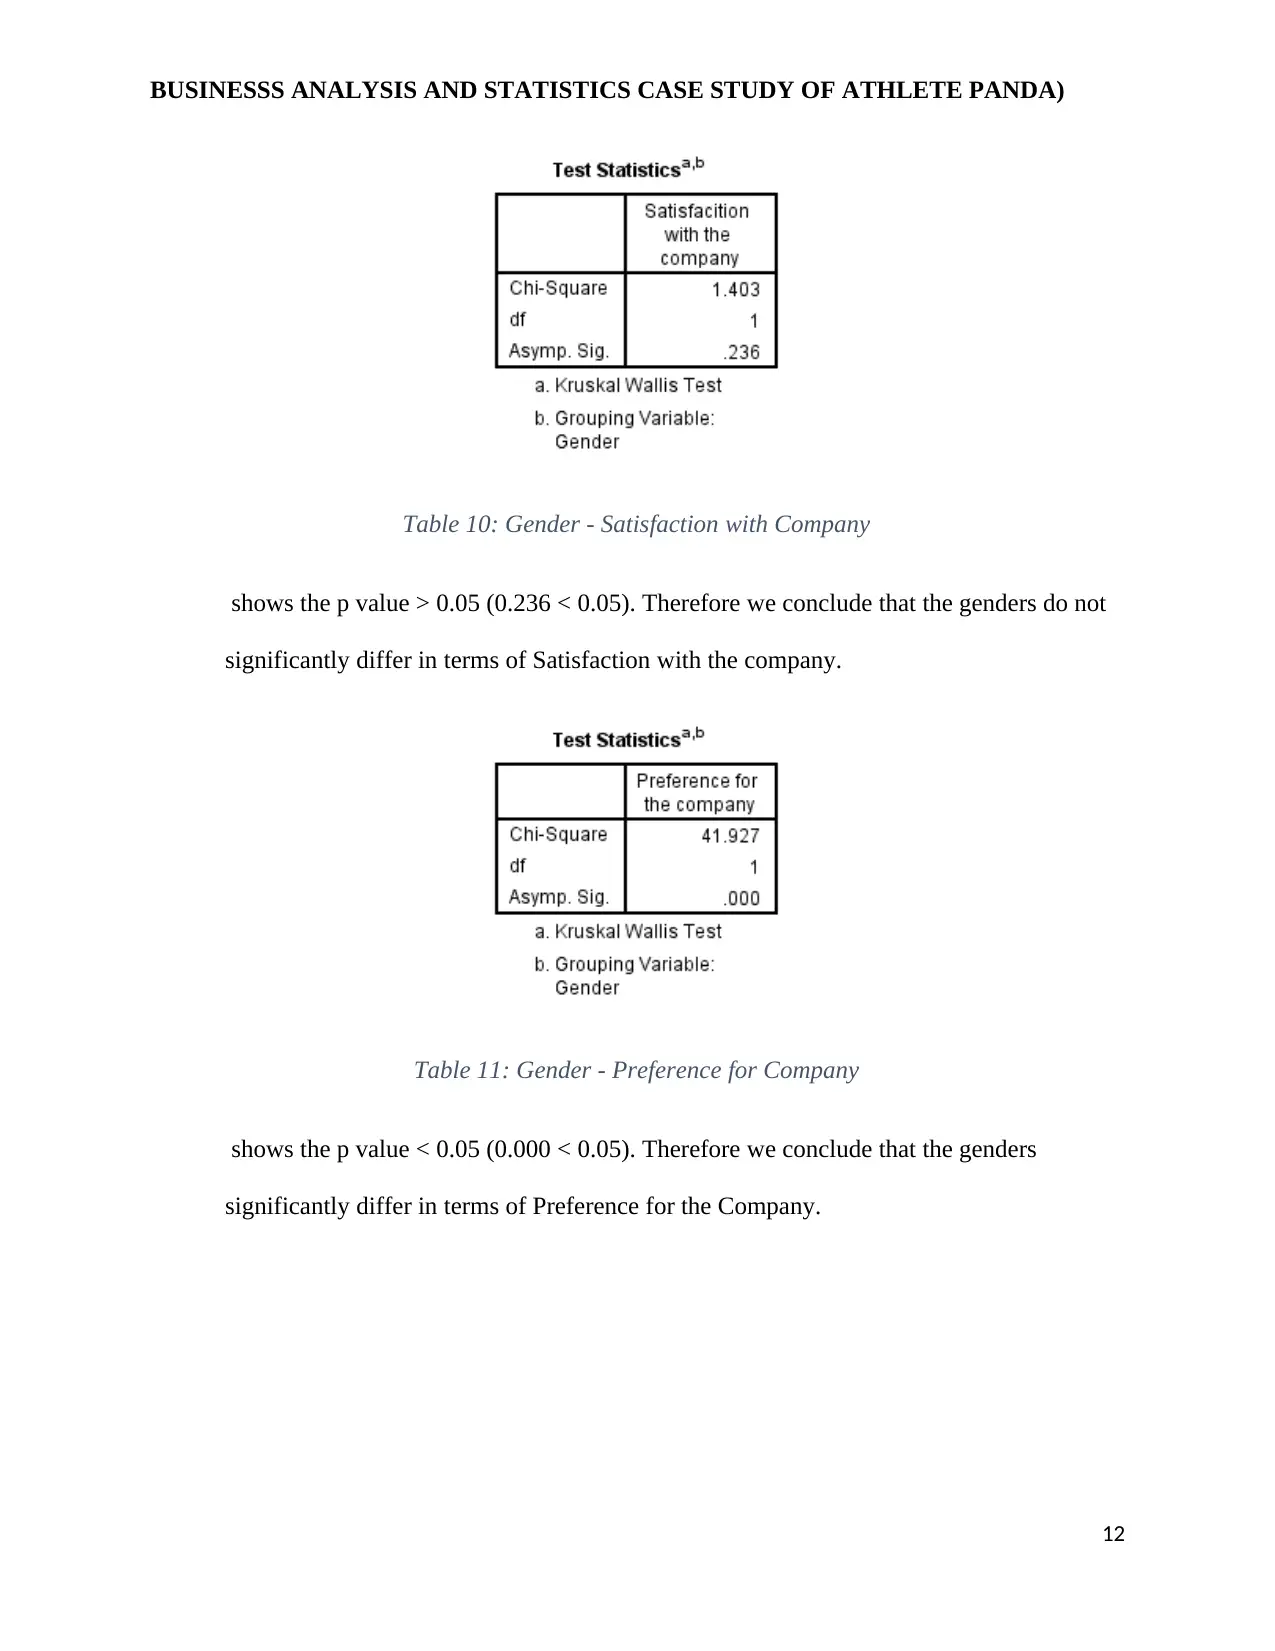
This case study analyzes the business challenges faced by Athlete Panda, a retail store transitioning to online platforms. It investigates key research questions through exploratory data analysis, t-tests, ANOVA, and regression analysis. The study examines profit by product category, cost of goods, payment method differences, store location impact, and customer attitudes across user groups and genders. Results reveal that "Customise" is the most profitable category, and there are significant differences in sales, payment methods, and customer preferences. The study also develops a regression model to predict profit based on sales variables. Recommendations include increasing stock of the "Customise" category and utilizing the regression model for better planning.
Document Page
BUSINESSS ANALYSIS AND STATISTICS CASE STUDY OF ATHLETE PANDA)
Table of Contents
tabler-icon-diamond-filled.svg

Paraphrase This Document

Need a fresh take? Get an instant paraphrase of this document with our AI Paraphraser
Document Page
BUSINESSS ANALYSIS AND STATISTICS CASE STUDY OF ATHLETE PANDA)
INTRODUCTION...........................................................................................................................2
PROBLEM DEFINITION AND BUSINESS INTELLIGENCE REQUIRED..............................4
RESULTS OF THE SELECTED ANALYTICS METHODS AND TECHNICAL ANALYSIS. .6
DISCUSSION OF THE RESULTS AND RECOMMENDATIONS...........................................18
REFERENCES..............................................................................................................................19
APPENDIX....................................................................................................................................21
INTRODUCTION
The rapid developments in technology and the rise of online stores has proven to be a huge
challenge for traditional-based and conventional retail brands globally (Ireland, et al., 2008). The
2
Document Page
BUSINESSS ANALYSIS AND STATISTICS CASE STUDY OF ATHLETE PANDA)
large percentage of customers presently are youthful, trendy and more often too busy or occupied
to physically visit a store to make a purchase. The change in customer demographics implies that
online shopping is the most suitable for this market base (Hsiao, 2009).
Many of the traditional-based retail brands have however been too slow to switch to online
stores. This has given opportunity for new market entries that have filled the void in the online
stores unoccupied by the traditional-based retailers (Laudon & Guercio, 2014).
In addition to the developments in technology and rise of online stores, the market has also
changed in other ways. The ease in the access to information has also meant that the modern
customer is far too dynamic compared to previous periods in the early 2000s going back (Tang,
2014).
A ripple effect of having dynamic consumers in the market has been the risk of fall in demand.
The customers may prefer a product now only to change preference after a while (Pappas, 2016).
This is especially risky for a store that stocks luxury products, the cost of the goods could be
crippling to the business if the demand for the goods fall drastically.
This business report aims at investigating the problems faced by retail store brands are in the
process of transitioning to the online platforms. The study will cite the case of Athlete Panda
which is a brand of retail stores that deal in products for athletes. The retailer has been
operational for the past five years but has been mostly brick and mortar stores only recently
venturing into the provision of online purchase services. The study will focus on identifying the
challenges faced by Athlete Panda by observing and analyzing data from one of the brand’s retail
stores.
3
Document Page
BUSINESSS ANALYSIS AND STATISTICS CASE STUDY OF ATHLETE PANDA)
PROBLEM DEFINITION AND BUSINESS INTELLIGENCE REQUIRED
Athlete Panda being a traditional-based and conventional business entity, it is faced with
challenges in terms of sales, profits and the cost of goods.
RESEARCH QUESTIONS
This study will be concerned with addressing the following research questions for this business
report:
1. Which product categories are making the most profit?
This business report is going to apply the exploratory data analysis to address this
research question. The exploratory data analysis applies the use of graphs and tables to
display the characteristics of a dataset (Martinez, et al., 2010; Roles, et al., 2016).
2. Which product category costs the most?
To address this research question we will also apply the exploratory data analysis. The
exploratory data analysis being a data visualization technique (Theus & Urbanek, 2008),
will help into displaying the different costs for the different product categories.
3. Is there difference in payment methods?
To determine whether there is difference in the payment methods, we will apply the
paired t-test method. The paired t-test method is a statistical technique that is used for
hypothesis testing (Barbara & Susan, 2014; Hastie, et al., 2009).
4. Is there difference in store location and sales?
To evaluate the existence of difference in store location and sales, we will apply the one-
way ANOVA analysis. The one-way ANOVA is a statistical tool that is applied when
comparison is being made between an independent variables that is categorical in nature,
4
tabler-icon-diamond-filled.svg

Paraphrase This Document

Need a fresh take? Get an instant paraphrase of this document with our AI Paraphraser
Document Page
BUSINESSS ANALYSIS AND STATISTICS CASE STUDY OF ATHLETE PANDA)
and a dependent variable that is measured on the interval scale and is normally
distributed (Everitt & Skrondal, 2010; O'Neil & Schutt, 2013).
5. Are there any differences in the user groups on all of the customer attitudes?
In addressing this research question, we will apply the Kruskal Wallis Test. The Kruskal
Wallis Test is a form of the ANOVA test in non-parametric statistics. This test compares
variables in the case where the independent variable is nominal and the dependent
variable is measured either on the interval scale or the ordinal scale (Corder & Foreman,
2009).
6. Are there any differences in gender on all of the customer attitudes?
In evaluating this research question, we will also apply the Kruskal Wallis Test. The
Kruskal Wallis Test is a form of the ANOVA test in non-parametric statistics. This test
compares variables in the case where the independent variable is nominal and the
dependent variable is measured either on the interval scale or the ordinal scale (Corder &
Foreman, 2009).
7. What is the relationship between profit total and other sales variables for Athlete
Panda retail stores?
For this research question, in the study we will apply multiple regression analysis.
Regression analysis is a statistical technique that describes the relationship between
variables in the form of an equation (Claeskens & Hjort, 2008; Freedman, 2009; Galit, et
al., 2018).
5
Document Page
BUSINESSS ANALYSIS AND STATISTICS CASE STUDY OF ATHLETE PANDA)
RESULTS OF THE SELECTED ANALYTICS METHODS AND TECHNICAL ANALYSIS
1. WHICH PRODUCT CATEGORIES ARE MAKING THE MOST PROFIT?
Figure 1: Product Category - Profit Total
Figure 1: Product Category - Profit Total above shows a plot of the product category
against the average total profit for all the categories. From this plot we observe that the
product category making the most profit is customise.
2. WHICH PRODUCT CATEGORY COSTS THE MOST?
6
Document Page
BUSINESSS ANALYSIS AND STATISTICS CASE STUDY OF ATHLETE PANDA)
Figure 2: Product Category - Cost of Goods
Figure 2: Product Category - Cost of Goods above shows a plot of the product category
against the average cost of goods for all the categories. From this plot we observe that
the product category with the highest cost is customise.
3. IS THERE DIFFERENCE IN PAYMENT METHODS?
Table 1: T-Test for PayPal and Credit Card Payments
The results in show that the p value < 0.05. We therefore conclude that the payments
through PayPal and those through Credit Card are statistically different from each other.
7
tabler-icon-diamond-filled.svg

Paraphrase This Document

Need a fresh take? Get an instant paraphrase of this document with our AI Paraphraser
Document Page
BUSINESSS ANALYSIS AND STATISTICS CASE STUDY OF ATHLETE PANDA)
4. IS THERE DIFFERENCE IN STORE LOCATION AND SALES?
Table 2: ANOVA for Location of Stores and Sales
The results in above show that the p value < 0.05. We therefore conclude that the sales
in the different locations differ.
5. ARE THERE ANY DIFFERENCES IN THE USER GROUPS ON ALL OF THE
CUSTOMER ATTITUDES?
Table 3: User Group - Knowledge of Company
shows the p value < 0.05 (0.000 < 0.05). Therefore we conclude that the user groups
significantly differ in terms of Knowledge of the Company.
8
Document Page
BUSINESSS ANALYSIS AND STATISTICS CASE STUDY OF ATHLETE PANDA)
Table 4: User Group - Satisfaction with Company
shows the p value < 0.05 (0.000 < 0.05). Therefore we conclude that the user groups
significantly differ in terms of Satisfaction with the company.
Table 5: User Group - Preference for Company
shows the p value < 0.05 (0.000 < 0.05). Therefore we conclude that the user groups
significantly differ in terms of Preference for the Company.
9
Document Page
BUSINESSS ANALYSIS AND STATISTICS CASE STUDY OF ATHLETE PANDA)
Table 6: User Group - Purchase Intention for Product
shows the p value < 0.05 (0.000 < 0.05). Therefore we conclude that the user groups
significantly differ in terms of Purchase Intention for the products.
Table 7: User Group - Loyalty for Company
shows the p value > 0.05 (0.240 > 0.05). Therefore we conclude that the user groups do
not significantly differ in terms of Loyalty for the Company.
10
tabler-icon-diamond-filled.svg

Paraphrase This Document

Need a fresh take? Get an instant paraphrase of this document with our AI Paraphraser
Document Page
BUSINESSS ANALYSIS AND STATISTICS CASE STUDY OF ATHLETE PANDA)
Table 8: User Group - Recommendation to Friend
shows the p value < 0.05 (0.000 < 0.05). Therefore we conclude that the user groups
significantly differ in terms of Recommendation to a Friend.
6. ARE THERE ANY DIFFERENCES IN GENDER ON ALL OF THE CUSTOMER
ATTITUDES?
Table 9: Gender - Knowledge of Company
shows the p value < 0.05 (0.000 < 0.05). Therefore we conclude that the genders
significantly differ in terms of Knowledge of the Company.
11
Document Page
BUSINESSS ANALYSIS AND STATISTICS CASE STUDY OF ATHLETE PANDA)
Table 10: Gender - Satisfaction with Company
shows the p value > 0.05 (0.236 < 0.05). Therefore we conclude that the genders do not
significantly differ in terms of Satisfaction with the company.
Table 11: Gender - Preference for Company
shows the p value < 0.05 (0.000 < 0.05). Therefore we conclude that the genders
significantly differ in terms of Preference for the Company.
12
chevron_up_icon
1 out of 24
circle_padding
hide_on_mobile
zoom_out_icon