Business Decision Making Report: Analysis of Balti Palace Performance
VerifiedAdded on 2020/02/05
|20
|4138
|42
Report
AI Summary
This report provides a comprehensive analysis of business decision-making processes, focusing on a case study involving Balti Palace. It begins with an introduction to the role of business and the influence of external markets. The report covers the creation of data collection plans, including primary and secondary data methods, survey methodologies, and questionnaire design. It delves into data analysis, using representative values, measures of dispersion, and correlation coefficients to draw conclusions. The report also includes the production of graphs and trend lines using spreadsheets, along with a business presentation and formal report preparation. Furthermore, it explores the use of information tools, project planning (including critical path analysis), and financial tools for decision-making, such as NPV and IRR, to assess project feasibility. The report concludes with a summary of findings and provides references.

BUSINESS DECISION
MAKING
MAKING
Paraphrase This Document
Need a fresh take? Get an instant paraphrase of this document with our AI Paraphraser
Table of Contents
INTRODUCTION...........................................................................................................................3
TASK 1............................................................................................................................................4
1.1 Create a plan for the collection of primary and secondary data for a given business
problem........................................................................................................................................4
1.2 Present the survey methodology and sampling frame...........................................................4
1.3 Design a questionnaire for a given business problem............................................................5
TASK 2............................................................................................................................................7
2.1 create information for decision making by summarizing data using representative values. .7
2.2 Analyze the results to draw valid conclusions in a business context.....................................8
2.3 Analyse data using measures of dispersion to inform a given business scenario..................8
2.4 Explain how Quartile, percentiles and the correlation coefficient are used..........................9
TASK 3..........................................................................................................................................10
3.1 Produce graphs using spreadsheets......................................................................................10
3.2 Create trend lines in spreadsheet graphs to assist in forecasting.........................................13
3.3 Prepare a business presentation...........................................................................................13
3.4 Produce a formal business report.........................................................................................13
TASK 4..........................................................................................................................................14
4.1 Use of information tools......................................................................................................14
4.2 Prepare a project plan for an activity and determine the critical path.................................15
4.3 Use financial tools for decision making..............................................................................16
CONCLUSION..............................................................................................................................18
REFERENCES..............................................................................................................................20
INTRODUCTION
Role of business has increases with the influence of external market on the business
which enhances its overall skills and the capabilities. Balti palace has been selected by an entity
in order to use various decision making tools to enhance the current skills and the capabilities of
an entity in order to make important decisions business. This project is all about creating data
collection plan which helps in organizing a research study in order to help an entity owner to
collect important facts and figures to accomplish desired aims and the objectives within a given
time frame. This project report also emphasis on using appropriate sampling method that helps in
collecting important facts and figures in order to achieve the desired aims and the objectives
within a given time frame. The reliability of the collected information will be based on the
method used by an individual so it is important to select appropriate among which gives right
direction to an individual. Sample size will be adopted to facilitate the researcher in order to
collect important facts related to the current aim of the overall research project report.
Questionnaires are used to circulate among various individuals to take their consent about the
consumer's satisfaction an entity gains by delivering all its products or services to all the
consumers of the Balti palace. This report is all about using statistical measures like mean,
median and mode in order to test the reliability of the information that may affect the overall
business performance of an entity in order to grab higher market opportunities located in the
external market. Graphs and charts are used to present al the information about the business in
order to take important action in the business as it is essential for an entity in order to gab higher
market advantage by offering variety of services to is variety of users located in the external
business environment. Different use of information technologies used in the business in
improving various business functions of the business in an enterprise using important tools and
techniques. The project will be managed using appropriate project management tool by
determining critical path analysis and Gantt charts. Capital budgeting tool is used to analyze the
feasibility and viability of all the projects taken into consideration such as NPV and IRR.
⊘ This is a preview!⊘
Do you want full access?
Subscribe today to unlock all pages.
Trusted by 1+ million students worldwide
TASK 1
1.1 Create a plan for the collection of primary and secondary data for a given business problem
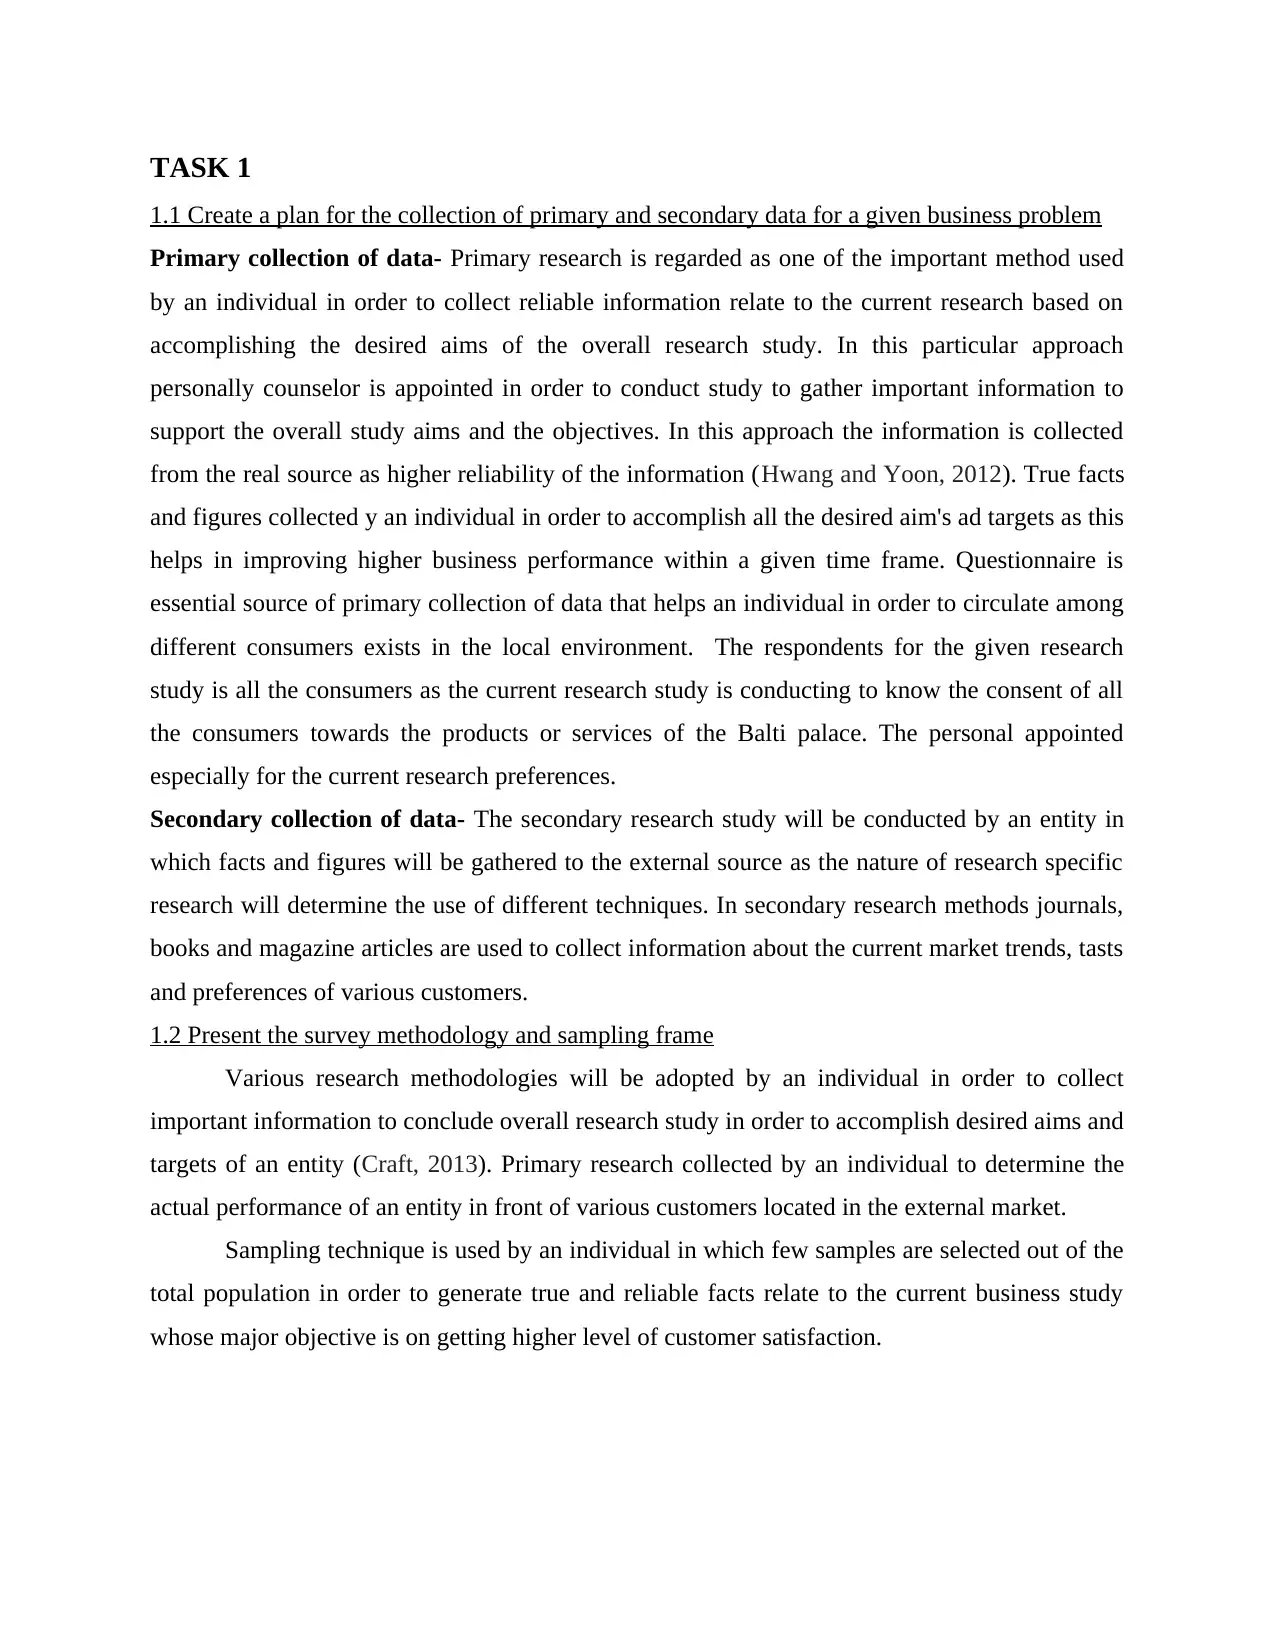
Primary collection of data- Primary research is regarded as one of the important method used
by an individual in order to collect reliable information relate to the current research based on
accomplishing the desired aims of the overall research study. In this particular approach
personally counselor is appointed in order to conduct study to gather important information to
support the overall study aims and the objectives. In this approach the information is collected
from the real source as higher reliability of the information (Hwang and Yoon, 2012). True facts
and figures collected y an individual in order to accomplish all the desired aim's ad targets as this
helps in improving higher business performance within a given time frame. Questionnaire is
essential source of primary collection of data that helps an individual in order to circulate among
different consumers exists in the local environment. The respondents for the given research
study is all the consumers as the current research study is conducting to know the consent of all
the consumers towards the products or services of the Balti palace. The personal appointed
especially for the current research preferences.
Secondary collection of data- The secondary research study will be conducted by an entity in
which facts and figures will be gathered to the external source as the nature of research specific
research will determine the use of different techniques. In secondary research methods journals,
books and magazine articles are used to collect information about the current market trends, tasts
and preferences of various customers.
1.2 Present the survey methodology and sampling frame
Various research methodologies will be adopted by an individual in order to collect
important information to conclude overall research study in order to accomplish desired aims and
targets of an entity (Craft, 2013). Primary research collected by an individual to determine the
actual performance of an entity in front of various customers located in the external market.
Sampling technique is used by an individual in which few samples are selected out of the
total population in order to generate true and reliable facts relate to the current business study
whose major objective is on getting higher level of customer satisfaction.
1.1 Create a plan for the collection of primary and secondary data for a given business problem
Primary collection of data- Primary research is regarded as one of the important method used
by an individual in order to collect reliable information relate to the current research based on
accomplishing the desired aims of the overall research study. In this particular approach
personally counselor is appointed in order to conduct study to gather important information to
support the overall study aims and the objectives. In this approach the information is collected
from the real source as higher reliability of the information (Hwang and Yoon, 2012). True facts
and figures collected y an individual in order to accomplish all the desired aim's ad targets as this
helps in improving higher business performance within a given time frame. Questionnaire is
essential source of primary collection of data that helps an individual in order to circulate among
different consumers exists in the local environment. The respondents for the given research
study is all the consumers as the current research study is conducting to know the consent of all
the consumers towards the products or services of the Balti palace. The personal appointed
especially for the current research preferences.
Secondary collection of data- The secondary research study will be conducted by an entity in
which facts and figures will be gathered to the external source as the nature of research specific
research will determine the use of different techniques. In secondary research methods journals,
books and magazine articles are used to collect information about the current market trends, tasts
and preferences of various customers.
1.2 Present the survey methodology and sampling frame
Various research methodologies will be adopted by an individual in order to collect
important information to conclude overall research study in order to accomplish desired aims and
targets of an entity (Craft, 2013). Primary research collected by an individual to determine the
actual performance of an entity in front of various customers located in the external market.
Sampling technique is used by an individual in which few samples are selected out of the
total population in order to generate true and reliable facts relate to the current business study
whose major objective is on getting higher level of customer satisfaction.
Paraphrase This Document
Need a fresh take? Get an instant paraphrase of this document with our AI Paraphraser
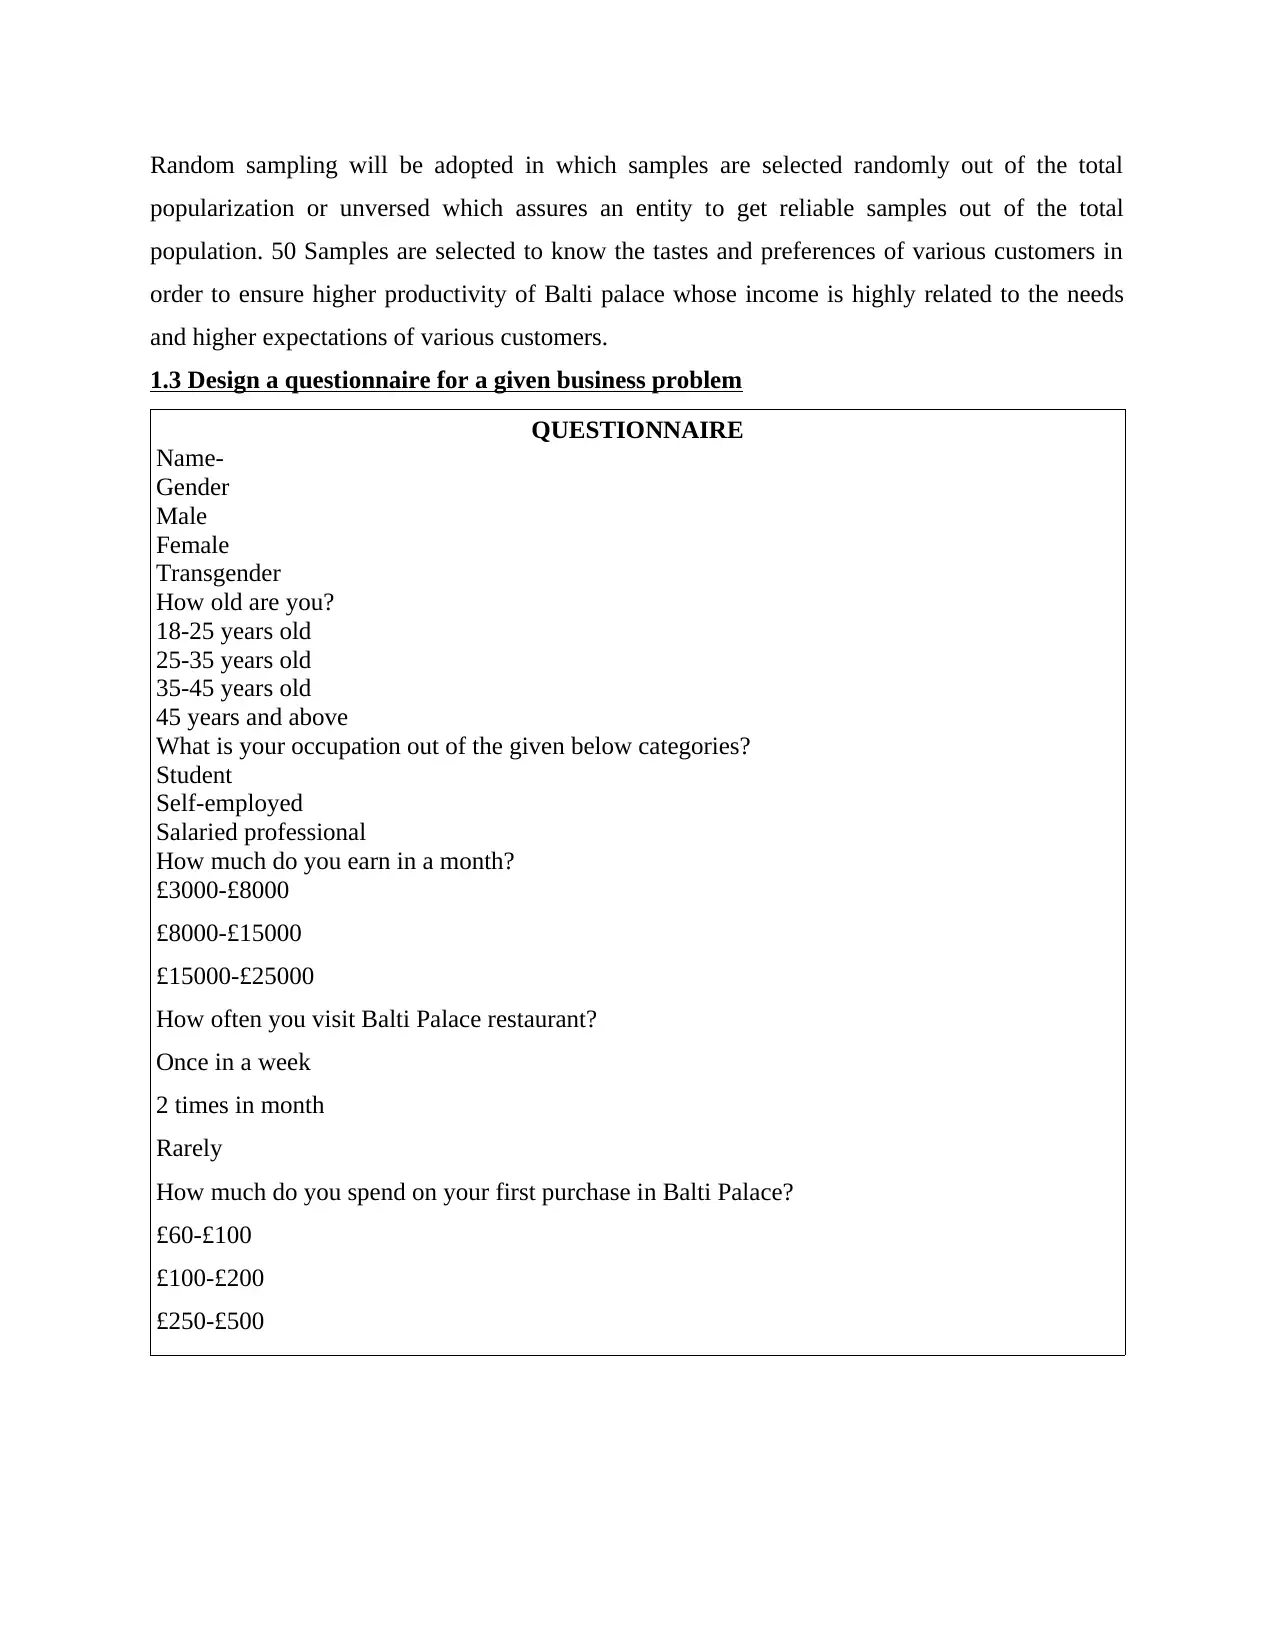
Random sampling will be adopted in which samples are selected randomly out of the total
popularization or unversed which assures an entity to get reliable samples out of the total
population. 50 Samples are selected to know the tastes and preferences of various customers in
order to ensure higher productivity of Balti palace whose income is highly related to the needs
and higher expectations of various customers.
1.3 Design a questionnaire for a given business problem
QUESTIONNAIRE
Name-
Gender
Male
Female
Transgender
How old are you?
18-25 years old
25-35 years old
35-45 years old
45 years and above
What is your occupation out of the given below categories?
Student
Self-employed
Salaried professional
How much do you earn in a month?
£3000-£8000
£8000-£15000
£15000-£25000
How often you visit Balti Palace restaurant?
Once in a week
2 times in month
Rarely
How much do you spend on your first purchase in Balti Palace?
£60-£100
£100-£200
£250-£500
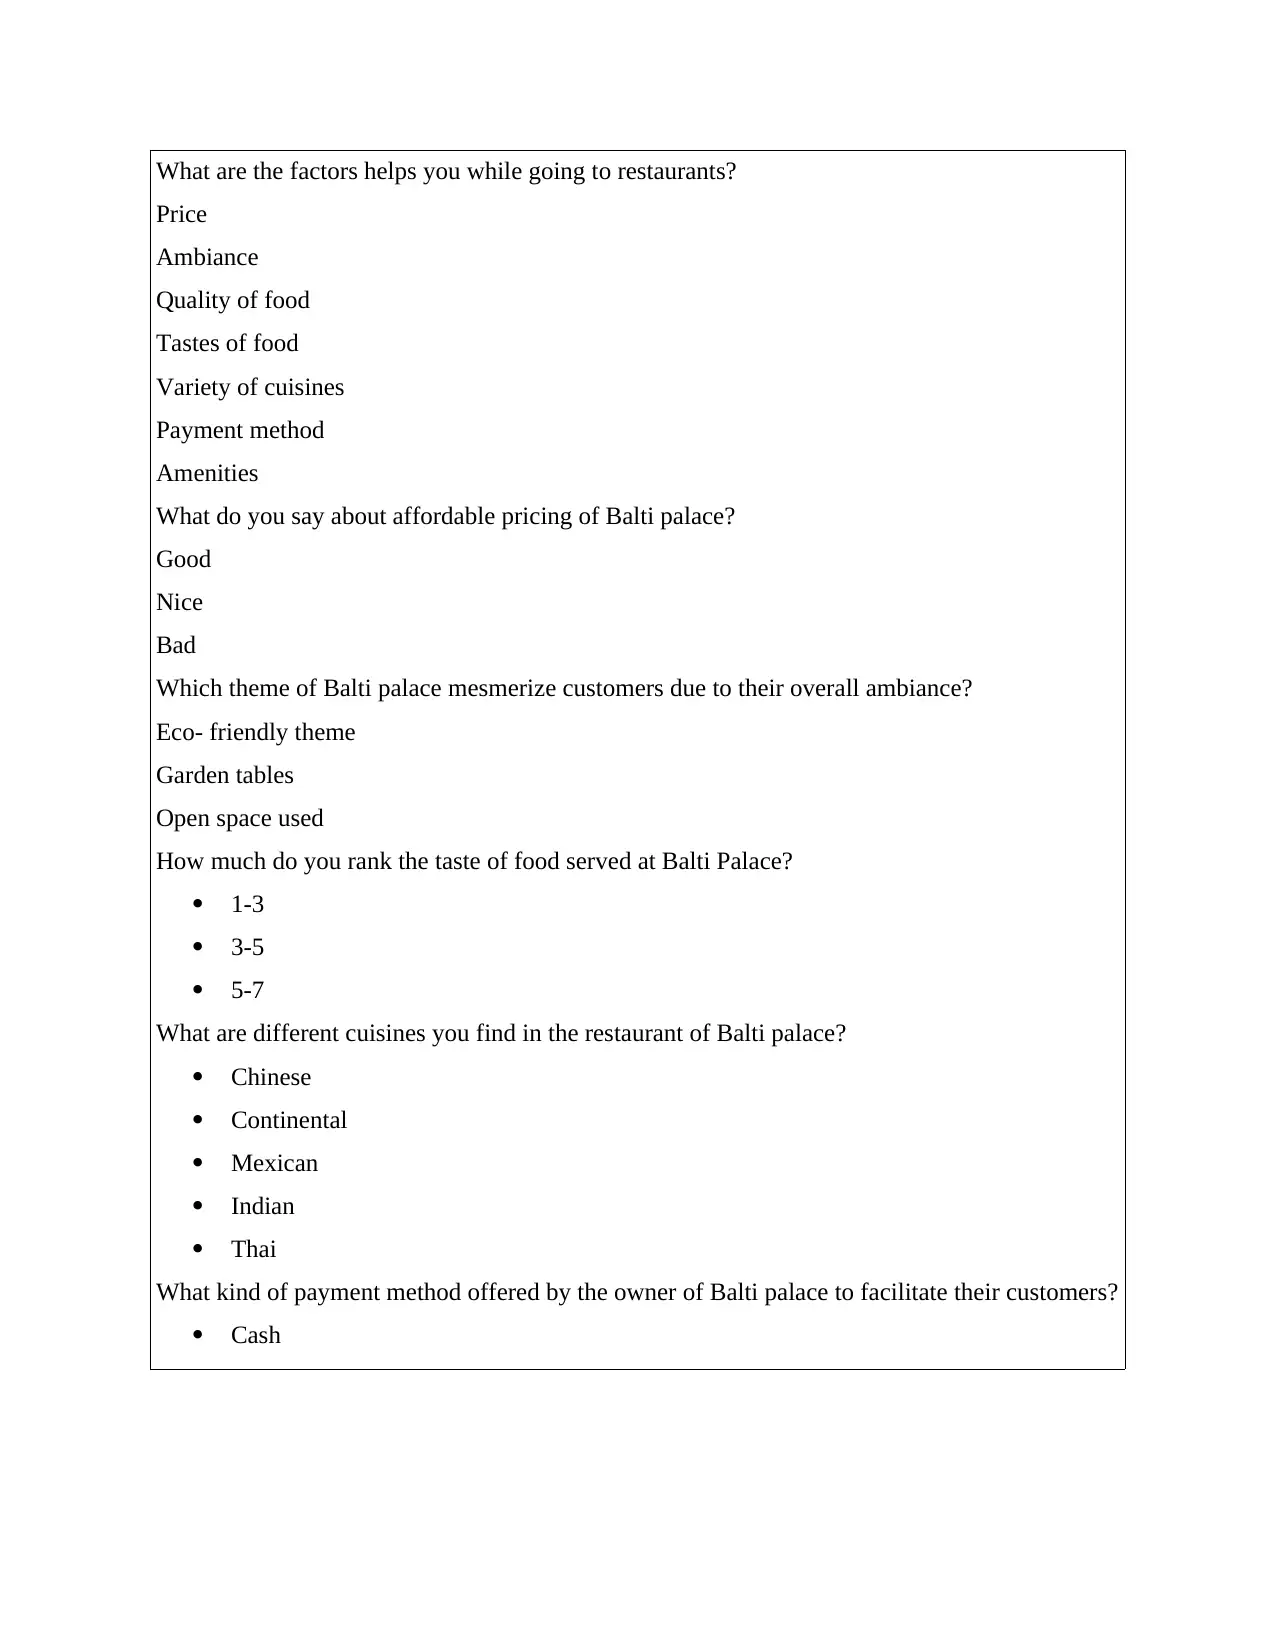
What are the factors helps you while going to restaurants?
Price
Ambiance
Quality of food
Tastes of food
Variety of cuisines
Payment method
Amenities
What do you say about affordable pricing of Balti palace?
Good
Nice
Bad
Which theme of Balti palace mesmerize customers due to their overall ambiance?
Eco- friendly theme
Garden tables
Open space used
How much do you rank the taste of food served at Balti Palace?
1-3
3-5
5-7
What are different cuisines you find in the restaurant of Balti palace?
Chinese
Continental
Mexican
Indian
Thai
What kind of payment method offered by the owner of Balti palace to facilitate their customers?
Cash
⊘ This is a preview!⊘
Do you want full access?
Subscribe today to unlock all pages.
Trusted by 1+ million students worldwide
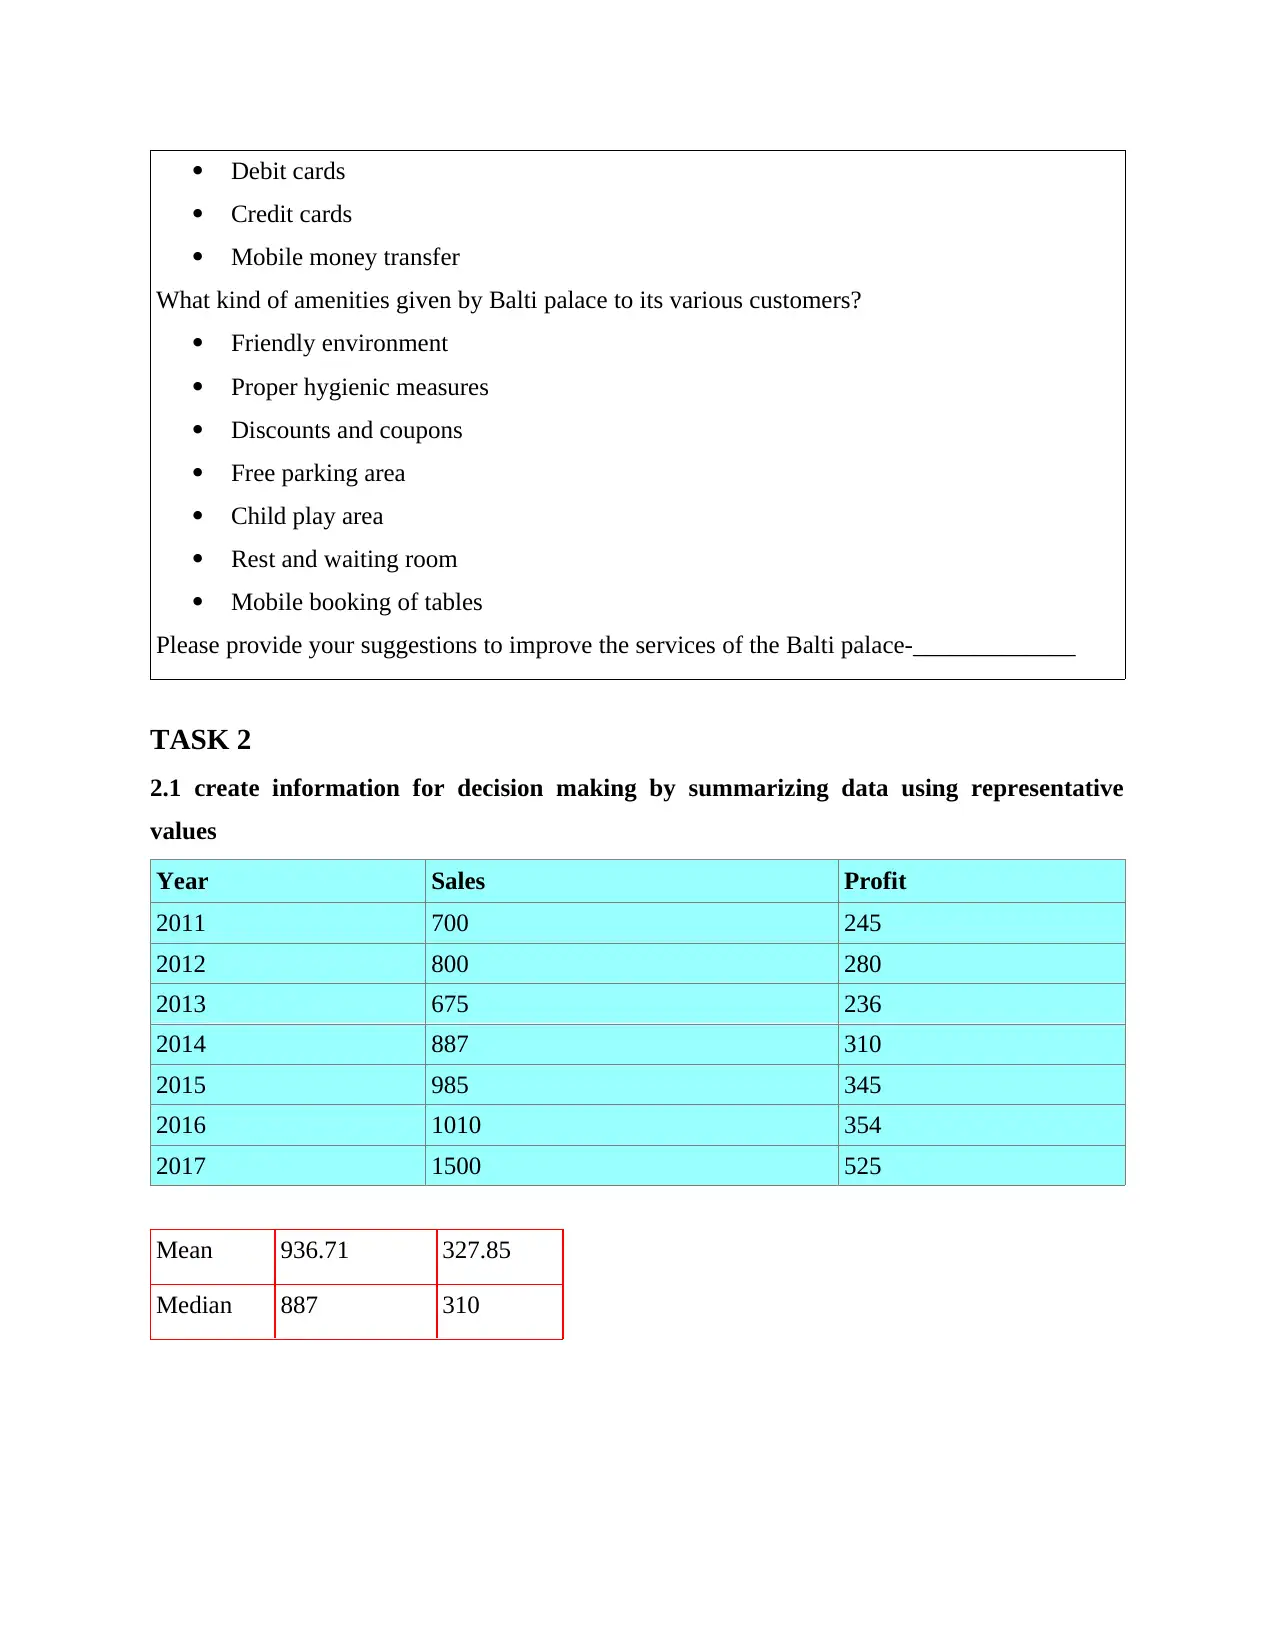
Debit cards
Credit cards
Mobile money transfer
What kind of amenities given by Balti palace to its various customers?
Friendly environment
Proper hygienic measures
Discounts and coupons
Free parking area
Child play area
Rest and waiting room
Mobile booking of tables
Please provide your suggestions to improve the services of the Balti palace-_____________
TASK 2
2.1 create information for decision making by summarizing data using representative
values
Year Sales Profit
2011 700 245
2012 800 280
2013 675 236
2014 887 310
2015 985 345
2016 1010 354
2017 1500 525
Mean 936.71 327.85
Median 887 310
Paraphrase This Document
Need a fresh take? Get an instant paraphrase of this document with our AI Paraphraser
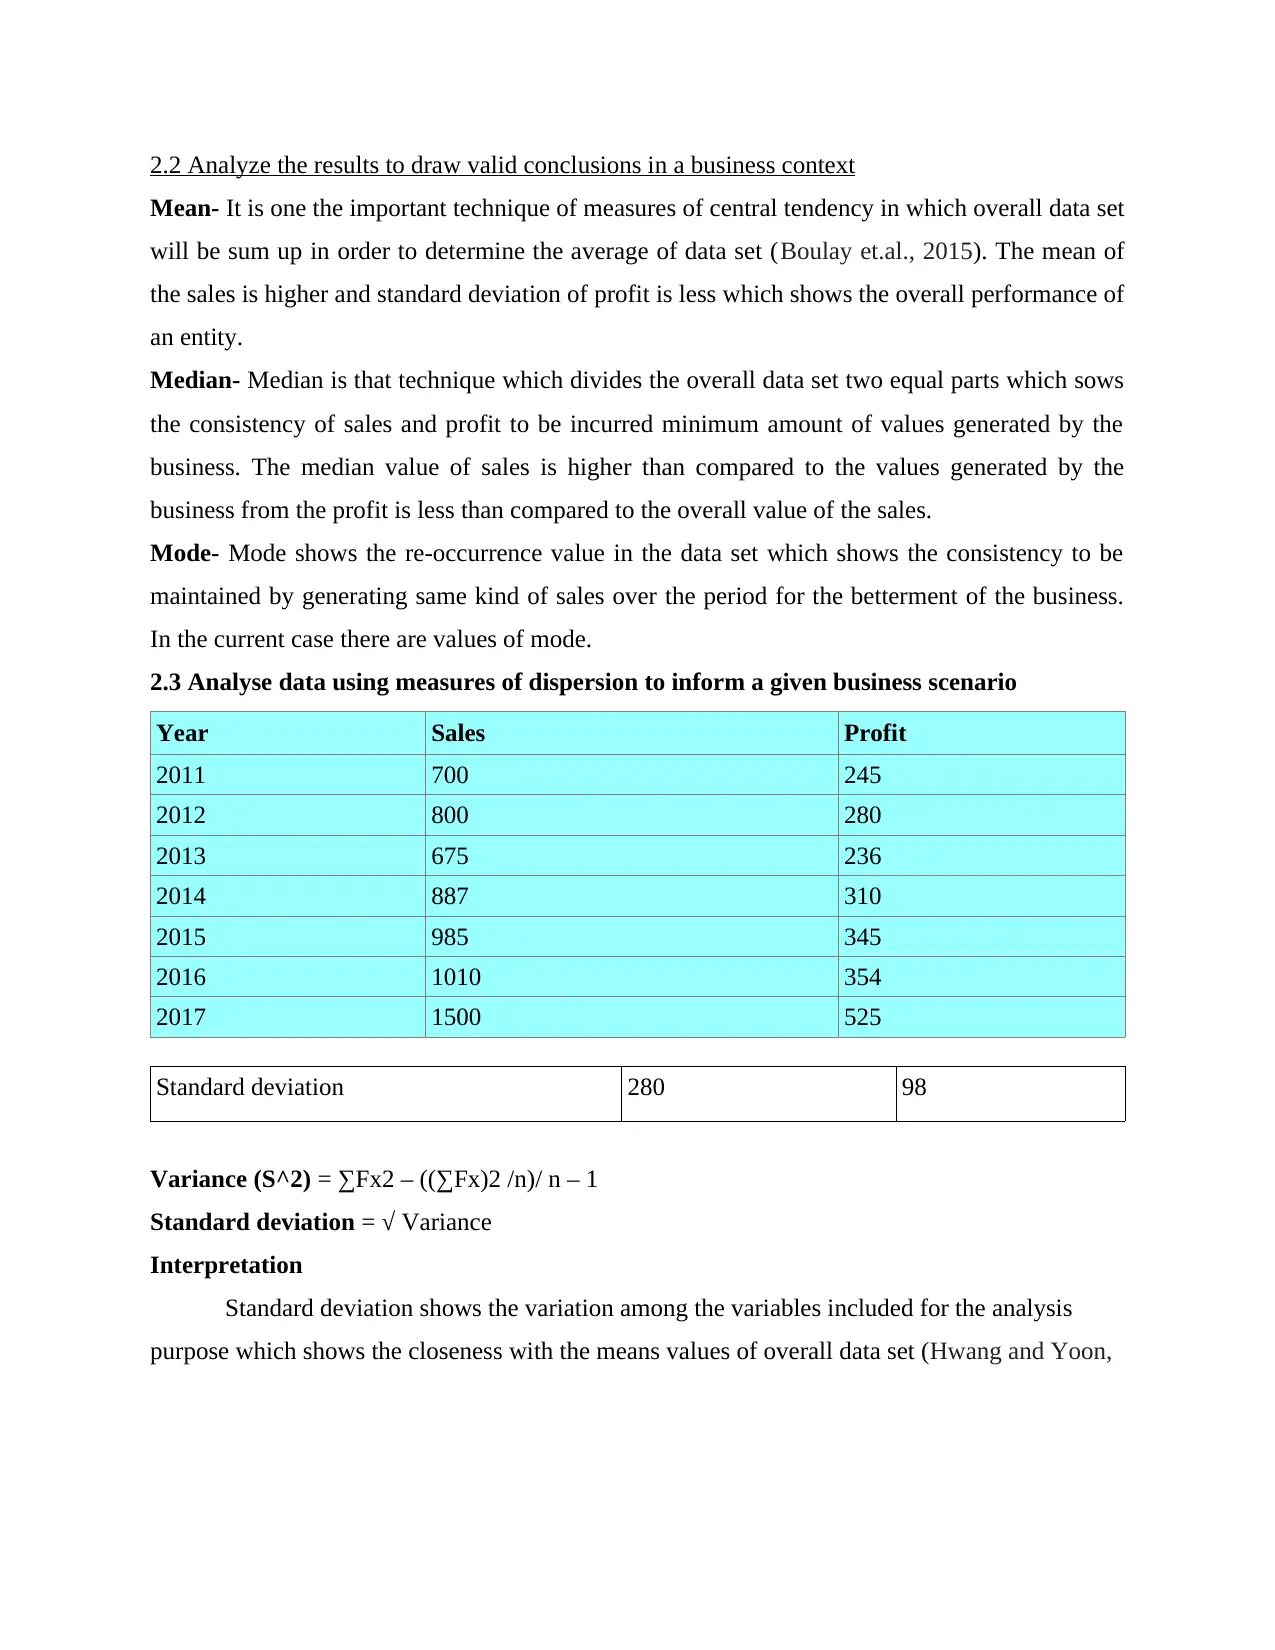
2.2 Analyze the results to draw valid conclusions in a business context
Mean- It is one the important technique of measures of central tendency in which overall data set
will be sum up in order to determine the average of data set (Boulay et.al., 2015). The mean of
the sales is higher and standard deviation of profit is less which shows the overall performance of
an entity.
Median- Median is that technique which divides the overall data set two equal parts which sows
the consistency of sales and profit to be incurred minimum amount of values generated by the
business. The median value of sales is higher than compared to the values generated by the
business from the profit is less than compared to the overall value of the sales.
Mode- Mode shows the re-occurrence value in the data set which shows the consistency to be
maintained by generating same kind of sales over the period for the betterment of the business.
In the current case there are values of mode.
2.3 Analyse data using measures of dispersion to inform a given business scenario
Year Sales Profit
2011 700 245
2012 800 280
2013 675 236
2014 887 310
2015 985 345
2016 1010 354
2017 1500 525
Standard deviation 280 98
Variance (S^2) = ∑Fx2 – ((∑Fx)2 /n)/ n – 1
Standard deviation = √ Variance
Interpretation
Standard deviation shows the variation among the variables included for the analysis
purpose which shows the closeness with the means values of overall data set (Hwang and Yoon,
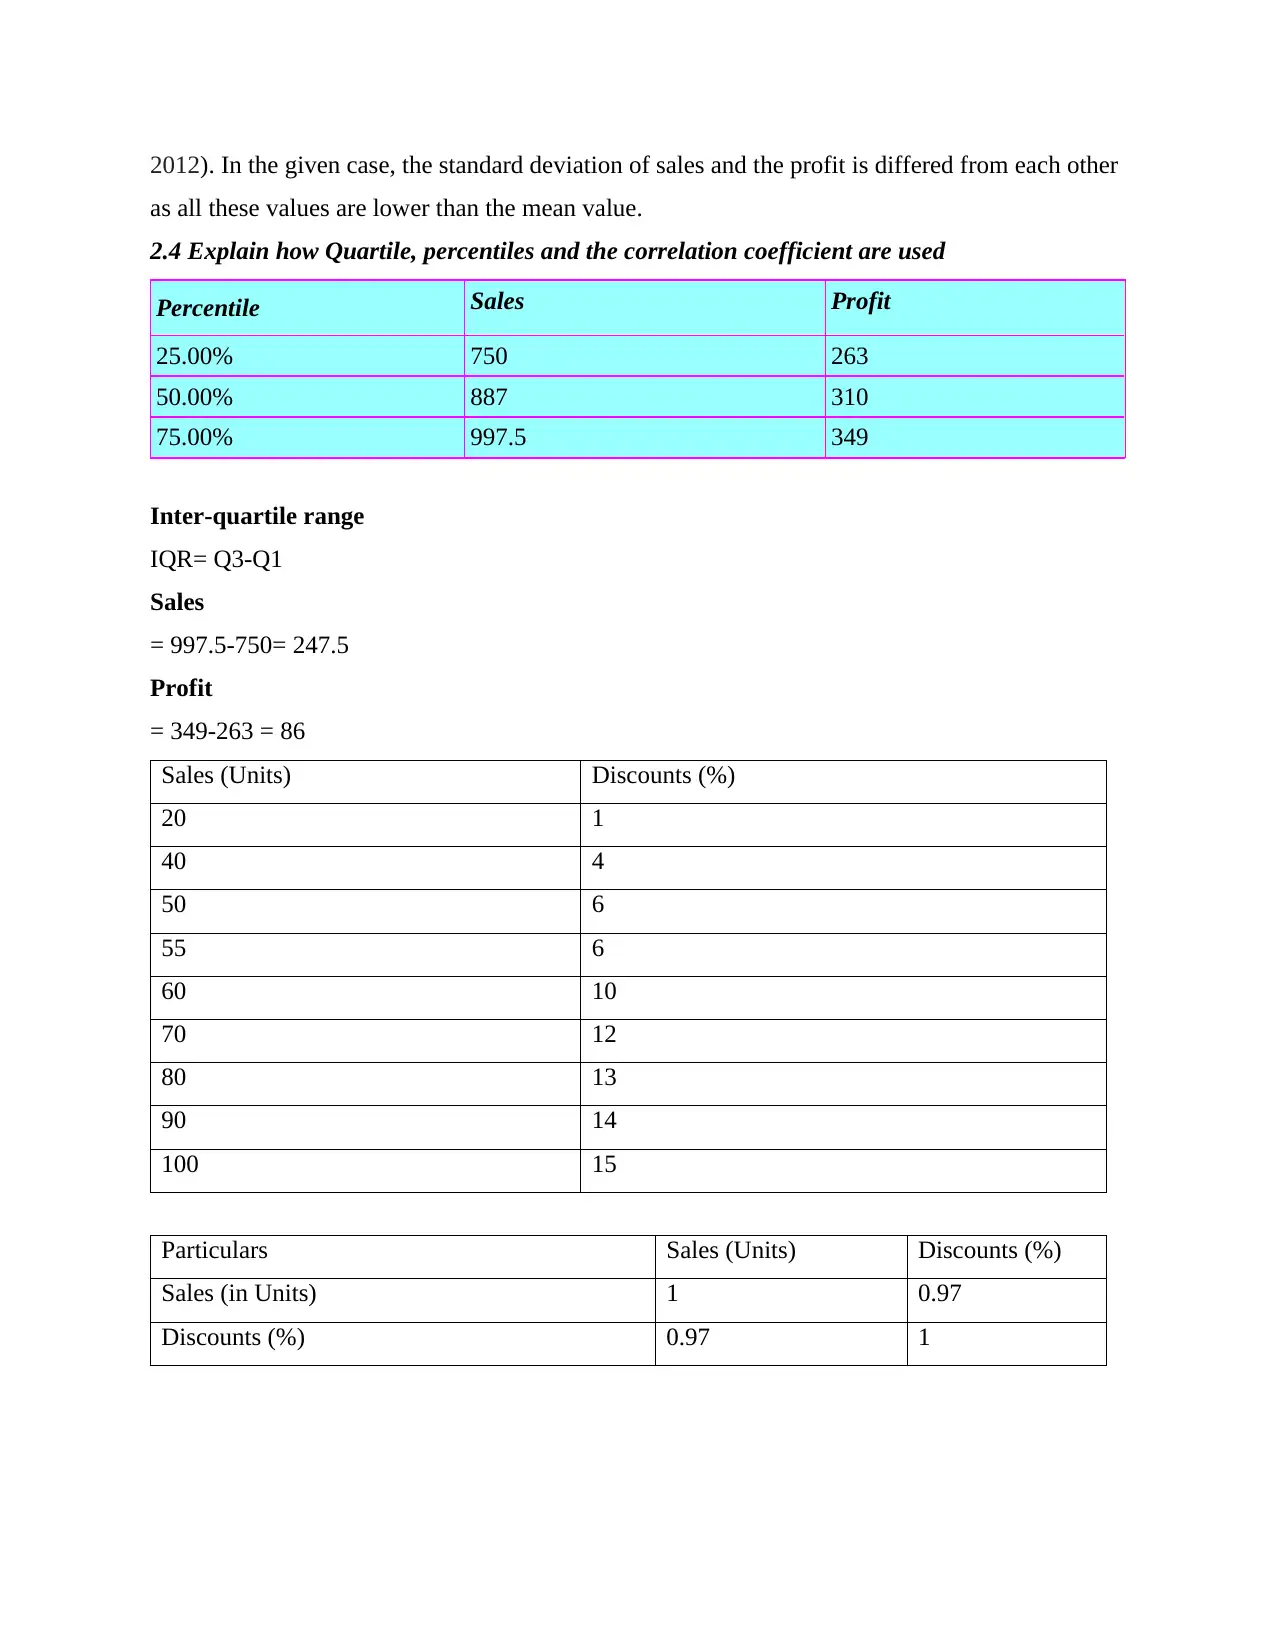
2012). In the given case, the standard deviation of sales and the profit is differed from each other
as all these values are lower than the mean value.
2.4 Explain how Quartile, percentiles and the correlation coefficient are used
Percentile Sales Profit
25.00% 750 263
50.00% 887 310
75.00% 997.5 349
Inter-quartile range
IQR= Q3-Q1
Sales
= 997.5-750= 247.5
Profit
= 349-263 = 86
Sales (Units) Discounts (%)
20 1
40 4
50 6
55 6
60 10
70 12
80 13
90 14
100 15
Particulars Sales (Units) Discounts (%)
Sales (in Units) 1 0.97
Discounts (%) 0.97 1
⊘ This is a preview!⊘
Do you want full access?
Subscribe today to unlock all pages.
Trusted by 1+ million students worldwide
Interpretation
There is Strong relationship between two important variables such as sales and discount
which plays significant role in the business in increasing or decreasing value of sales currently
generated by an entity in a particular period.
TASK 3
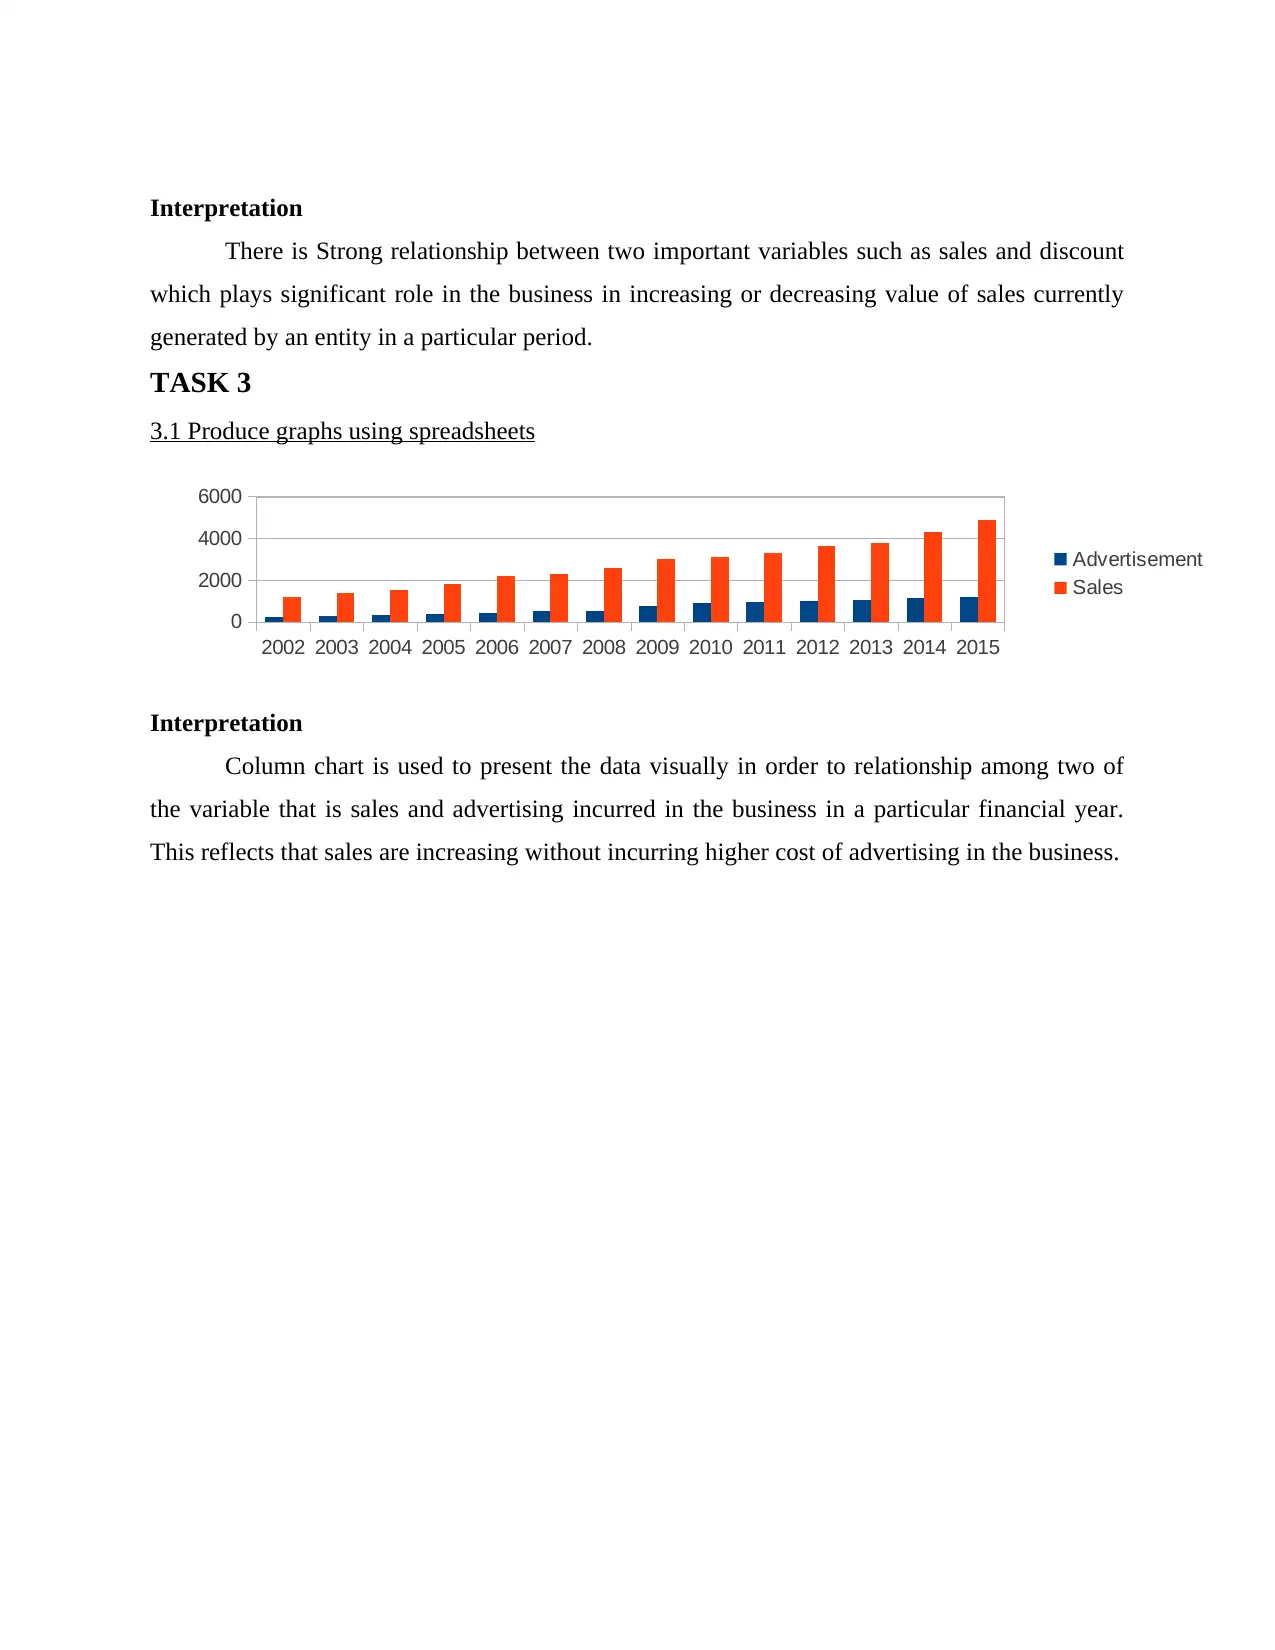
3.1 Produce graphs using spreadsheets
2002 2003 2004 2005 2006 2007 2008 2009 2010 2011 2012 2013 2014 2015
0
2000
4000
6000
Advertisement
Sales
Interpretation
Column chart is used to present the data visually in order to relationship among two of
the variable that is sales and advertising incurred in the business in a particular financial year.
This reflects that sales are increasing without incurring higher cost of advertising in the business.
There is Strong relationship between two important variables such as sales and discount
which plays significant role in the business in increasing or decreasing value of sales currently
generated by an entity in a particular period.
TASK 3
3.1 Produce graphs using spreadsheets
2002 2003 2004 2005 2006 2007 2008 2009 2010 2011 2012 2013 2014 2015
0
2000
4000
6000
Advertisement
Sales
Interpretation
Column chart is used to present the data visually in order to relationship among two of
the variable that is sales and advertising incurred in the business in a particular financial year.
This reflects that sales are increasing without incurring higher cost of advertising in the business.
Paraphrase This Document
Need a fresh take? Get an instant paraphrase of this document with our AI Paraphraser
2002
2003
2004
2005
2006
2007
2008
2009
2010
2011
2012
2013
2014
2015
0 1000 2000 3000 4000 5000 6000
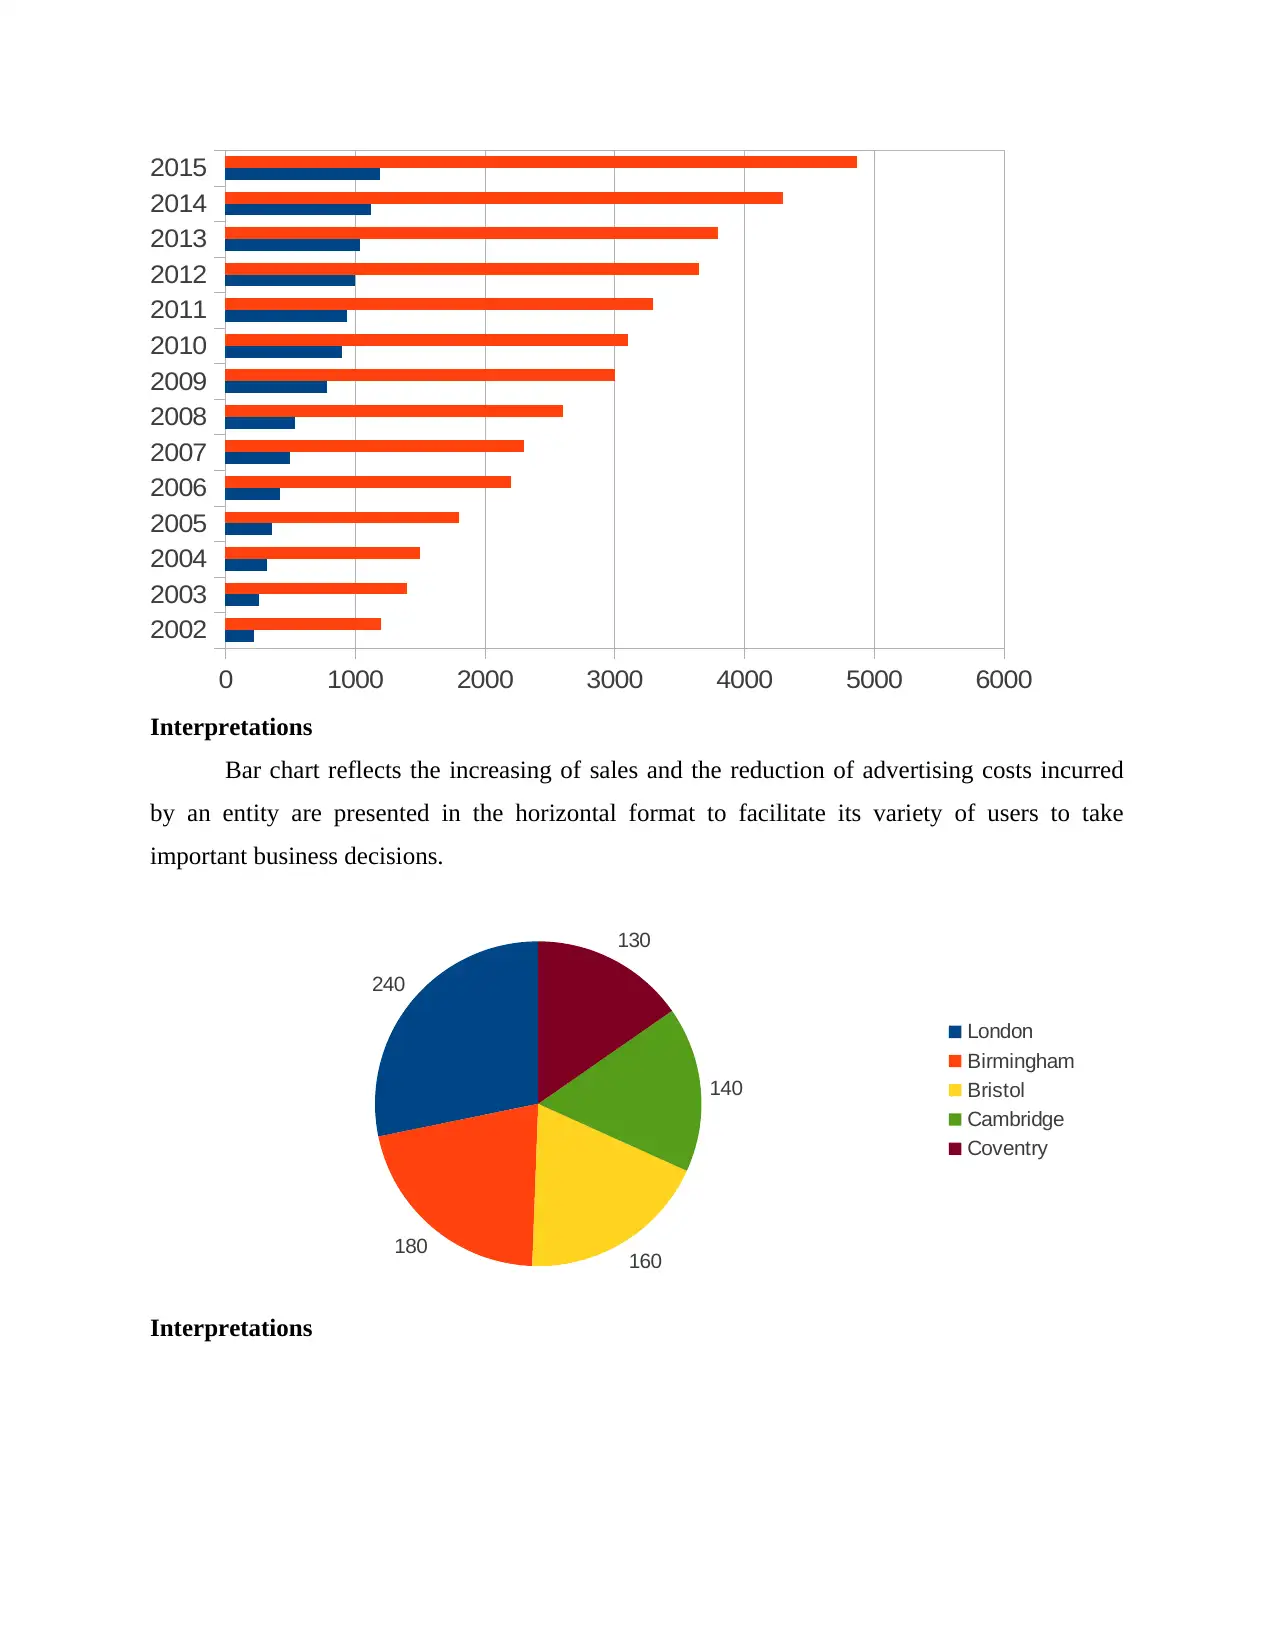
Interpretations
Bar chart reflects the increasing of sales and the reduction of advertising costs incurred
by an entity are presented in the horizontal format to facilitate its variety of users to take
important business decisions.
240
180 160
140
130
London
Birmingham
Bristol
Cambridge
Coventry
Interpretations
2003
2004
2005
2006
2007
2008
2009
2010
2011
2012
2013
2014
2015
0 1000 2000 3000 4000 5000 6000
Interpretations
Bar chart reflects the increasing of sales and the reduction of advertising costs incurred
by an entity are presented in the horizontal format to facilitate its variety of users to take
important business decisions.
240
180 160
140
130
London
Birmingham
Bristol
Cambridge
Coventry
Interpretations
Pie chart reflects the overall branches of Balti palace by showcasing its existing profits to inspire
them to take new investment opportunity in order to achieve desired aims and targets of the
business in a given time frame.
2000 2002 2004 2006 2008 2010 2012 2014 2016
0
1000
2000
3000
4000
5000
6000
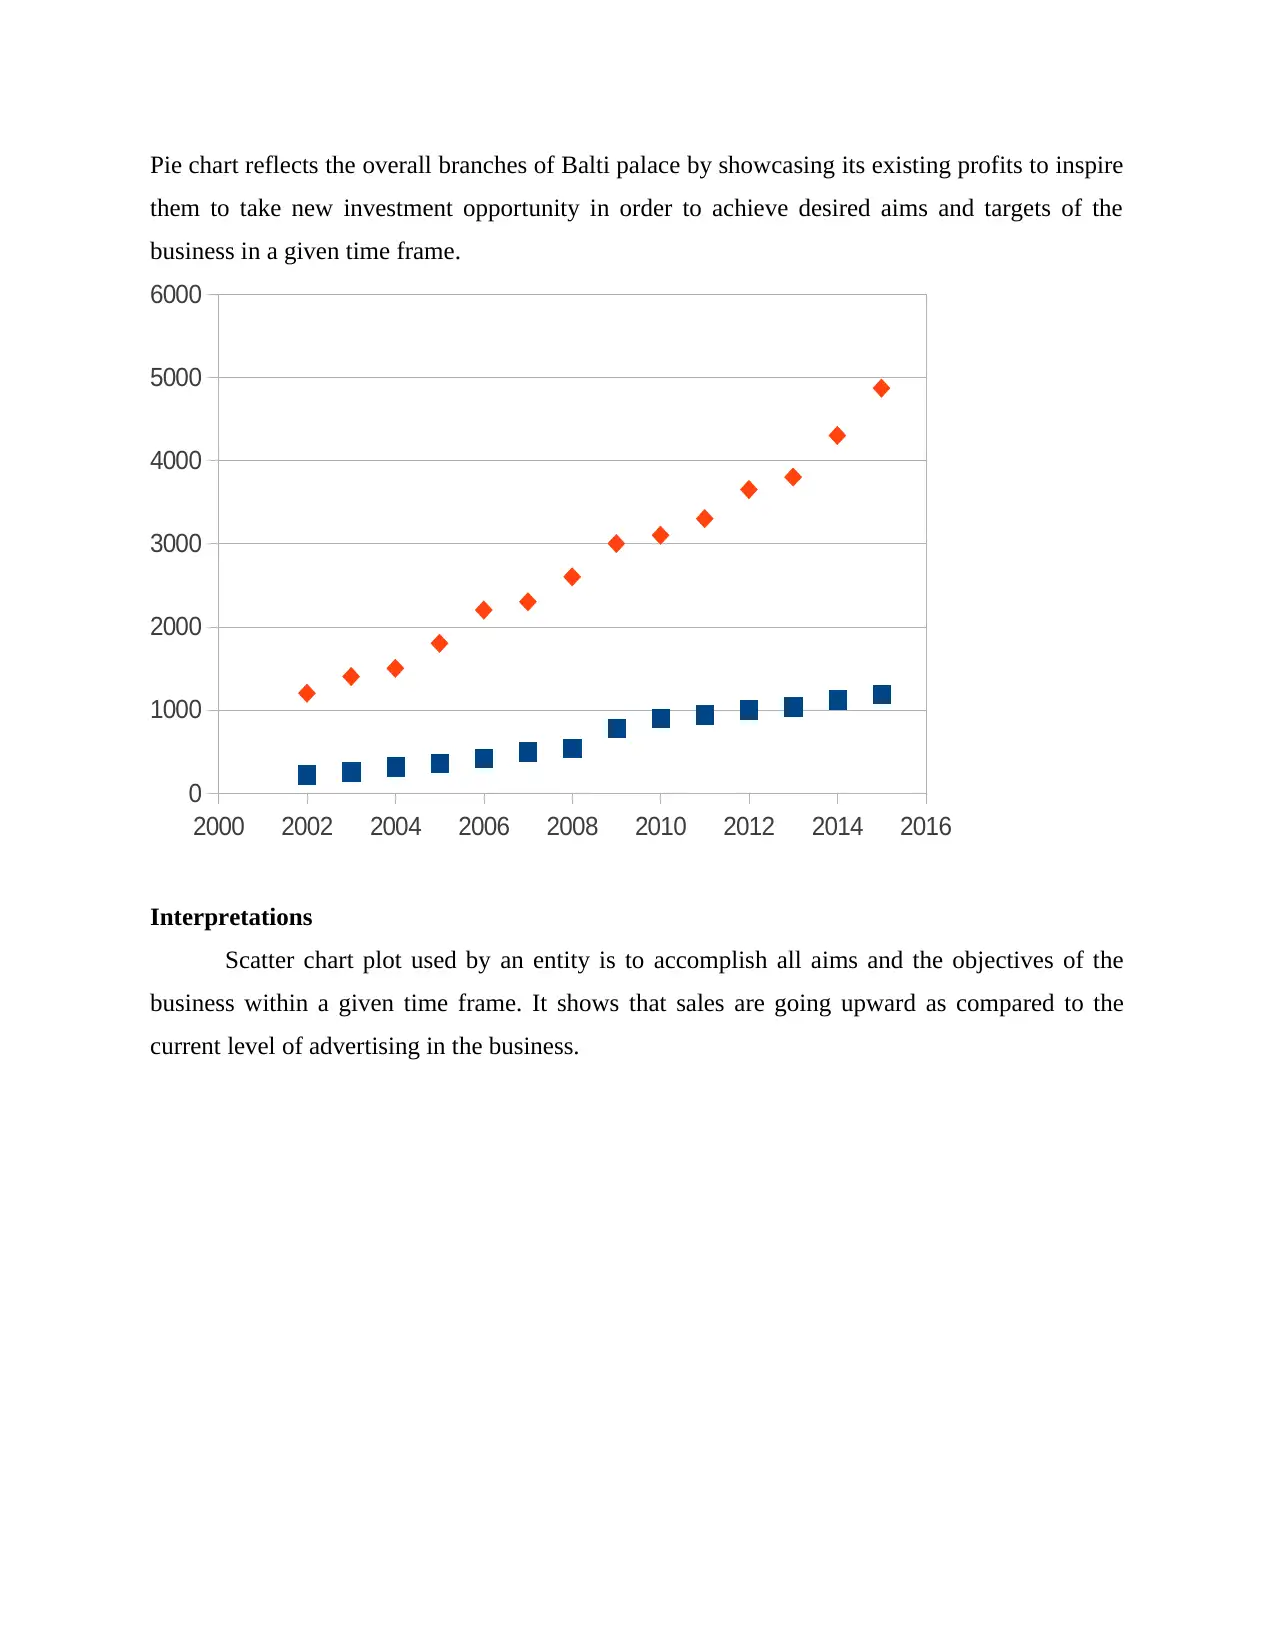
Interpretations
Scatter chart plot used by an entity is to accomplish all aims and the objectives of the
business within a given time frame. It shows that sales are going upward as compared to the
current level of advertising in the business.
them to take new investment opportunity in order to achieve desired aims and targets of the
business in a given time frame.
2000 2002 2004 2006 2008 2010 2012 2014 2016
0
1000
2000
3000
4000
5000
6000
Interpretations
Scatter chart plot used by an entity is to accomplish all aims and the objectives of the
business within a given time frame. It shows that sales are going upward as compared to the
current level of advertising in the business.
⊘ This is a preview!⊘
Do you want full access?
Subscribe today to unlock all pages.
Trusted by 1+ million students worldwide
1 out of 20
Related Documents


Your All-in-One AI-Powered Toolkit for Academic Success.
+13062052269
info@desklib.com
Available 24*7 on WhatsApp / Email
![[object Object]](/_next/static/media/star-bottom.7253800d.svg)
Unlock your academic potential
Copyright © 2020–2026 A2Z Services. All Rights Reserved. Developed and managed by ZUCOL.