NIT3171: Business Insights from Boston Housing Dataset Analysis

Verified

Added on  2022/08/25

|14
|1501
|23
Report
AI Summary
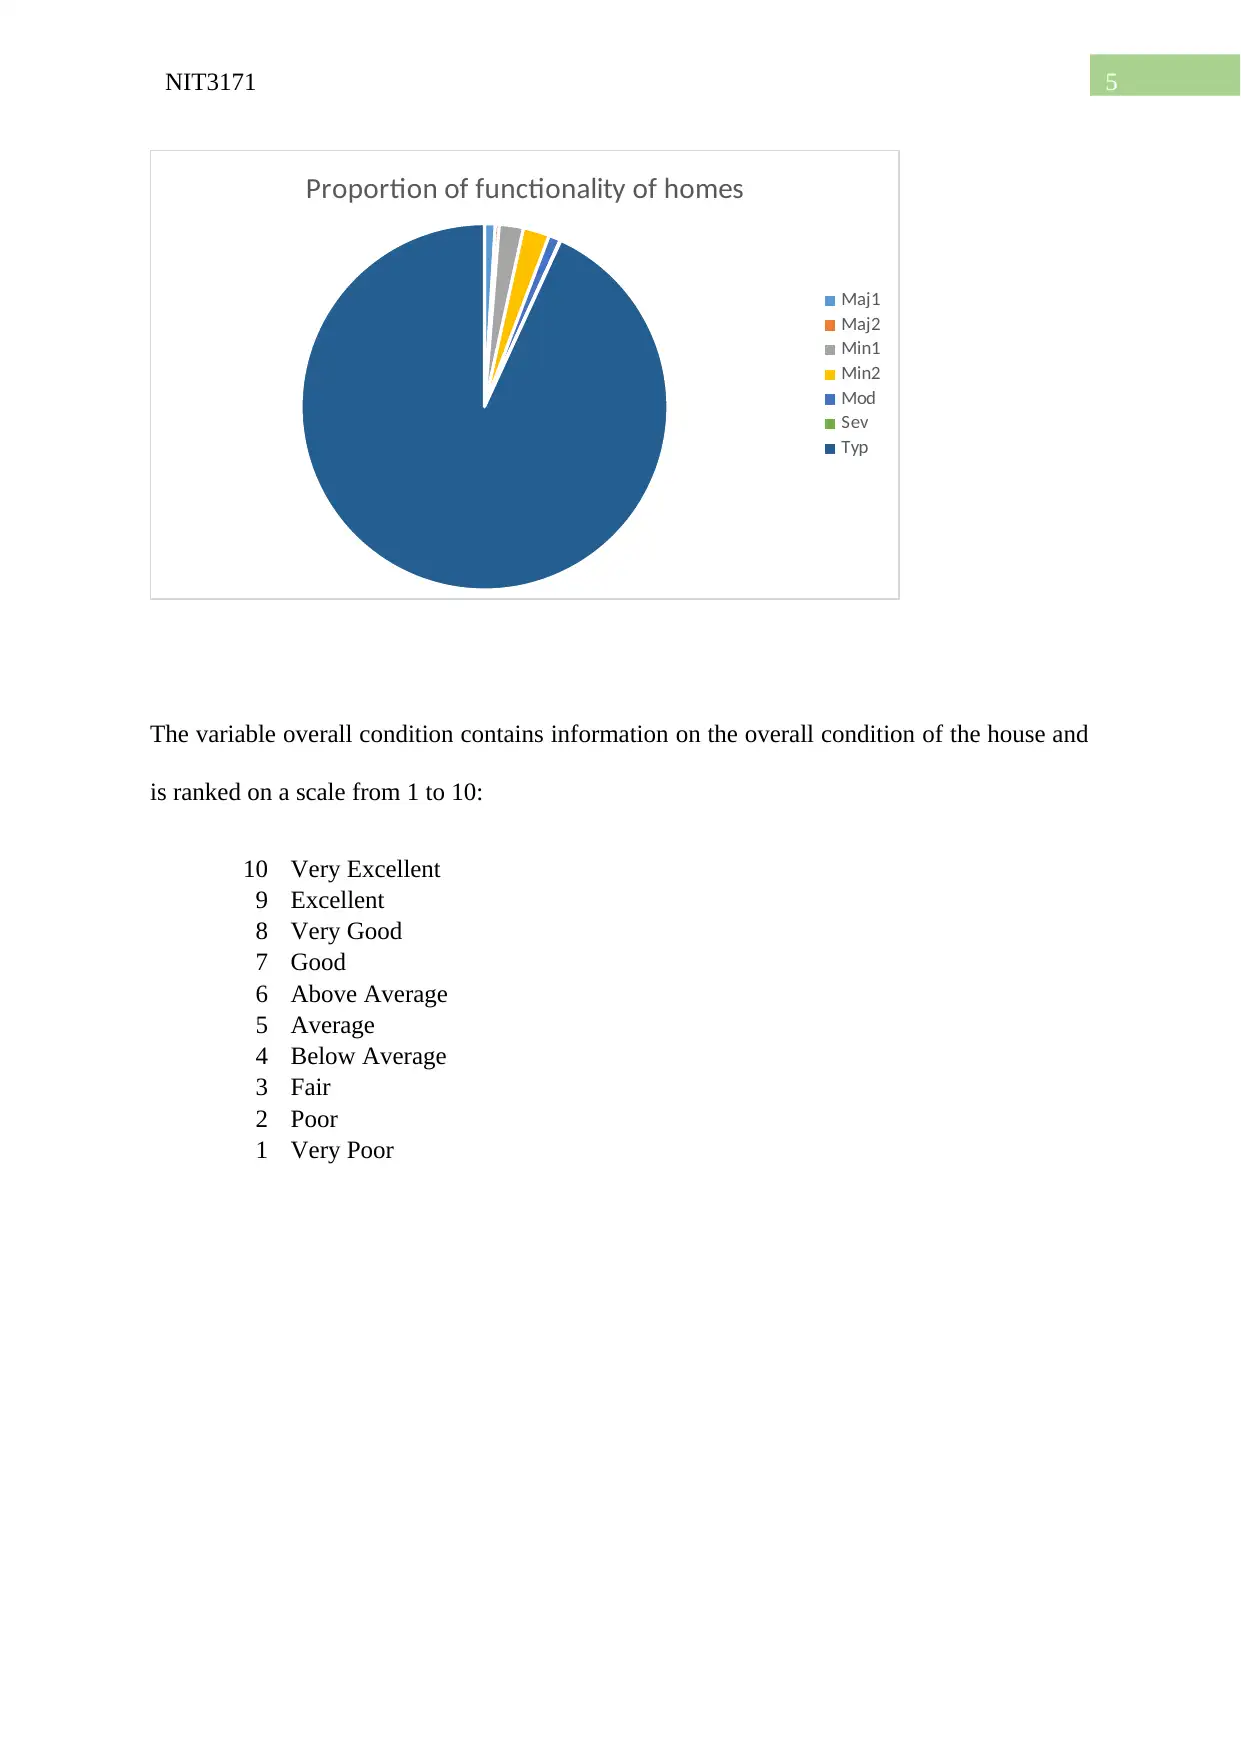
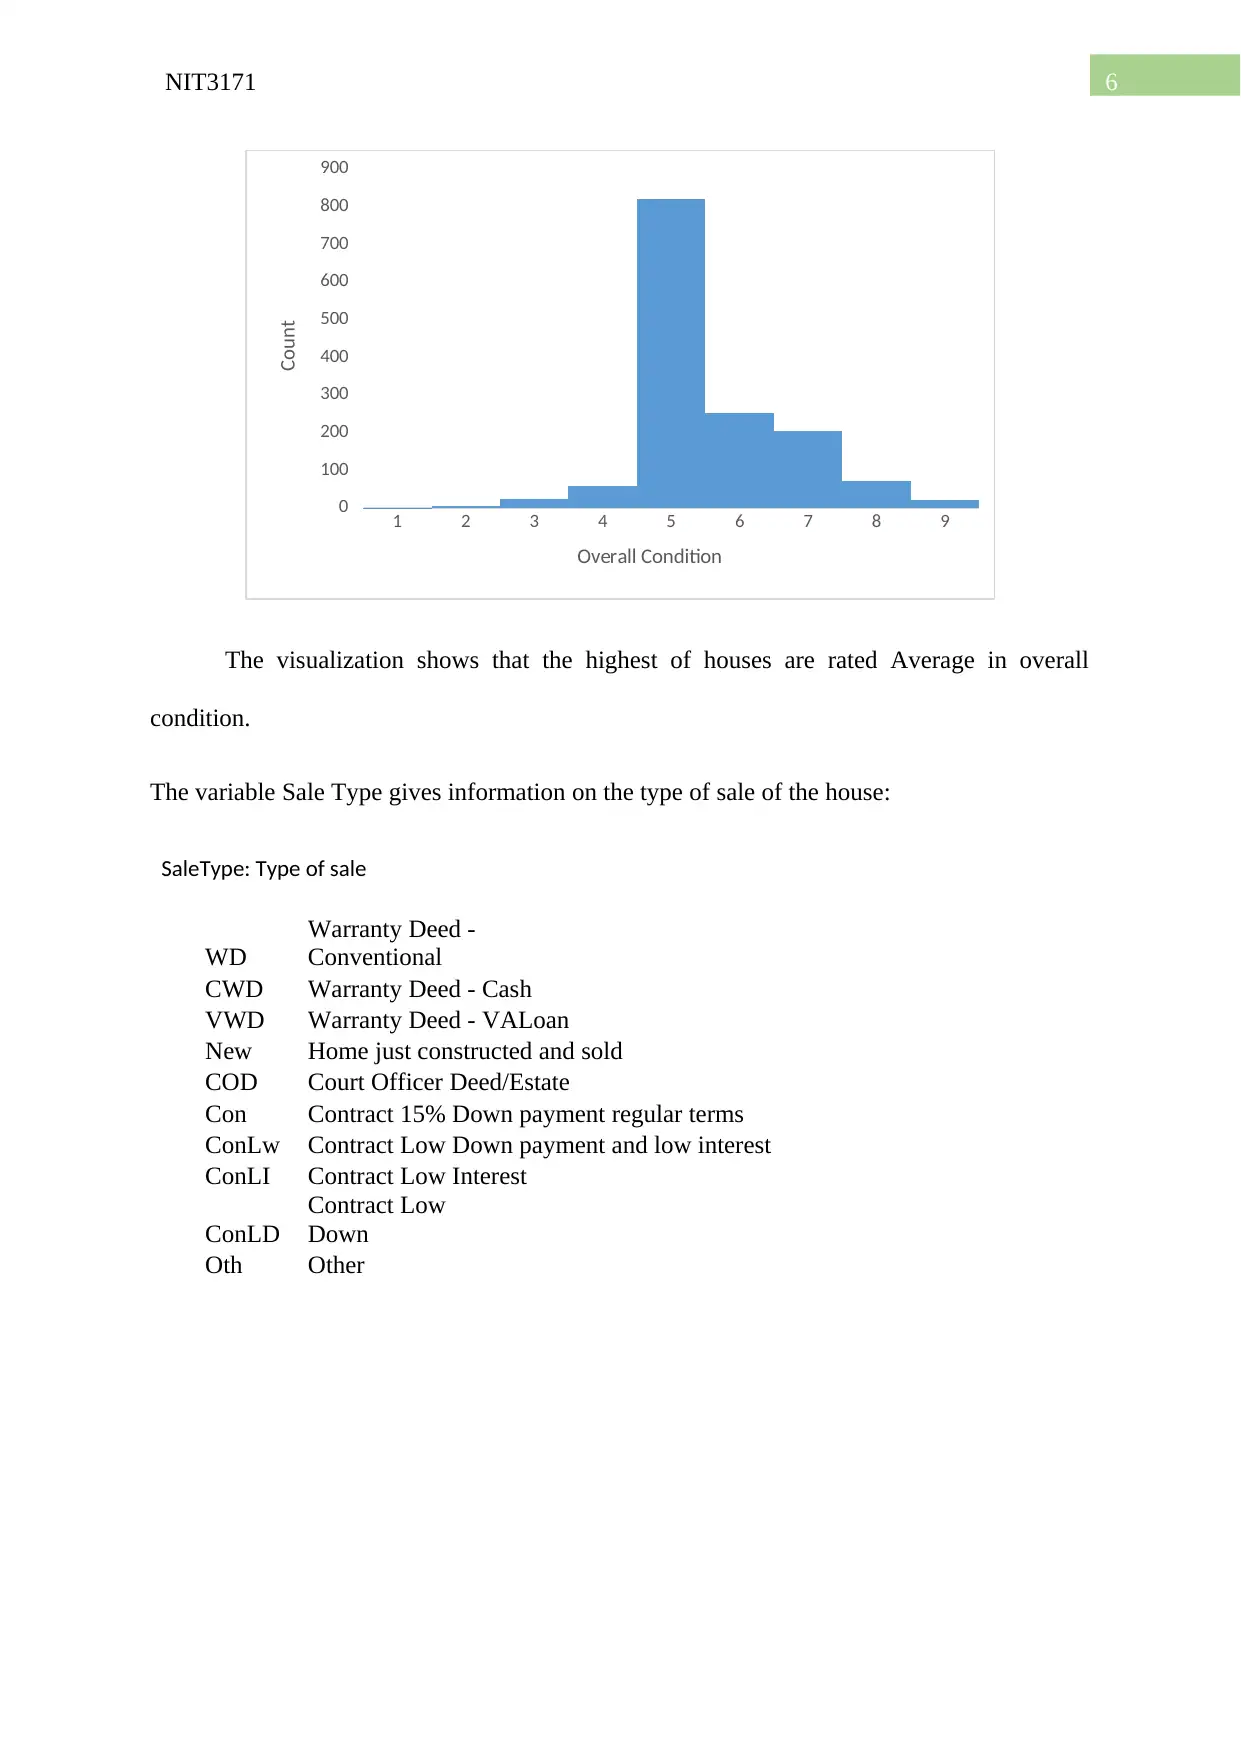
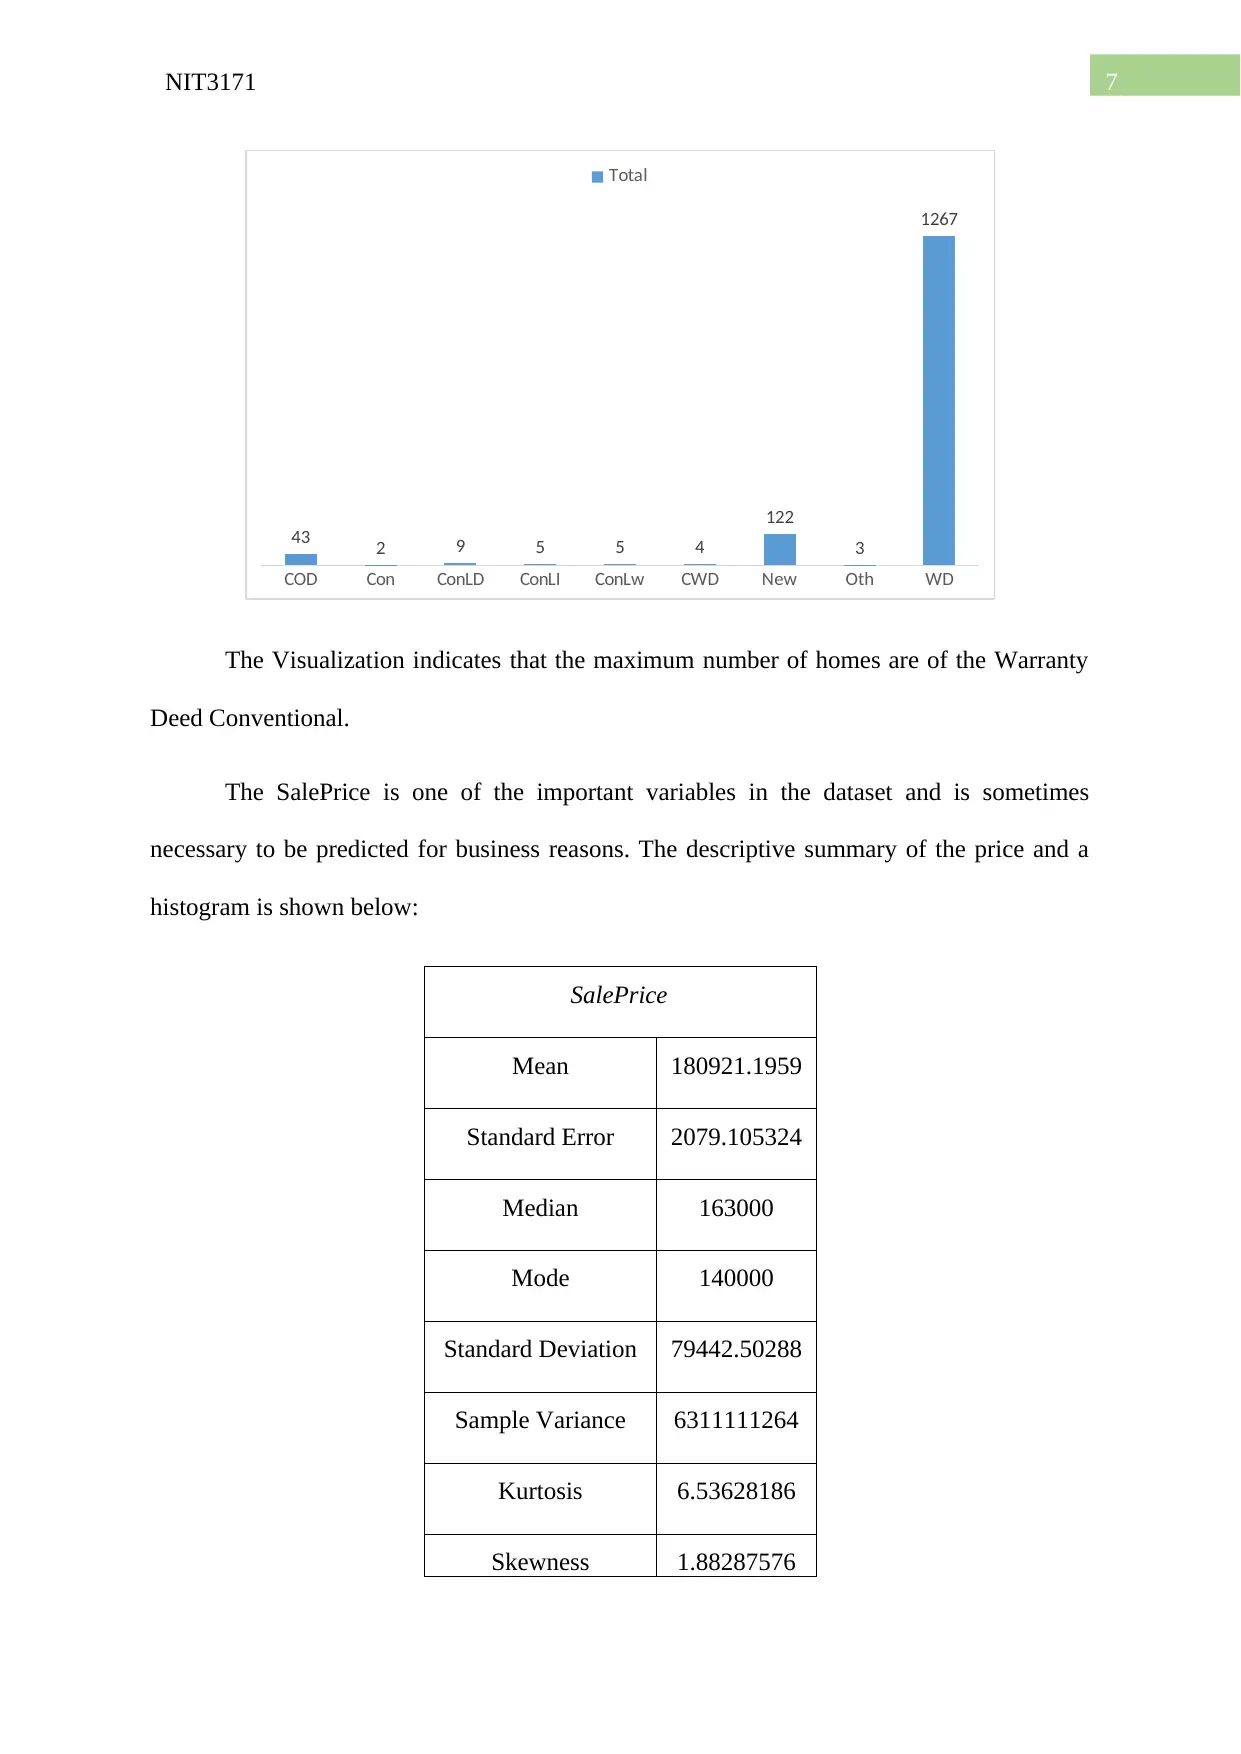
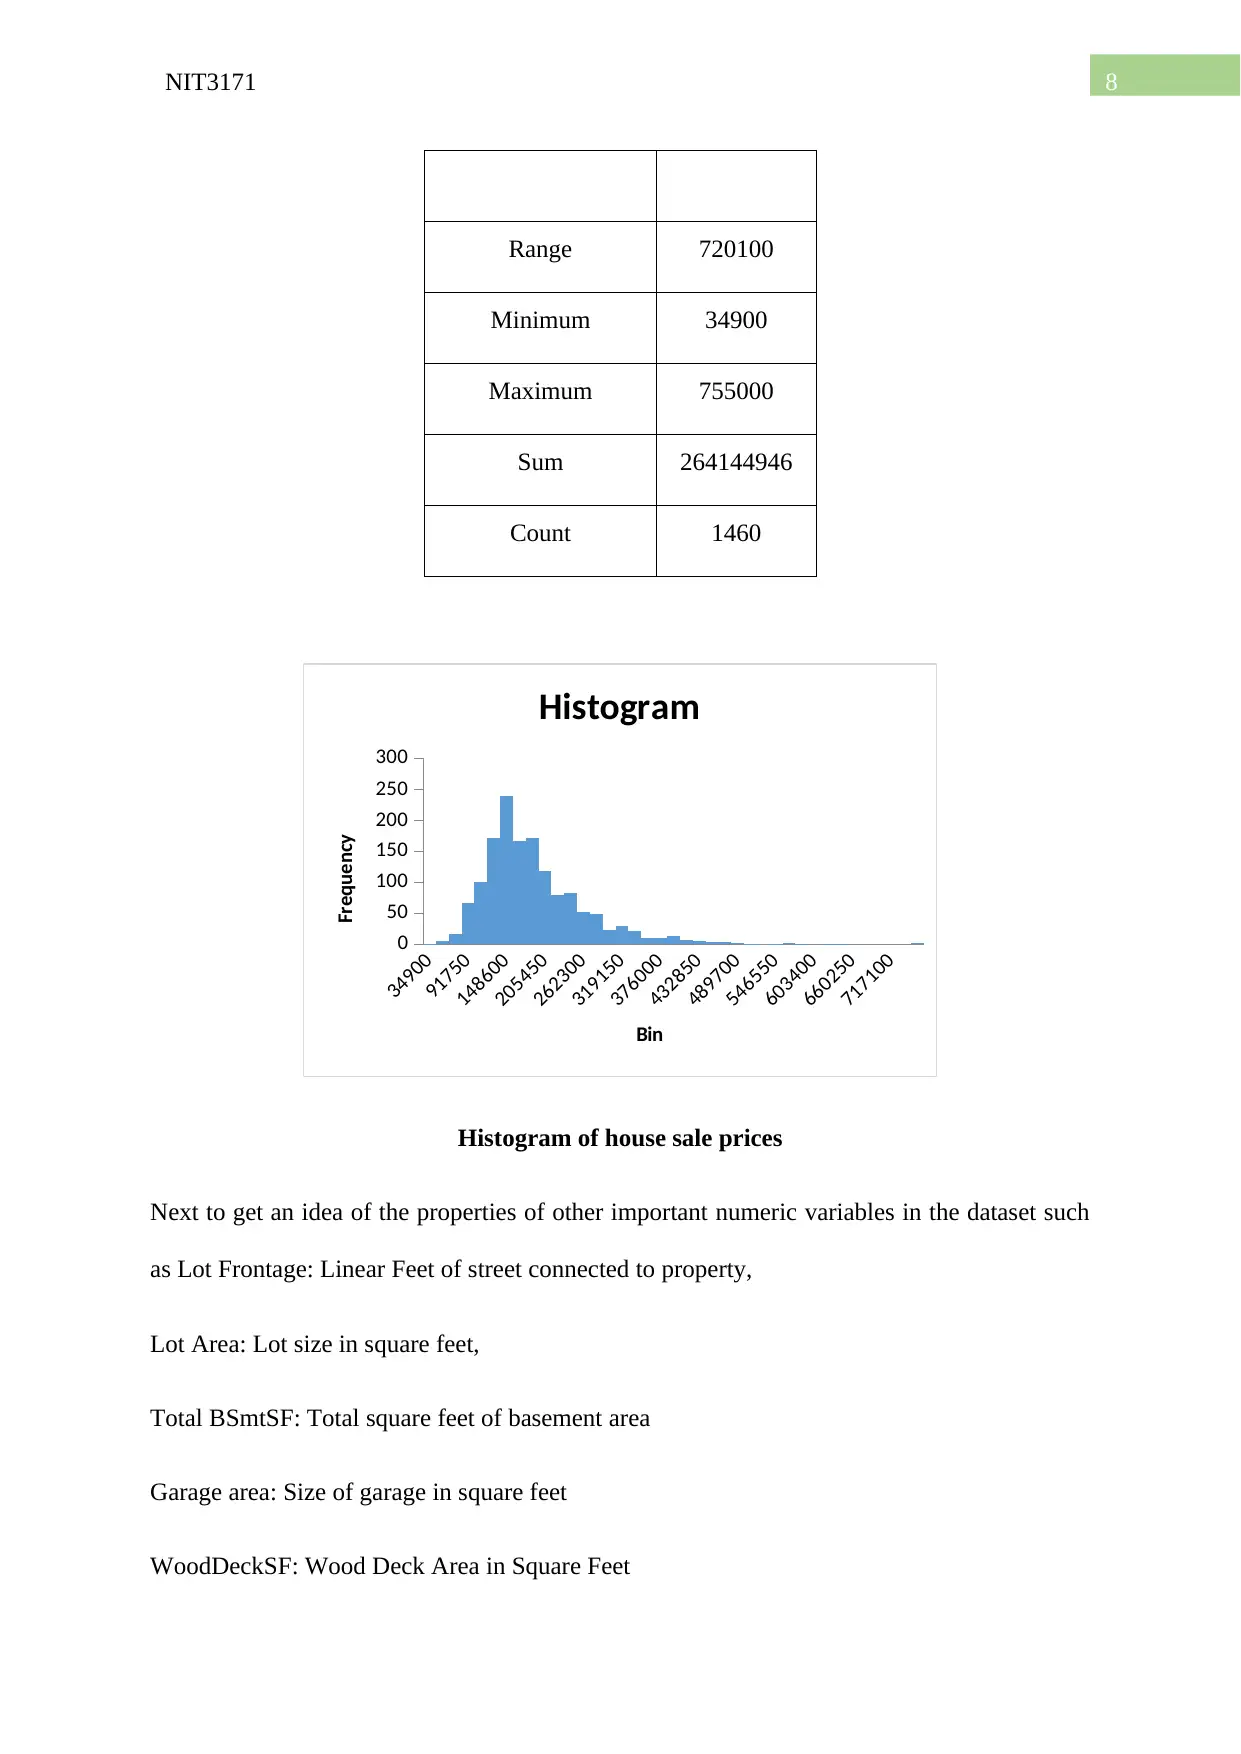
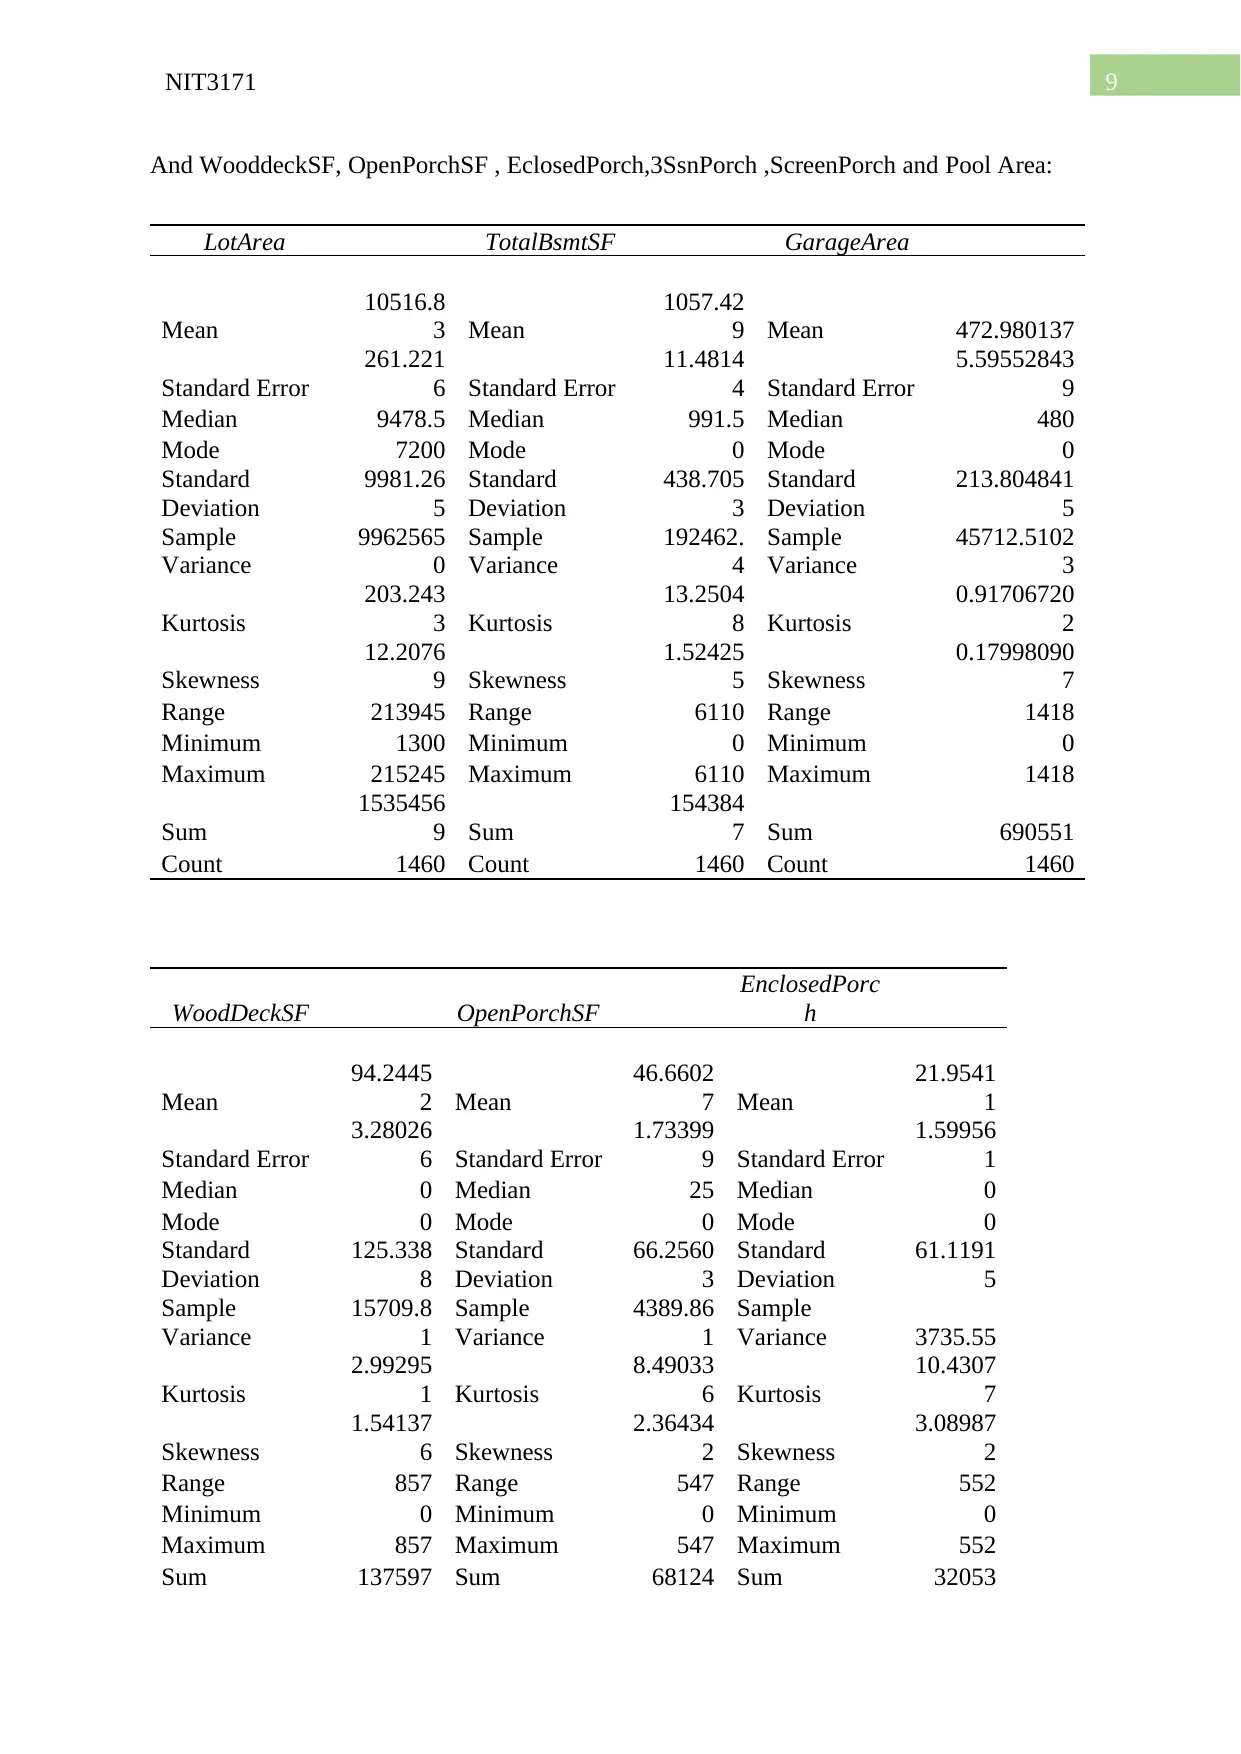
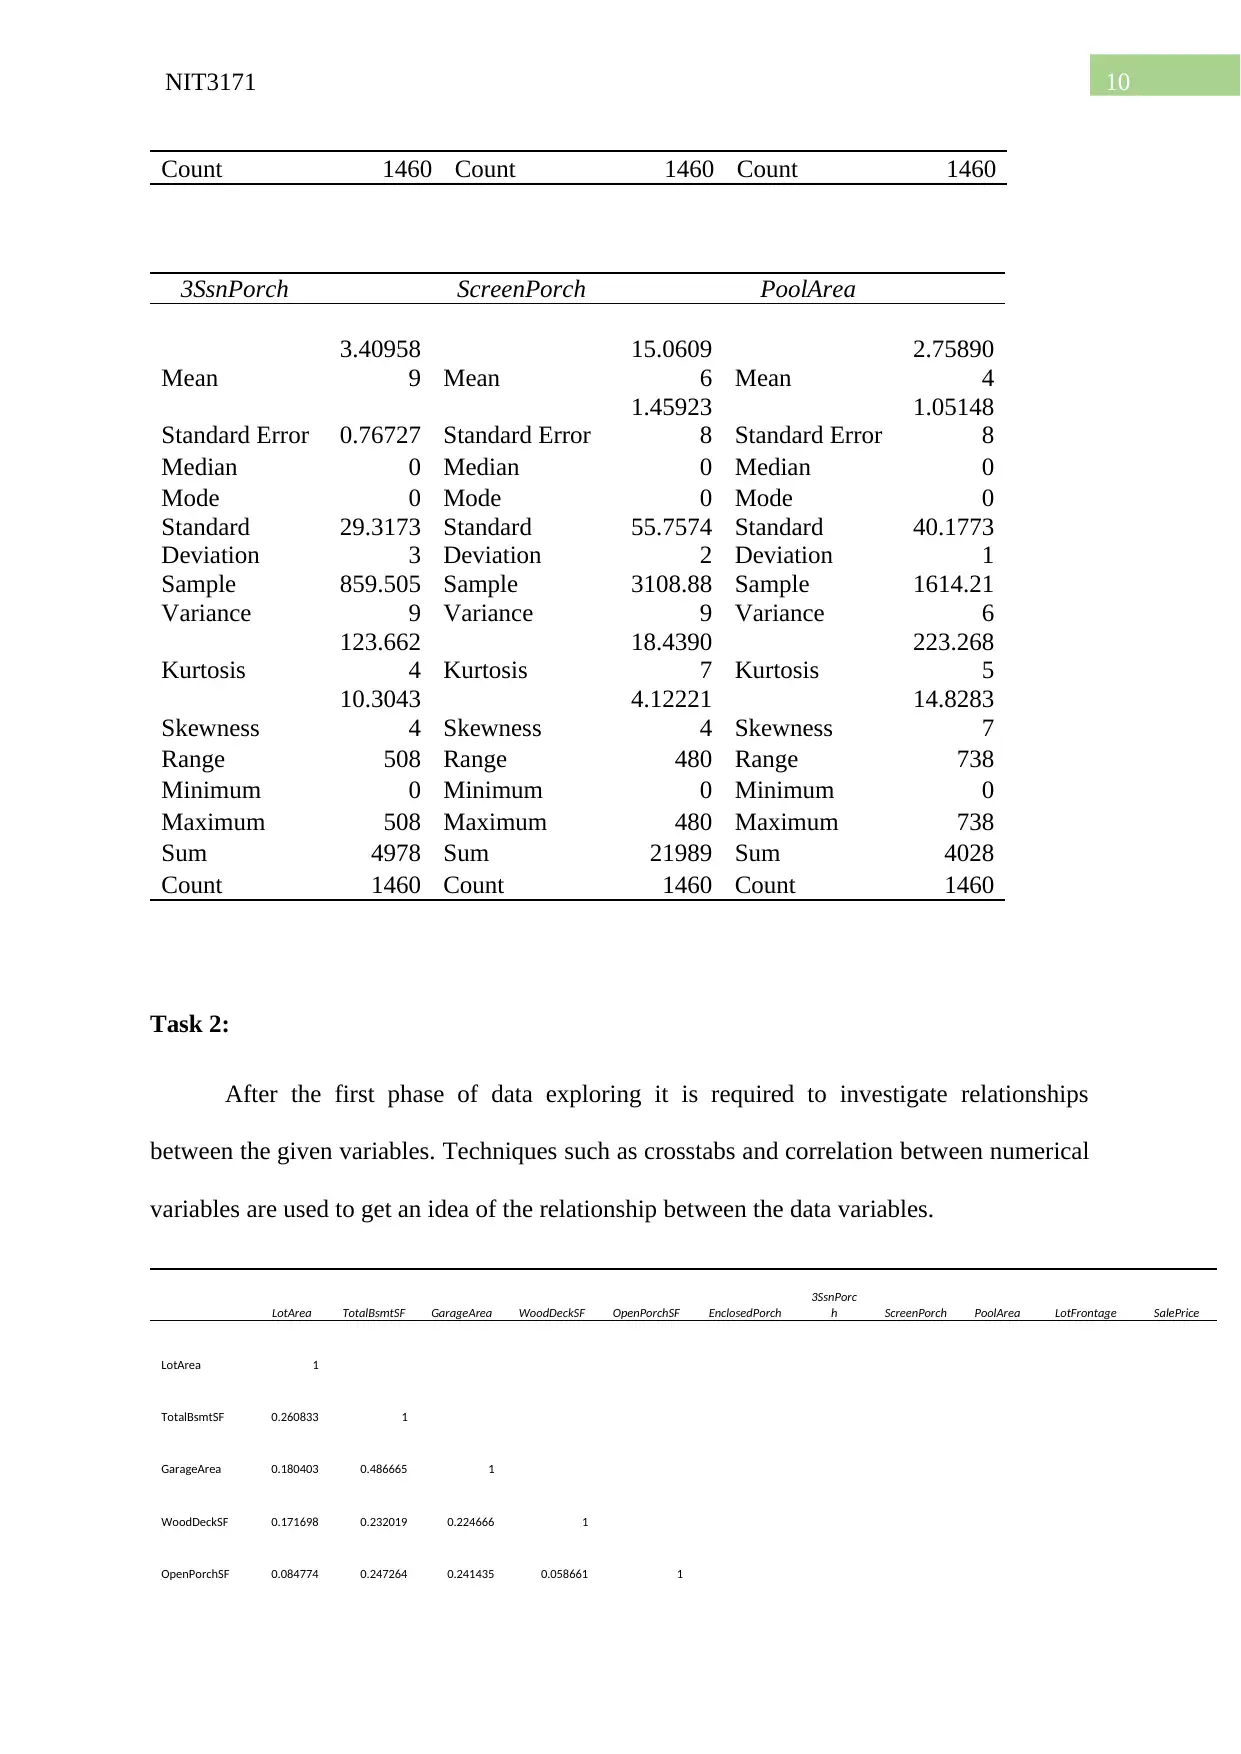
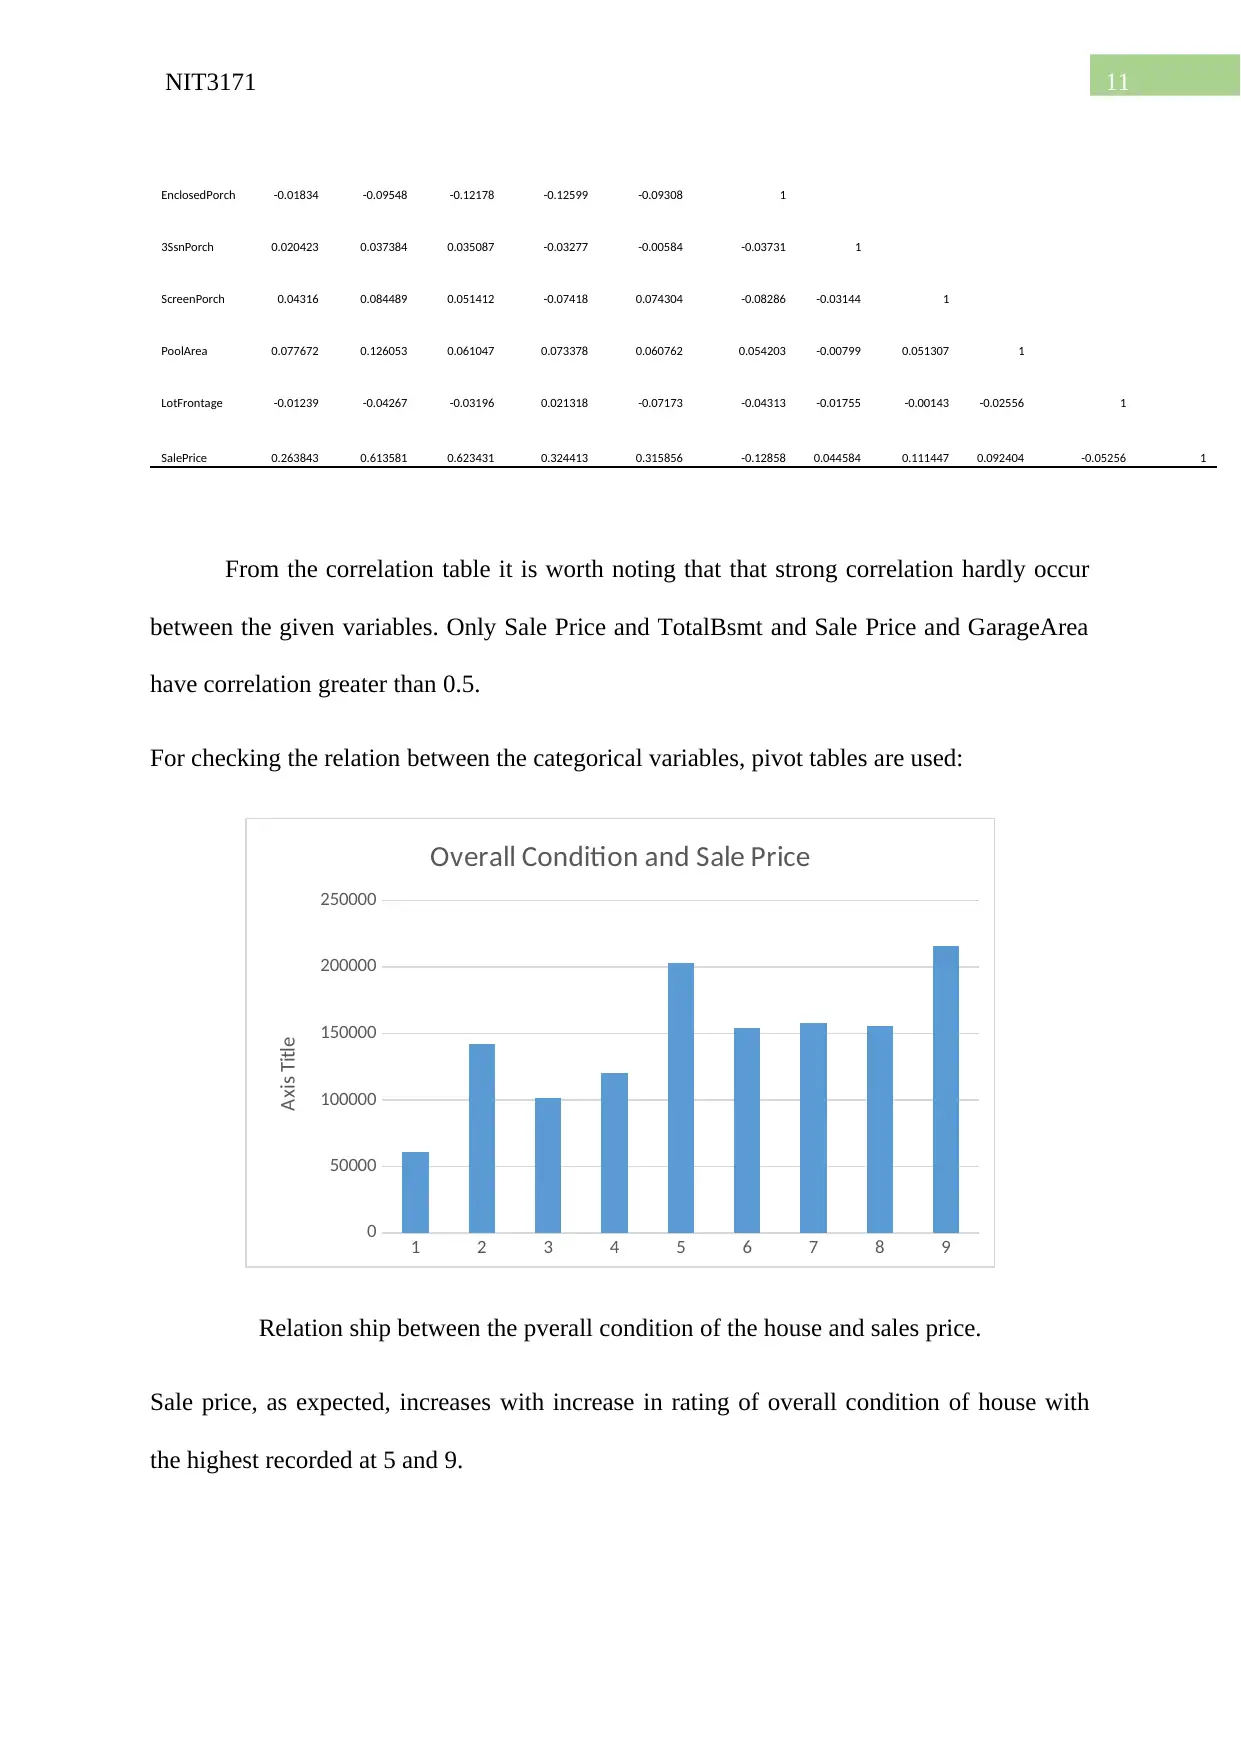
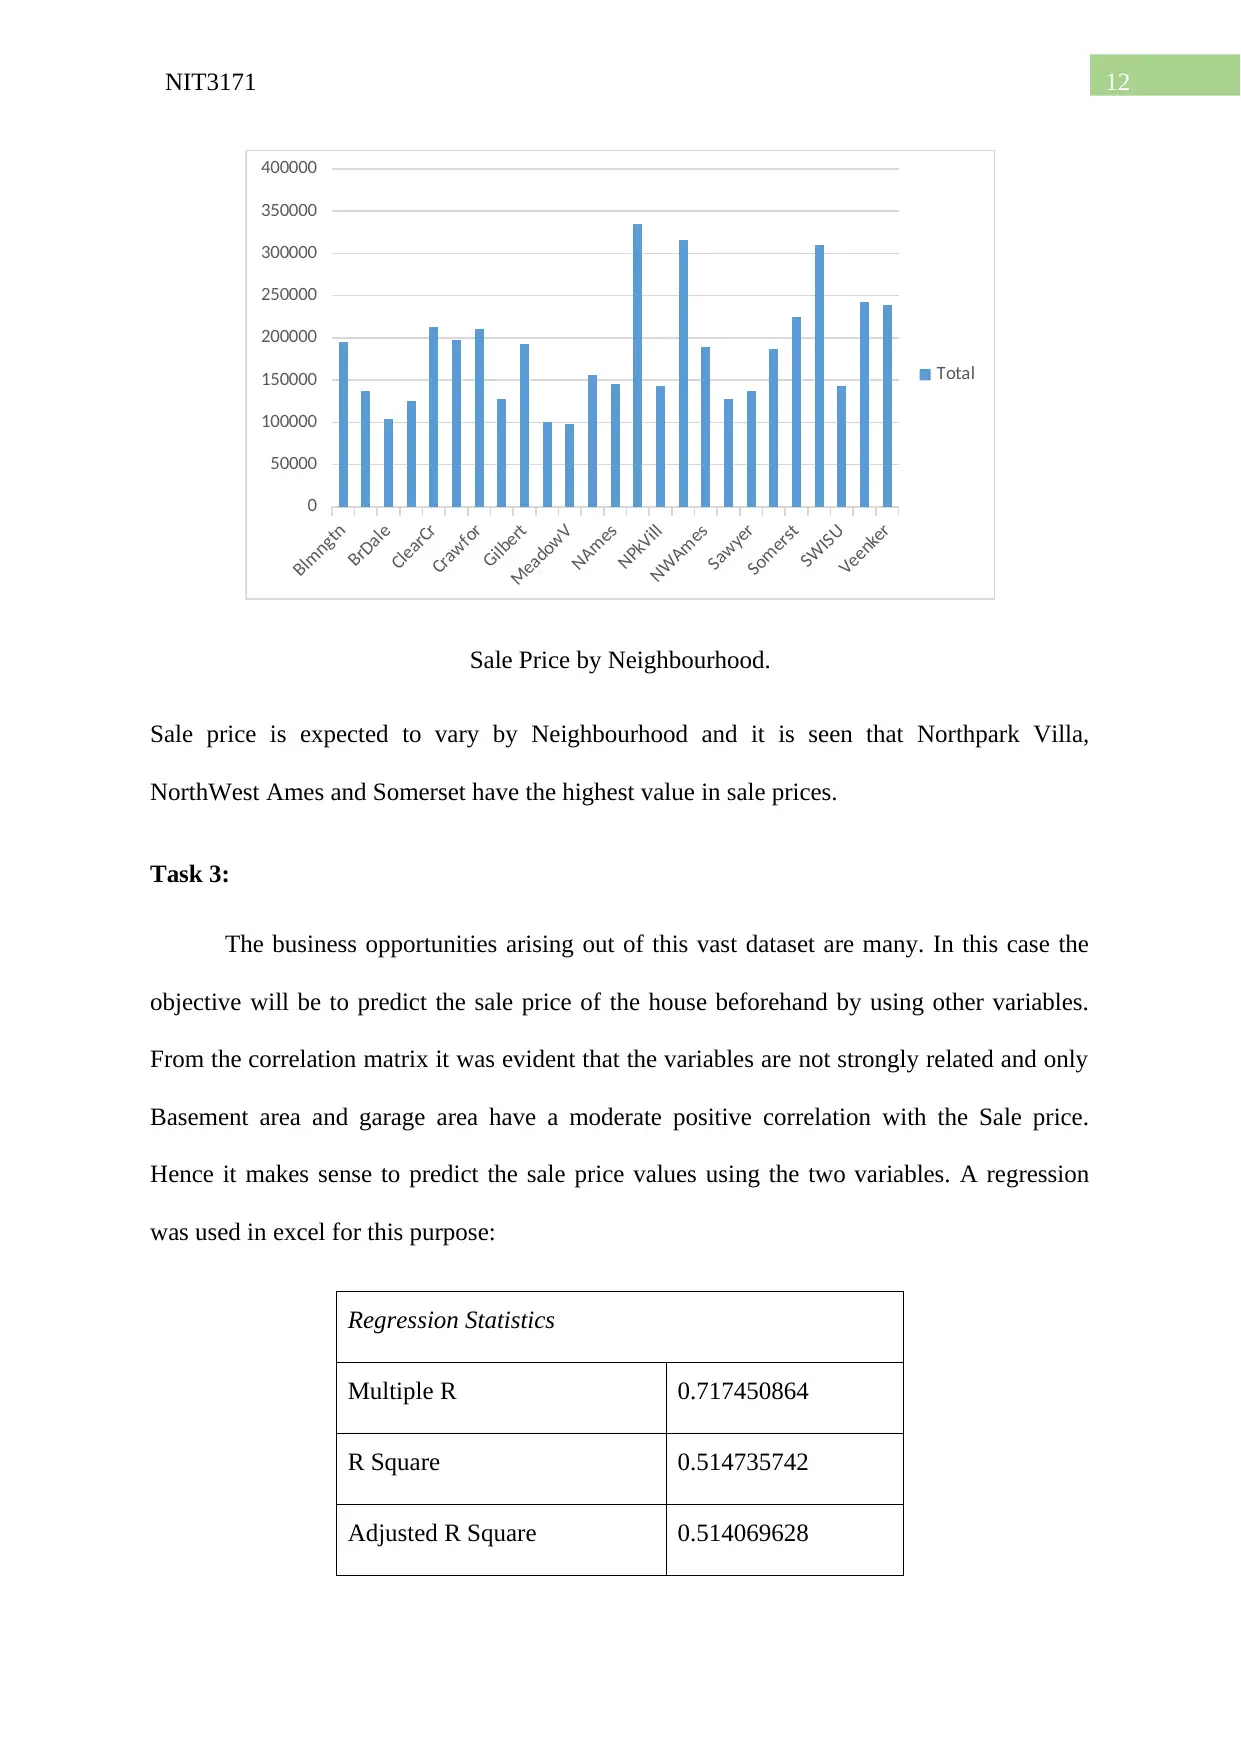
This report presents an analysis of the Boston housing dataset, focusing on data exploration and the discovery of relationships between variables. The report begins with an introduction to the dataset, outlining its structure and the objectives of the analysis. Task 1 involves an examination of both categorical and numeric variables, including visualizations of key variables such as overall condition and sale type. Descriptive statistics and histograms are provided for numeric variables like sale price, lot area, and garage area. Task 2 delves into the relationships between variables, using techniques such as correlation matrices and pivot tables to understand how variables interact. Specifically, the report explores the correlation between various features and the sale price, as well as the relationship between the overall condition of the house and the sale price. Task 3 focuses on the business opportunities arising from the dataset, particularly the prediction of sale prices using variables like basement area and garage area via regression analysis. The report concludes by summarizing the findings and highlighting the potential for leveraging the dataset to make strategic business decisions.
Document Page
Running head: NIT3171
NIT3171
Name of the University
Name of the Student
tabler-icon-diamond-filled.svg

Paraphrase This Document

Need a fresh take? Get an instant paraphrase of this document with our AI Paraphraser
Document Page
2NIT3171
Table of Contents
Introduction:...............................................................................................................................3
Task 1:........................................................................................................................................3
Task 2:......................................................................................................................................10
Task 3:......................................................................................................................................12
Conclusion:..............................................................................................................................13
References:...............................................................................................................................14
Document Page
3NIT3171
Introduction:
The Boston housing dataset contains information on the housing prices and various
other attributes related to houses in the area. There are 14061 rows and 81 columns as
variables. The objective of the assignment is to explore the data set and see how it can be
useful for business decisions.
Task 1:
Of the 81 variables, there are many categorical and numeric variables. Some of the
important categorical variables are :
MSSubClass: Identifies the type of dwelling involved in the sale
MSZoning: Identifies the general zoning classification of the sale. The classification include:
A Agriculture
C Commercial
FV Floating Village Residential
I Industrial
RH Residential High Density
RL Residential Low Density
RP
Residential Low Density
Park
RM
Residential Medium
Density
Street Type that describes the type of road access to the property i.e paved or gravel.
Alley: Type of alley access to property
Grvl Gravel
Pave Paved
NA No alley access
Document Page
4NIT3171
Lot shape that describes the general shape of the property, LandContour which tells us
the flatness of the property, utilities describing the type of utilities available, functional
describing the functionality of the house, overall condition of the house etc….
The important numeric variables are Lot Frontage, Lot Variable, TotalBsmt SF etc…
As the dataset is very large it is useful to get an idea of how the variables interact with
each other and also the behaviour of individual variables. Also, checking for missing values
in the dataset led to the discovery of the following variables containing one or more missing
values:
LotFrontage, Mas Vnr Area, BsmtFin SF 1, BsmtFin SF 2, BsmtUnfSf, Bsmt Full Bath,
Bsmt Half Bath, Garage Year Blt, Garage Cars, Garage Area.
For data visualization the variable functional is first taken which has information on the home
functionality:
Typ Typical Functionality
Min1 Minor Deductions 1
Min2 Minor Deductions 2
Mod Moderate Deductions
Maj1 Major Deductions 1
Maj2 Major Deductions 2
Sev Severely Damaged
Sal Salvage only
tabler-icon-diamond-filled.svg

Paraphrase This Document

Need a fresh take? Get an instant paraphrase of this document with our AI Paraphraser
Document Page
5NIT3171
Proportion of functionality of homes
Maj1
Maj2
Min1
Min2
Mod
Sev
Typ
The variable overall condition contains information on the overall condition of the house and
is ranked on a scale from 1 to 10:
10 Very Excellent
9 Excellent
8 Very Good
7 Good
6 Above Average
5 Average
4 Below Average
3 Fair
2 Poor
1 Very Poor
Document Page
6NIT3171
1 2 3 4 5 6 7 8 9
0
100
200
300
400
500
600
700
800
900
Overall Condition
Count
The visualization shows that the highest of houses are rated Average in overall
condition.
The variable Sale Type gives information on the type of sale of the house:
SaleType: Type of sale
WD
Warranty Deed -
Conventional
CWD Warranty Deed - Cash
VWD Warranty Deed - VALoan
New Home just constructed and sold
COD Court Officer Deed/Estate
Con Contract 15% Down payment regular terms
ConLw Contract Low Down payment and low interest
ConLI Contract Low Interest
ConLD
Contract Low
Down
Oth Other
Document Page
7NIT3171
COD Con ConLD ConLI ConLw CWD New Oth WD
43 2 9 5 5 4
122
3
1267
Total
The Visualization indicates that the maximum number of homes are of the Warranty
Deed Conventional.
The SalePrice is one of the important variables in the dataset and is sometimes
necessary to be predicted for business reasons. The descriptive summary of the price and a
histogram is shown below:
SalePrice
Mean 180921.1959
Standard Error 2079.105324
Median 163000
Mode 140000
Standard Deviation 79442.50288
Sample Variance 6311111264
Kurtosis 6.53628186
Skewness 1.88287576
tabler-icon-diamond-filled.svg

Paraphrase This Document

Need a fresh take? Get an instant paraphrase of this document with our AI Paraphraser
Document Page
8NIT3171
Range 720100
Minimum 34900
Maximum 755000
Sum 264144946
Count 1460
34900
91750
148600
205450
262300
319150
376000
432850
489700
546550
603400
660250
717100
0
50
100
150
200
250
300
Histogram
Bin
Frequency
Histogram of house sale prices
Next to get an idea of the properties of other important numeric variables in the dataset such
as Lot Frontage: Linear Feet of street connected to property,
Lot Area: Lot size in square feet,
Total BSmtSF: Total square feet of basement area
Garage area: Size of garage in square feet
WoodDeckSF: Wood Deck Area in Square Feet
Document Page
9NIT3171
And WooddeckSF, OpenPorchSF , EclosedPorch,3SsnPorch ,ScreenPorch and Pool Area:
LotArea TotalBsmtSF GarageArea
Mean
10516.8
3 Mean
1057.42
9 Mean 472.980137
Standard Error
261.221
6 Standard Error
11.4814
4 Standard Error
5.59552843
9
Median 9478.5 Median 991.5 Median 480
Mode 7200 Mode 0 Mode 0
Standard
Deviation
9981.26
5
Standard
Deviation
438.705
3
Standard
Deviation
213.804841
5
Sample
Variance
9962565
0
Sample
Variance
192462.
4
Sample
Variance
45712.5102
3
Kurtosis
203.243
3 Kurtosis
13.2504
8 Kurtosis
0.91706720
2
Skewness
12.2076
9 Skewness
1.52425
5 Skewness
0.17998090
7
Range 213945 Range 6110 Range 1418
Minimum 1300 Minimum 0 Minimum 0
Maximum 215245 Maximum 6110 Maximum 1418
Sum
1535456
9 Sum
154384
7 Sum 690551
Count 1460 Count 1460 Count 1460
WoodDeckSF OpenPorchSF
EnclosedPorc
h
Mean
94.2445
2 Mean
46.6602
7 Mean
21.9541
1
Standard Error
3.28026
6 Standard Error
1.73399
9 Standard Error
1.59956
1
Median 0 Median 25 Median 0
Mode 0 Mode 0 Mode 0
Standard
Deviation
125.338
8
Standard
Deviation
66.2560
3
Standard
Deviation
61.1191
5
Sample
Variance
15709.8
1
Sample
Variance
4389.86
1
Sample
Variance 3735.55
Kurtosis
2.99295
1 Kurtosis
8.49033
6 Kurtosis
10.4307
7
Skewness
1.54137
6 Skewness
2.36434
2 Skewness
3.08987
2
Range 857 Range 547 Range 552
Minimum 0 Minimum 0 Minimum 0
Maximum 857 Maximum 547 Maximum 552
Sum 137597 Sum 68124 Sum 32053
Document Page
10NIT3171
Count 1460 Count 1460 Count 1460
3SsnPorch ScreenPorch PoolArea
Mean
3.40958
9 Mean
15.0609
6 Mean
2.75890
4
Standard Error 0.76727 Standard Error
1.45923
8 Standard Error
1.05148
8
Median 0 Median 0 Median 0
Mode 0 Mode 0 Mode 0
Standard
Deviation
29.3173
3
Standard
Deviation
55.7574
2
Standard
Deviation
40.1773
1
Sample
Variance
859.505
9
Sample
Variance
3108.88
9
Sample
Variance
1614.21
6
Kurtosis
123.662
4 Kurtosis
18.4390
7 Kurtosis
223.268
5
Skewness
10.3043
4 Skewness
4.12221
4 Skewness
14.8283
7
Range 508 Range 480 Range 738
Minimum 0 Minimum 0 Minimum 0
Maximum 508 Maximum 480 Maximum 738
Sum 4978 Sum 21989 Sum 4028
Count 1460 Count 1460 Count 1460
Task 2:
After the first phase of data exploring it is required to investigate relationships
between the given variables. Techniques such as crosstabs and correlation between numerical
variables are used to get an idea of the relationship between the data variables.
LotArea TotalBsmtSF GarageArea WoodDeckSF OpenPorchSF EnclosedPorch
3SsnPorc
h ScreenPorch PoolArea LotFrontage SalePrice
LotArea 1
TotalBsmtSF 0.260833 1
GarageArea 0.180403 0.486665 1
WoodDeckSF 0.171698 0.232019 0.224666 1
OpenPorchSF 0.084774 0.247264 0.241435 0.058661 1
tabler-icon-diamond-filled.svg

Paraphrase This Document

Need a fresh take? Get an instant paraphrase of this document with our AI Paraphraser
Document Page
11NIT3171
EnclosedPorch -0.01834 -0.09548 -0.12178 -0.12599 -0.09308 1
3SsnPorch 0.020423 0.037384 0.035087 -0.03277 -0.00584 -0.03731 1
ScreenPorch 0.04316 0.084489 0.051412 -0.07418 0.074304 -0.08286 -0.03144 1
PoolArea 0.077672 0.126053 0.061047 0.073378 0.060762 0.054203 -0.00799 0.051307 1
LotFrontage -0.01239 -0.04267 -0.03196 0.021318 -0.07173 -0.04313 -0.01755 -0.00143 -0.02556 1
SalePrice 0.263843 0.613581 0.623431 0.324413 0.315856 -0.12858 0.044584 0.111447 0.092404 -0.05256 1
From the correlation table it is worth noting that that strong correlation hardly occur
between the given variables. Only Sale Price and TotalBsmt and Sale Price and GarageArea
have correlation greater than 0.5.
For checking the relation between the categorical variables, pivot tables are used:
1 2 3 4 5 6 7 8 9
0
50000
100000
150000
200000
250000
Overall Condition and Sale Price
Axis Title
Relation ship between the pverall condition of the house and sales price.
Sale price, as expected, increases with increase in rating of overall condition of house with
the highest recorded at 5 and 9.
Document Page
12NIT3171
Blmngtn
BrDale
ClearCr
Crawfor
Gilbert
MeadowV
NAmes
NPkVill
NWAmes
Sawyer
Somerst
SWISU
Veenker
0
50000
100000
150000
200000
250000
300000
350000
400000
Total
Sale Price by Neighbourhood.
Sale price is expected to vary by Neighbourhood and it is seen that Northpark Villa,
NorthWest Ames and Somerset have the highest value in sale prices.
Task 3:
The business opportunities arising out of this vast dataset are many. In this case the
objective will be to predict the sale price of the house beforehand by using other variables.
From the correlation matrix it was evident that the variables are not strongly related and only
Basement area and garage area have a moderate positive correlation with the Sale price.
Hence it makes sense to predict the sale price values using the two variables. A regression
was used in excel for this purpose:
Regression Statistics
Multiple R 0.717450864
R Square 0.514735742
Adjusted R Square 0.514069628
Document Page
13NIT3171
Standard Error 55378.34094
Observations 1460
R square value of the model is .515 which means that 51.5% of the variability in the
sale price can be explained by the variability in the independent variables.
Coefficients Standard
Error
t Stat P-value
Intercept 28292.81659 4157.728 6.804875 1.47273E-11
TotalBsmtSF 73.5999077 3.782967 19.45561 3.9219E-75
GarageArea 158.1497052 7.762255 20.3742 2.15488E-81
The p values for the coefficient indicates that they are statistically significant.
Other categorical variables can be used to predict the Sale Price by more advanced methods.
Conclusion:
The good part about a large data set is that depending on the conditions and context a
business organization can try to glean the relevant information about its business to make
strategic decisions. The dataset can be used in different ways depending on the context; in
this case to predict the sale price of a house by using other relevant variables.
tabler-icon-diamond-filled.svg

Paraphrase This Document

Need a fresh take? Get an instant paraphrase of this document with our AI Paraphraser
Document Page
14NIT3171
References:
Fry, G.S., 2019. Business statistics a decision-making approach. Pearson Education Limited.
Siegel, A., 2016. Practical business statistics. Academic Press.
chevron_up_icon
1 out of 14
circle_padding
hide_on_mobile
zoom_out_icon
[object Object]