Business Analysis BUS5004 Assignment: Data, Information, and Systems
VerifiedAdded on 2022/12/28
|23
|6553
|3
Report
AI Summary
This report, prepared for the BUS5004 Business Analysis module, delves into critical aspects of data analysis. It begins by exploring the significance of population data and various sampling techniques, including probability and non-probability methods, emphasizing their application in drawing statistical conclusions. The report then differentiates between primary and secondary data, outlining their respective advantages and disadvantages in terms of collection methods, cost, and reliability. Further, it highlights the importance of management information systems (MIS) in supporting effective decision-making processes within organizations. The analysis covers the methods of data collection, the differences between primary and secondary data, and the role of data analysis in the socio-economic and business context, providing a comprehensive overview of the subject matter.

Business Analysis
1
1
Paraphrase This Document
Need a fresh take? Get an instant paraphrase of this document with our AI Paraphraser
Table of Contents
Introduction......................................................................................................................................3
Question 1:.......................................................................................................................................4
a) Significance of Population.......................................................................................................4
b) Significance of sampling techniques.......................................................................................5
Question 2........................................................................................................................................7
1. Difference between primary and secondary data.....................................................................7
2. Advantages and disadvantages of primary and secondary data...............................................9
Question3.......................................................................................................................................11
Question 4......................................................................................................................................14
Importance of management information system in decision making........................................14
Conclusion.....................................................................................................................................18
References......................................................................................................................................19
2
Question 1:
a) Significance of Population
Population is a fundamental part of existence. Population data is defined as the collection of
individuals or groups of individuals with common characteristics. Population is highly dependent
on geographic location, like all California residents or all of the United States. Demographics
(those that study the population) naturally classify this population. All living beings are
considered peoples (Kwak and Kim, 2017).
Geography is one of the many ways to define and study a population. Times, political
movements, religious beliefs or physical characteristics are how people are divided into different
societies. Population surveys are conducted by examining these heterogeneous numbers and
monitoring cross-sectional variables. For example, you might learn about the American
Republican population and see the population living in Texas. In this case, you can study where
these numbers are interconnected and learn about Republicans and Texas.
Significance of population data
Important decisions about a country, group or family are based on population data. Demographic
data includes a number of important details such as demographic information such as birth,
death, age, gender, annual income, occupation, language, etc. The overall socio-economic,
economic, political and cultural development of a country depends on population data (Kaur et
al, 2018)
The socio-psychological concept of population
Social psychology is the study of how people think, influence and relate to others. This happened
at the crossroads of psychology and sociology in the early 20th century. Psychology analyzes
human nature, while sociology studies the nature of society. On the other hand, social
psychology is the study of a person's personality and relationship with society. The field of social
psychology is social and the focus is on the individual. This is the study of personality in social
situations. This social situation can be the interaction of people, the interaction of a person to a
group, and the partnerships of a group with other groups. Social psychologists use scientific
3
⊘ This is a preview!⊘
Do you want full access?
Subscribe today to unlock all pages.
Trusted by 1+ million students worldwide
methods to study how we perceive people and social events, how we influence and influence
others, social relationships and communication and group dynamics (Mishra et al, 2018).
Social psychology focuses on understanding the causes of social behavior and identifying the
factors that shape our feelings, behaviors and thoughts in social situations. Key hypothesis:
"Accurate and useful information on the most complex aspects of social behavior and thinking
can be obtained using basic scientific methods".
Population prediction method
The cohort component approach uses components of population change to predict population
growth. This tool assesses the population based on age group as well as other demographic
characteristics such as gender and ethnicity. This prediction method is based on the components
of demographic change, including pregnancy, mortality and migration.
To predict the total population and the number of males and females after the age of 5, find the
number of people who will or should be living in the future. Add the number of babies born and
the number of unique migrants to the surviving population. There are several ways to use the
cohort component approach. The method described here is easy to use and requires very little
demographic information (Majid, 2018).
b) Significance of sampling techniques
Definition: Sampling is a statistical approach that involves the selection of individual cases.
Helps to draw statistical conclusions about the population.
Probability Sampling Methods
1. Simple random sampling
In this situation everyone is completely chosen by some coincidence and everyone in the
population has the same chance, or probability, of being chosen. One way to give an irregular
example is to give a number to each person in a population and then use a table of irregular
numbers to choose which people should be included (Metelli et al, 2020).
2. Systematic sampling
4
Paraphrase This Document
Need a fresh take? Get an instant paraphrase of this document with our AI Paraphraser
People will be selected at normal times from the test pattern. The races are selected to ensure an
appropriate sample size. Effective routine monitoring is more useful than basic resolution tests
and is not difficult to monitor. In any case, it may encourage bias, for example if there are hidden
examples in the application for people in the analyst scheme, to the extent that the method of
analysis agrees with the timeliness of the underlying example (Symonds, Kattirtzi and
Shalashilin, 2018).
3. Stratified sampling
In this strategy, the population is initially segmented into subgroups (or strata) that all offer a
comparative brand. It is used when we can reasonably expect the amount of interest between the
different subgroups to change and we must ensure that the subgroups are represented (Tse et al,
2018).
4. Clustered sampling
In a collected example, subgroups of the population are used as test units, as opposed to humans.
The population is divided into subgroups, called aggregates, which are randomly selected to be
remembered for study. Groups are usually effectively identified, for example individual practices
or GP practices may be identified as groups (Amato et al, 2017).
Non-probability Sampling Methods
1. Convenience sampling
The accommodation test is perhaps the least sought-after method, as members are selected on the
basis of accessibility and ability to participate (Kim and Wang, 2019)
2. Quota sampling
This monitoring strategy is routinely used by economists. Users are given a set of preset topics to
try and list.
3. Judgment (or Purposive) Sampling
Also known as a specific or abstract study, this method relies on the scientist's judgment when
choosing who he wants to participate in. Analysts can then realistically choose a "representative"
test based on their needs or target people with specific characteristics. This approach is routinely
5
used by the media when seeking the general public for emotion and in thematic studies (Otzen
and Manterola, 2017).
4. Snowball sampling
This strategy is used consistently in sociology when studying hard-to-reach collections. Existing
subjects are asked to choose other familiar subjects, so the example is growing in size like a
moving snowball. It is possible to perform a snowball survey when it is difficult to identify a test
pattern. However, in selecting companions and co-workers of previously sought-after subjects,
there is a high risk of being overemphasized (selecting a very large number of people with
attributes or perspectives similar to the original one) (Sharma, 2017).
It is hard to conclude which sampling method is most reliable, because it’s mainly depends on
situation or researcher requirement. The type of sampling has to be chosen based on availability
of time, cost and research scope.
Question 2
1. Difference between primary and secondary data
Data collection plays an important role in the statistical study. Research uses a combination of
strategies to collect data and falls into two categories: critical information and optional
information. As the name suggests, essential information such as basic information is collected
by the unexpected scientist and supporting information is information that has been collected or
is now provided passed by another (Johnston, 2017).
A study uses a combination of methods to collect data that falls into two categories: primary data
and secondary data. As the name suggests, essential information is basic information collected
by the unexpected scientist and optional information is information that is currently collected or
passed on by another person. There are many differences between the essential and supporting
information described in this article. In any case, the main difference is that essential information
is authentic and unique and optional information is only a revision and translation of essential
information. While essential information is collected for purpose purposes, optional information
is collected for a variety of purposes (Sánchez-Llorens et al, 2019).
6
⊘ This is a preview!⊘
Do you want full access?
Subscribe today to unlock all pages.
Trusted by 1+ million students worldwide
Primary data
Primary data is the data that was first obtained by researchers as a result of their direct efforts
and experience in solving their research problems. Direct data or raw data is also called.
Collecting basic data is expensive and requires resources such as investment and manpower, as
research is carried out by the organization or institution itself. The data is collected under the
direct direction and control of the researcher. Data can be collected through a variety of methods,
such as surveys, observations, physical examinations, postal questionnaires, completion and
survey questionnaires, personal interviews, telephone interviews, focus groups, case studies and
more (Flick, 2017).
Secondary data
It refers to the data collected by someone other than the user i.e. the data is already available and
analyzed by someone else. Common sources of secondary data include various published or
unpublished data, books, magazines, newspaper, trade journals etc.
Secondary data has many benefits because it is accessible and saves the researcher time and
money. However, because information is collected for purposes other than those considered,
there are disadvantages, so the usefulness of the data may be limited for a number of reasons,
including -into relevance and accuracy (Hox and Boeije, 2005).
The main differences between primary and secondary data are explained in the following
paragraphs.
1. The expression "essential information" alludes to the information that the analyst got first.
Optional information is information previously gathered by the specialists and control bodies.
2. Essential information is constant information and auxiliary information addresses the past.
3. Gather fundamental information to tackle a current issue and gather auxiliary information for
purposes other than the issue being settled.
4. Gathering fundamental information is a mind boggling measure. Then again, the auxiliary
information assortment measure is snappy and simple.
7
Paraphrase This Document
Need a fresh take? Get an instant paraphrase of this document with our AI Paraphraser
5. The primary wellsprings of information assortment incorporate studies, perceptions, tests,
surveys and individual meetings. In any case, government distributions, sites, books, magazine
articles, inside reports, and so forth They are different wellsprings of information assortment.
6. Building a great deal of assets takes a ton of assets, for example, time, cash and exertion.
Auxiliary information, then again, is generally modest and effectively open.
7. The essential information will consistently rely upon the requirements of the analyst and will
control the nature of the exploration. In any case, the auxiliary information are not identified
with the particular requirements or nature of the scientist (Cowton, 1998).
8. Essential information is given in crude configuration, while auxiliary information is essential
information in overhauled design. Optional information can be supposed to be gotten by
applying a factual strategy to essential information.
9. Information gathered from the essential source is more dependable and exact than the
auxiliary source.
Conclusion
As can be seen from the discussion above, raw data are original and unique data that researchers
have collected directly from the source according to their requirements. It's easy to access, but
has gone through a lot of statistical processing, unlike unorganized secondary data.
2. Advantages and disadvantages of primary and secondary
data
Unstructured data first collected by researchers is called primary data. The interpretation of the
primary data is largely a reference to the original and was originally created by the research
manager with a greater effort mainly to solve the "research".
Primary data collection appears to be expensive as the organizations involved are responsible for
collecting and analyzing baseline data. This data is just a secondary database obtained by
performing a series of statistical operations with this data (Rahman, 2020).
Usage data is used data that has undergone a series of statistical operations to obtain specific
information. These activities are unique and will save you time and effort. Secondary data is
8
collected from a variety of sources such as publications, internal business documents, accounts,
books, magazines, websites, and more. This data is called a reformed data format and has a lower
level of error and reliability than basic information (Cheng and Phillips, 2014).
Primary data
Advantages:
Solves specific research problems
Self-management can help identify and solve specific business problems. Collected information
is information that the researcher seeks to find and communicate in a way that is beneficial to the
particular situation in the organization (Karale, 2020).
Improved precision
Reference data is much more accurate because it is collected directly from a specific population
group.
A more significant level of control
Marketers have easy control over the design and research method. It also gives you a higher level
of control over information collection.
Real information
Basic market research is a good source of updated and updated information when collected
directly in the field in real time. Secondary data are usually less relevant and irrelevant.
Disadvantages:
More expensive
Collecting raw data can be very expensive as marketers or research teams need to start from
scratch. In other words, it is necessary to go through the whole training process and organize the
materials, processes, etc.
Time consuming
9
⊘ This is a preview!⊘
Do you want full access?
Subscribe today to unlock all pages.
Trusted by 1+ million students worldwide
End-to-end research is a very long business. This is often much longer than the time it takes to
collect secondary data.
There can be many limitations.
Basic data is limited to a specific time, place or number of servers. For comparison purposes,
supporting data may be derived from other sources to provide more detailed information.
Not always possible
For example, a lot of studios may be too big for a company.
Secondary data
Advantages
1. The first advantage of using backup data (SD) is that it always saves time. Moreover, this fact
is evident in the so-called internet age. Before that, it took him hours to find a long library aisle
to gather supportive time. New technology has changed this world. The process has been
simplified. The exact information can be found through the search engines. The Allworth Library
has digitized its collections to allow students and researchers to conduct more advanced research.
2. Fair: In the past, SD was often restricted to individual libraries or institutions. It is not always
available to the public. The internet has been particularly remarkable in this regard. Internet
access is often the only requirement for accessibility. Sometimes you can get a lot of information
with just one click. But now the question is to make sure the information is correct (Vartanian,
2010).
Disadvantages
1. Data results: data collected alone (raw data) is collected from specific observations of the
mind. In this sense, secondary data sources can provide a great deal of information, but size
doesn't mean relevance. This is because it was collected to answer other research questions or
objectives. For example, the change could be due to data collected years ago. The information
refers to the whole country when trying to study a particular area, or vice versa, nationally, but
the information comes from the area.
10
Paraphrase This Document
Need a fresh take? Get an instant paraphrase of this document with our AI Paraphraser
Lack of control over data quality: Data quality is often guaranteed by governments and other
official bodies, but this is not always the case. Therefore, you should look for quality issues as
described in this post (Cole and Trinh, 2017).
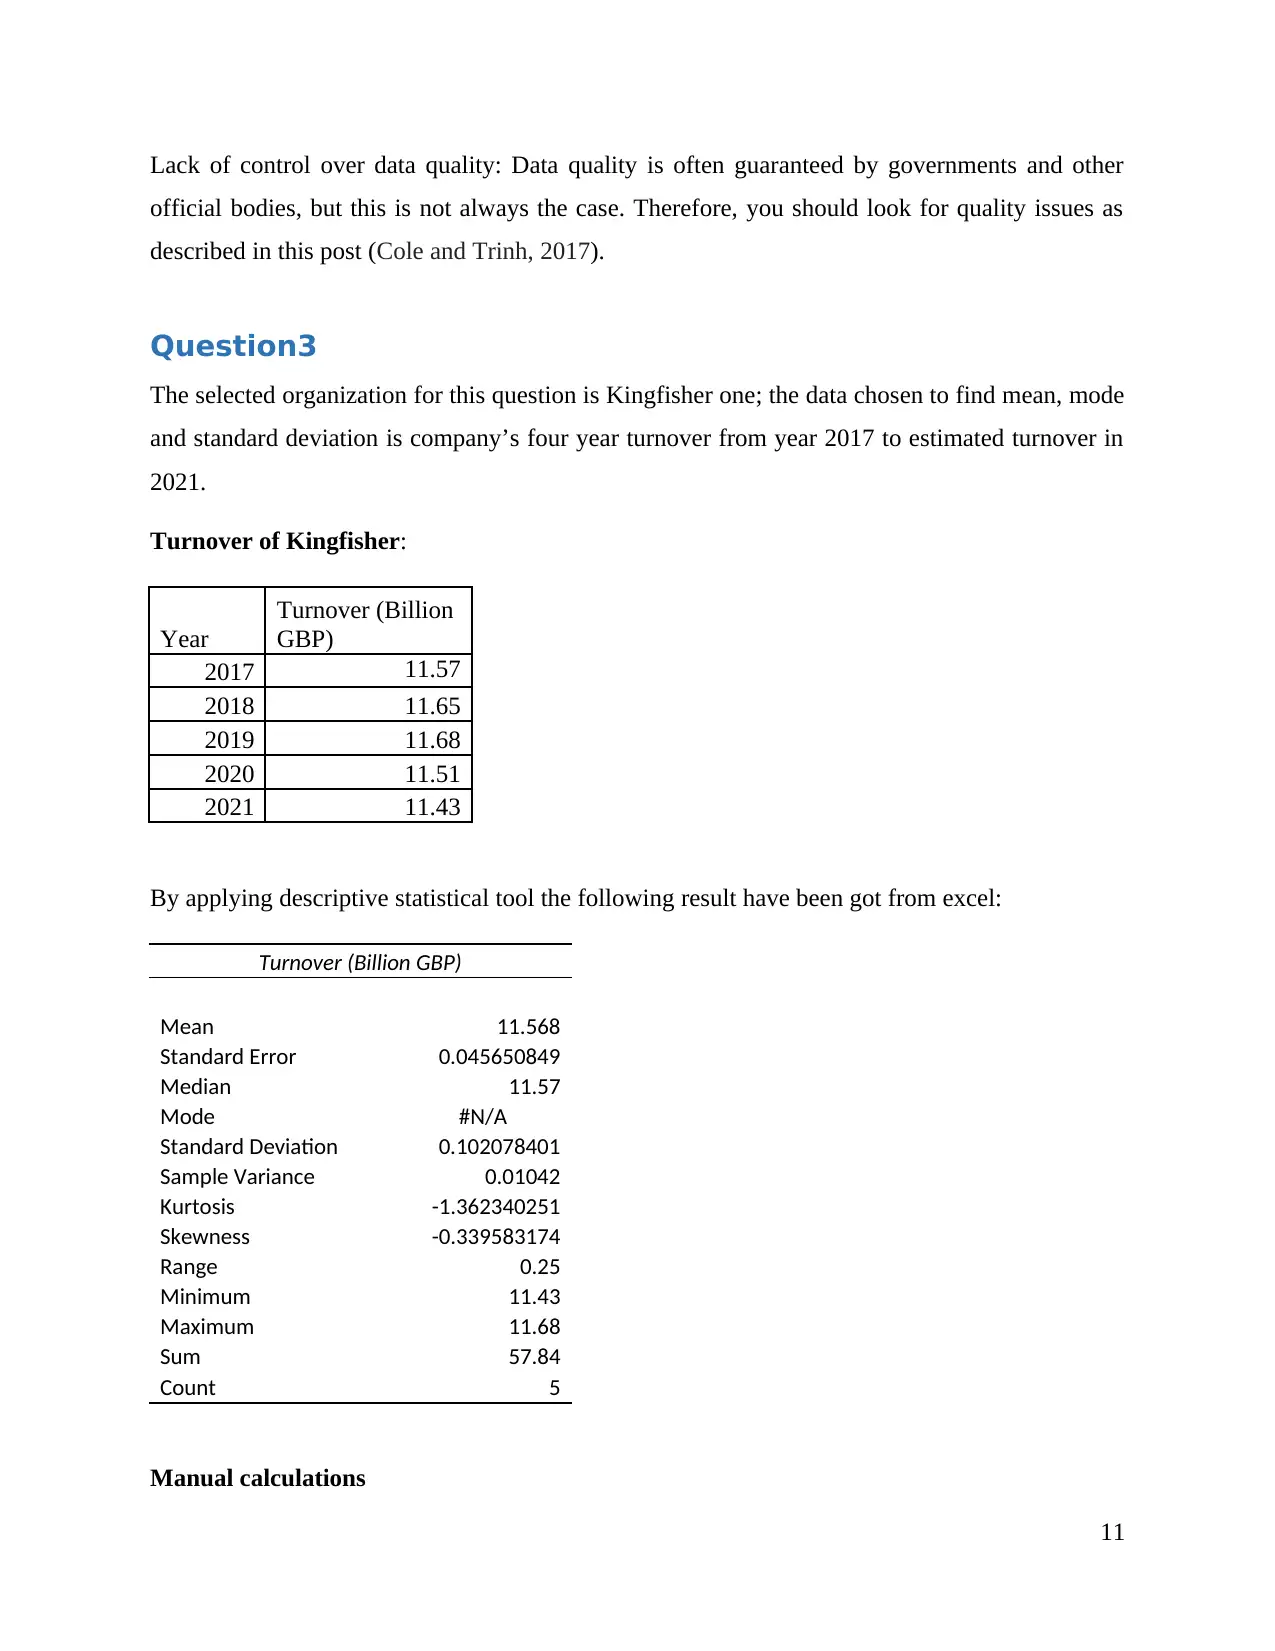
Question3
The selected organization for this question is Kingfisher one; the data chosen to find mean, mode
and standard deviation is company’s four year turnover from year 2017 to estimated turnover in
2021.
Turnover of Kingfisher:
Year
Turnover (Billion
GBP)
2017 11.57
2018 11.65
2019 11.68
2020 11.51
2021 11.43
By applying descriptive statistical tool the following result have been got from excel:
Turnover (Billion GBP)
Mean 11.568
Standard Error 0.045650849
Median 11.57
Mode #N/A
Standard Deviation 0.102078401
Sample Variance 0.01042
Kurtosis -1.362340251
Skewness -0.339583174
Range 0.25
Minimum 11.43
Maximum 11.68
Sum 57.84
Count 5
Manual calculations
11
official bodies, but this is not always the case. Therefore, you should look for quality issues as
described in this post (Cole and Trinh, 2017).
Question3
The selected organization for this question is Kingfisher one; the data chosen to find mean, mode
and standard deviation is company’s four year turnover from year 2017 to estimated turnover in
2021.
Turnover of Kingfisher:
Year
Turnover (Billion
GBP)
2017 11.57
2018 11.65
2019 11.68
2020 11.51
2021 11.43
By applying descriptive statistical tool the following result have been got from excel:
Turnover (Billion GBP)
Mean 11.568
Standard Error 0.045650849
Median 11.57
Mode #N/A
Standard Deviation 0.102078401
Sample Variance 0.01042
Kurtosis -1.362340251
Skewness -0.339583174
Range 0.25
Minimum 11.43
Maximum 11.68
Sum 57.84
Count 5
Manual calculations
11
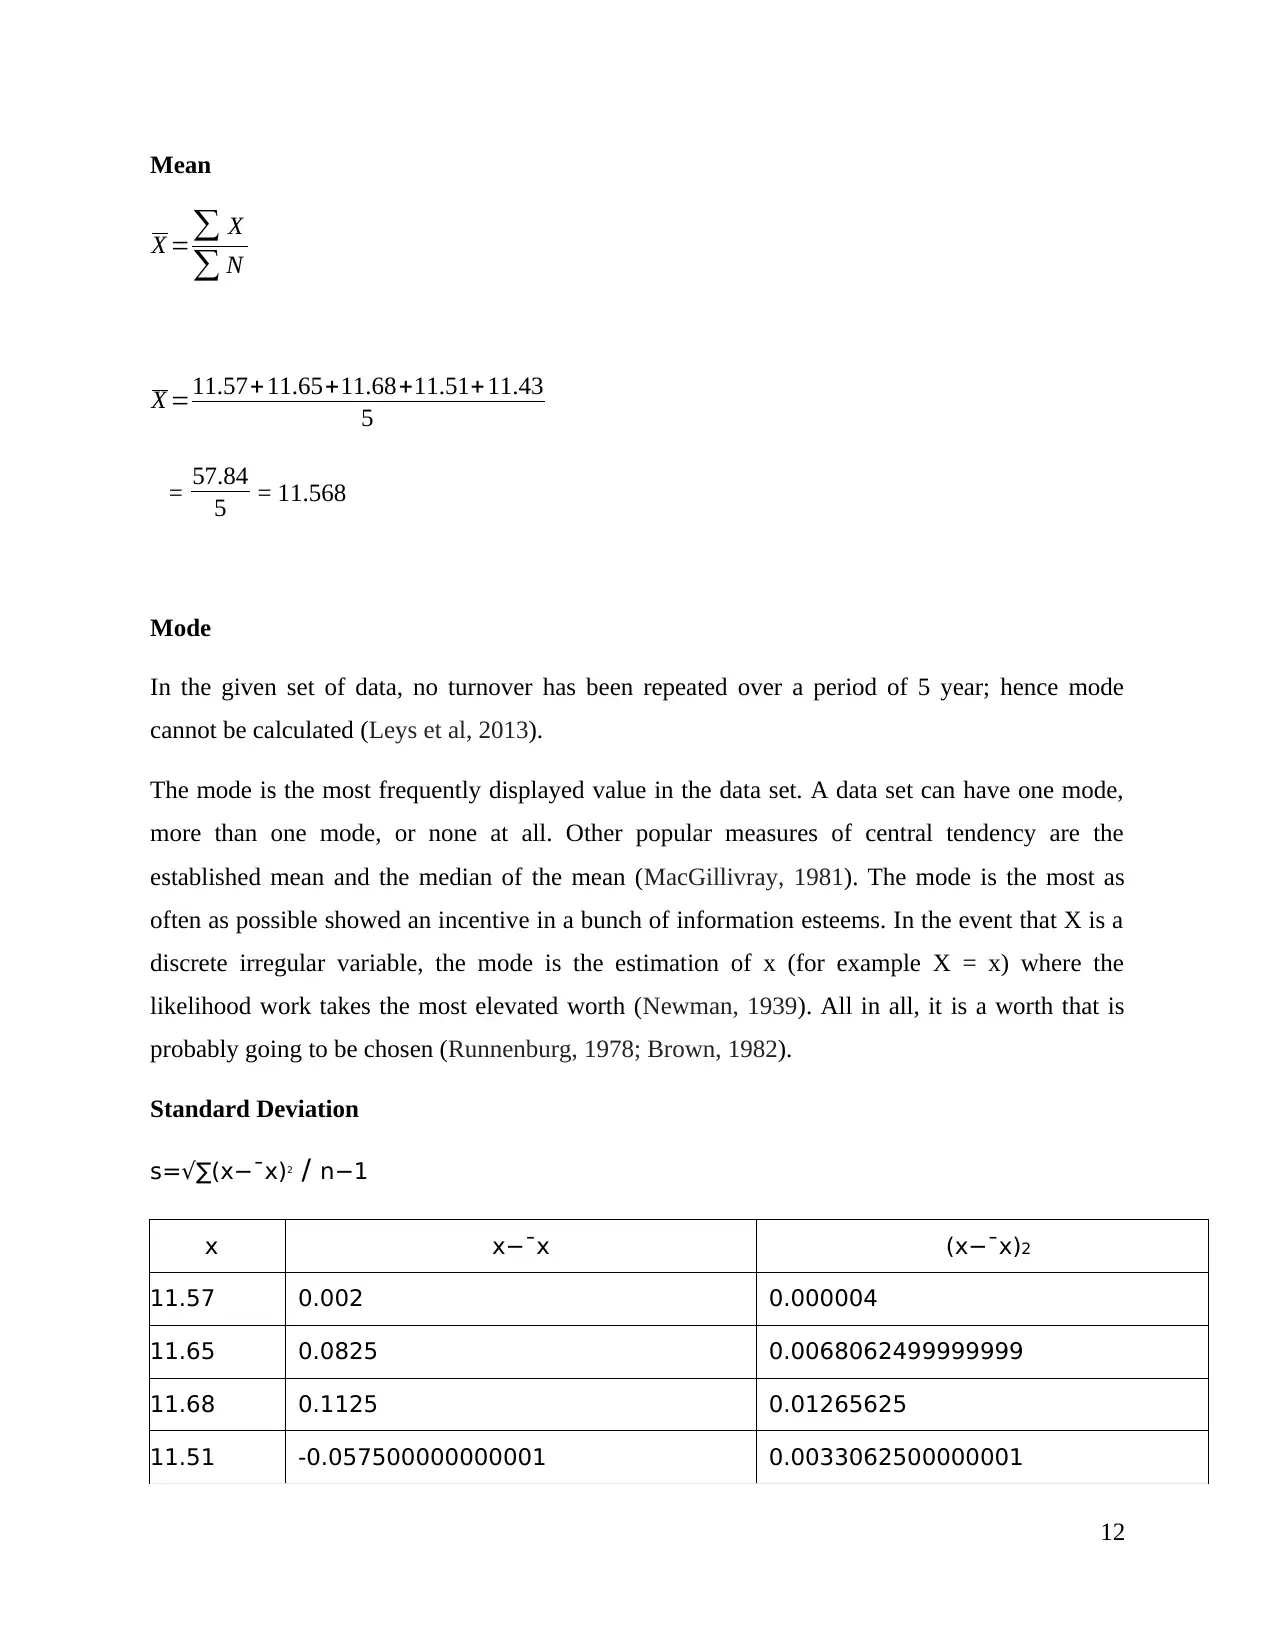
Mean
X =∑ X
∑ N
X =11.57+ 11.65+11.68+11.51+11.43
5
= 57.84
5 = 11.568
Mode
In the given set of data, no turnover has been repeated over a period of 5 year; hence mode
cannot be calculated (Leys et al, 2013).
The mode is the most frequently displayed value in the data set. A data set can have one mode,
more than one mode, or none at all. Other popular measures of central tendency are the
established mean and the median of the mean (MacGillivray, 1981). The mode is the most as
often as possible showed an incentive in a bunch of information esteems. In the event that X is a
discrete irregular variable, the mode is the estimation of x (for example X = x) where the
likelihood work takes the most elevated worth (Newman, 1939). All in all, it is a worth that is
probably going to be chosen (Runnenburg, 1978; Brown, 1982).
Standard Deviation
s=√∑(x−¯x)2 / n−1
x x−¯x (x−¯x)2
11.57 0.002 0.000004
11.65 0.0825 0.0068062499999999
11.68 0.1125 0.01265625
11.51 -0.057500000000001 0.0033062500000001
12
⊘ This is a preview!⊘
Do you want full access?
Subscribe today to unlock all pages.
Trusted by 1+ million students worldwide
1 out of 23
Related Documents


Your All-in-One AI-Powered Toolkit for Academic Success.
+13062052269
info@desklib.com
Available 24*7 on WhatsApp / Email
![[object Object]](/_next/static/media/star-bottom.7253800d.svg)
Unlock your academic potential
Copyright © 2020–2026 A2Z Services. All Rights Reserved. Developed and managed by ZUCOL.