Business Analysis Report: Debenhams Plc Case Study Analysis
VerifiedAdded on 2023/01/10
|8
|2386
|33
Report
AI Summary
This report presents a comprehensive business analysis centered around Debenhams Plc, a prominent UK retail firm. The study begins with an introduction to business analysis and its significance, followed by an in-depth examination of population significance, referencing Malthus's theory and differentiating between population and sampling. The report then explores various sampling techniques, including purposive and non-purposive methods, highlighting their importance in minimizing bias and ensuring accurate results. Furthermore, it contrasts primary and secondary data sources, outlining their advantages and disadvantages and emphasizing their complementary roles in research. The report also briefly mentions the use of quantitative measures like mean, mode, and standard deviation, along with the importance of effective management information systems in making informed business decisions. The report concludes by summarizing the key findings and their implications for Debenhams Plc's business strategies and overall success.

Business Analysis
Paraphrase This Document
Need a fresh take? Get an instant paraphrase of this document with our AI Paraphraser
Table of Contents
INTRODUCTION......................................................................................................................2
QUESTION 1.............................................................................................................................2
Significance of Population.....................................................................................................2
Significance of sampling techniques......................................................................................3
QUESTION 2.............................................................................................................................5
Difference between primary and secondary data...................................................................5
Advantage and Disadvantage of primary and secondary data...............................................6
QUESTION 3.............................................................................................................................6
Mean.......................................................................................................................................6
Mode......................................................................................................................................6
Standard deviation..................................................................................................................6
QUESTION 4.............................................................................................................................6
Importance of using effective management information system...........................................6
CONCLUSION..........................................................................................................................6
INTRODUCTION
Business analysis is a research through which companies needs are identified and
provide a solutions of a specific problem as well. These solutions may also include the
software system development component and also consist of process improvement. In the
same way, current study is based upon the case study of Debenhams Plc which is top UK
retail firm and provide best shopping experience to their customers by providing best brands.
The current study main purpose is to provide an importance of business analysis so that
company may meet the further level of success.
The study will provide the significance of using sampling technique and population
by using relevant concept and models. Further, study will describe the difference between the
primary and secondary data with their pros and cons in which concepts and theories are
applied. Further, with the help of case study, scholar also choose proper quantitative measure
in order to calculate mean, mode and standard deviation by using excel. Lastly, study will
explain the importance of effective management information system in order to make better
decision for a company by using concepts and theories.
QUESTION 1
Significance of Population
While conducting a survey, populations plays an important role because it is an actual
population from which the survey data are collected from the data collection operations. In
the same way, when survey is conducted of the fellow colleagues to determine their response
of introducing a holiday pay scheme, researcher have to select the best sample from the
population (Wang and et.al., 2017). As it is not possible to involve entire population to get
their response and that is why, some are selected from a range of population. So, population
is refers as a number of people in a particular place.
Malthus’ Theory is consider the best theory for population which was introduced by
Thomas Robert Malthus who was a key figure to determine the population statistic which can
be used for conducting survey. The theory is fall under the principle such that there is a
strong attraction of two gender and thus, population could also be increased by multiples in
many years (Ernsting and et.al., 2017). Even there are many author who also criticize, as a
result, many new theories are further developed in order to examine the correct concepts.
⊘ This is a preview!⊘
Do you want full access?
Subscribe today to unlock all pages.
Trusted by 1+ million students worldwide
Moreover, there is a big difference between the population and sampling such that
population is a broader group of people from which researcher collect the answer and the
population will depend upon the scope of a study. In the presence scenario, for conducting a
survey, some sample is selected form the population and here population is the fellow
colleagues who provide answer whether holiday pay scheme is good or not. Even there are
many characteristic of population such that age, location, socio- economic data and race. So it
is depend upon the study through which sample is selected from the population size
(Formeister and et.al., 2018). Or else it can be stated that population can thus be said to be an
aggregate observation of subjects grouped together by a common feature.
In addition to this, the concept of a population also shows that unlike a sample, when
carrying out a statistical analysis of a population, there is no standard error to report because
such error inform the analysts using a sample how far their estimate may deviate the true
population. That is why, it can be vague or specific, which is based upon the need or scope of
a study (Shuva and et.al., 2016). For example, if a company wanted to know whether their all
customer are satisfied with the offered service and product and there are around more than
50000 customers. So it is quite challenging for the company to get answer from all, that is
why, survey is conducted in which sample is selected by using appropriate sampling
techniques that help to determine the answer. In this situation, 50000 is termed as a
population whereas, selected respondents for survey is known as sample size. Therefore, it is
clearly reflected that population is an aggregated observation of subjects that is grouped
together by a common feature.
Significance of sampling techniques
To conduct a survey, it is essential for the investigator to have a good knowledge of a
sampling technique because it is not possible to select entire population, so sample size is
selected by using techniques. Also, there are different sampling techniques available for the
qualitative as well as quantitative study. Sampling and sampling techniques are consider
important element of a primary research because it is impossible to conduct survey from an
entire population and thus to make sure that people in sample reflect the population or else
mislead the results too (Taherdoost, 2016). That is why, with the help of sampling and
sampling techniques, bias can be minimized and also investigator get their accurate results as
well. As there are two sampling techniques such that purposive and non- purposive.
Paraphrase This Document
Need a fresh take? Get an instant paraphrase of this document with our AI Paraphraser
Under purposive sampling technique, researcher completely relies upon the own
judgment while choosing members of a population to participate in a study. Also, the
significance of using this method is such that it is focus on the particular characteristic of a
population i.e. interest which assist the researcher to answer the research questions. This
method is used under qualitative as well as quantitative study, and the logic behind using this
sampling technique is to extract the sample from a population. On the other side, it is also
critically evaluated that under this sampling techniques there is a low level of reliability and
high level of bias but it help to generalize the results findings by getting proper results.
On the other side, non- purposive sampling technique is that sampling technique
where researcher select sample that is based upon the subjective judgment of a researcher
instead of random selection (Etikan, Alkassim and Abubakar, 2016). This method is cost and
time effective, it is simple to use as compared to probability method. Even it also have some
types which can be used by the researcher i.e. quote sampling, convenience sampling,
purposive sampling and snowball. These type of methods are used when researcher is based
upon quantitative study. This type of sampling method is used when member of population
are chosen during haphazard or accidental sampling. This is clearly stated that when a
researcher need to observe some specific issue in depth, they generally applied this method
and it is aim at conducting pilot studies mainly.
Also, as per the requirement, in order to conduct the survey of the fellow colleagues
to get the response of possibility of introducing a holiday pay scheme, researcher is selected
simple random sampling method in which some colleagues are selected through which
scholar get the answer in better manner. Moreover, purposive sampling method is selected
when investigator have only limited number of primary data sources who can easily
contribute to the study. That is why, as per the define task, it is clearly mention to collect
information from the fellow and as there is a limited source of primary data collection
method and that is why, it is essential to use the same (Leevy and et.al., 2018). On the other
hand, another importance of using this sampling technique which help to conduct the study
more effective is such that it develop the best meaning which will definitely benefit from an
intuitive approach and this in turn assist to collect the answer in better manner. Overall, it is
clearly analyzed that in order to reduce the sampling bias and also create accurate results
probability or purposive sampling technique is used that assist to provide a chance to
everyone in a population in order to provide best results.
QUESTION 2
Difference between primary and secondary data
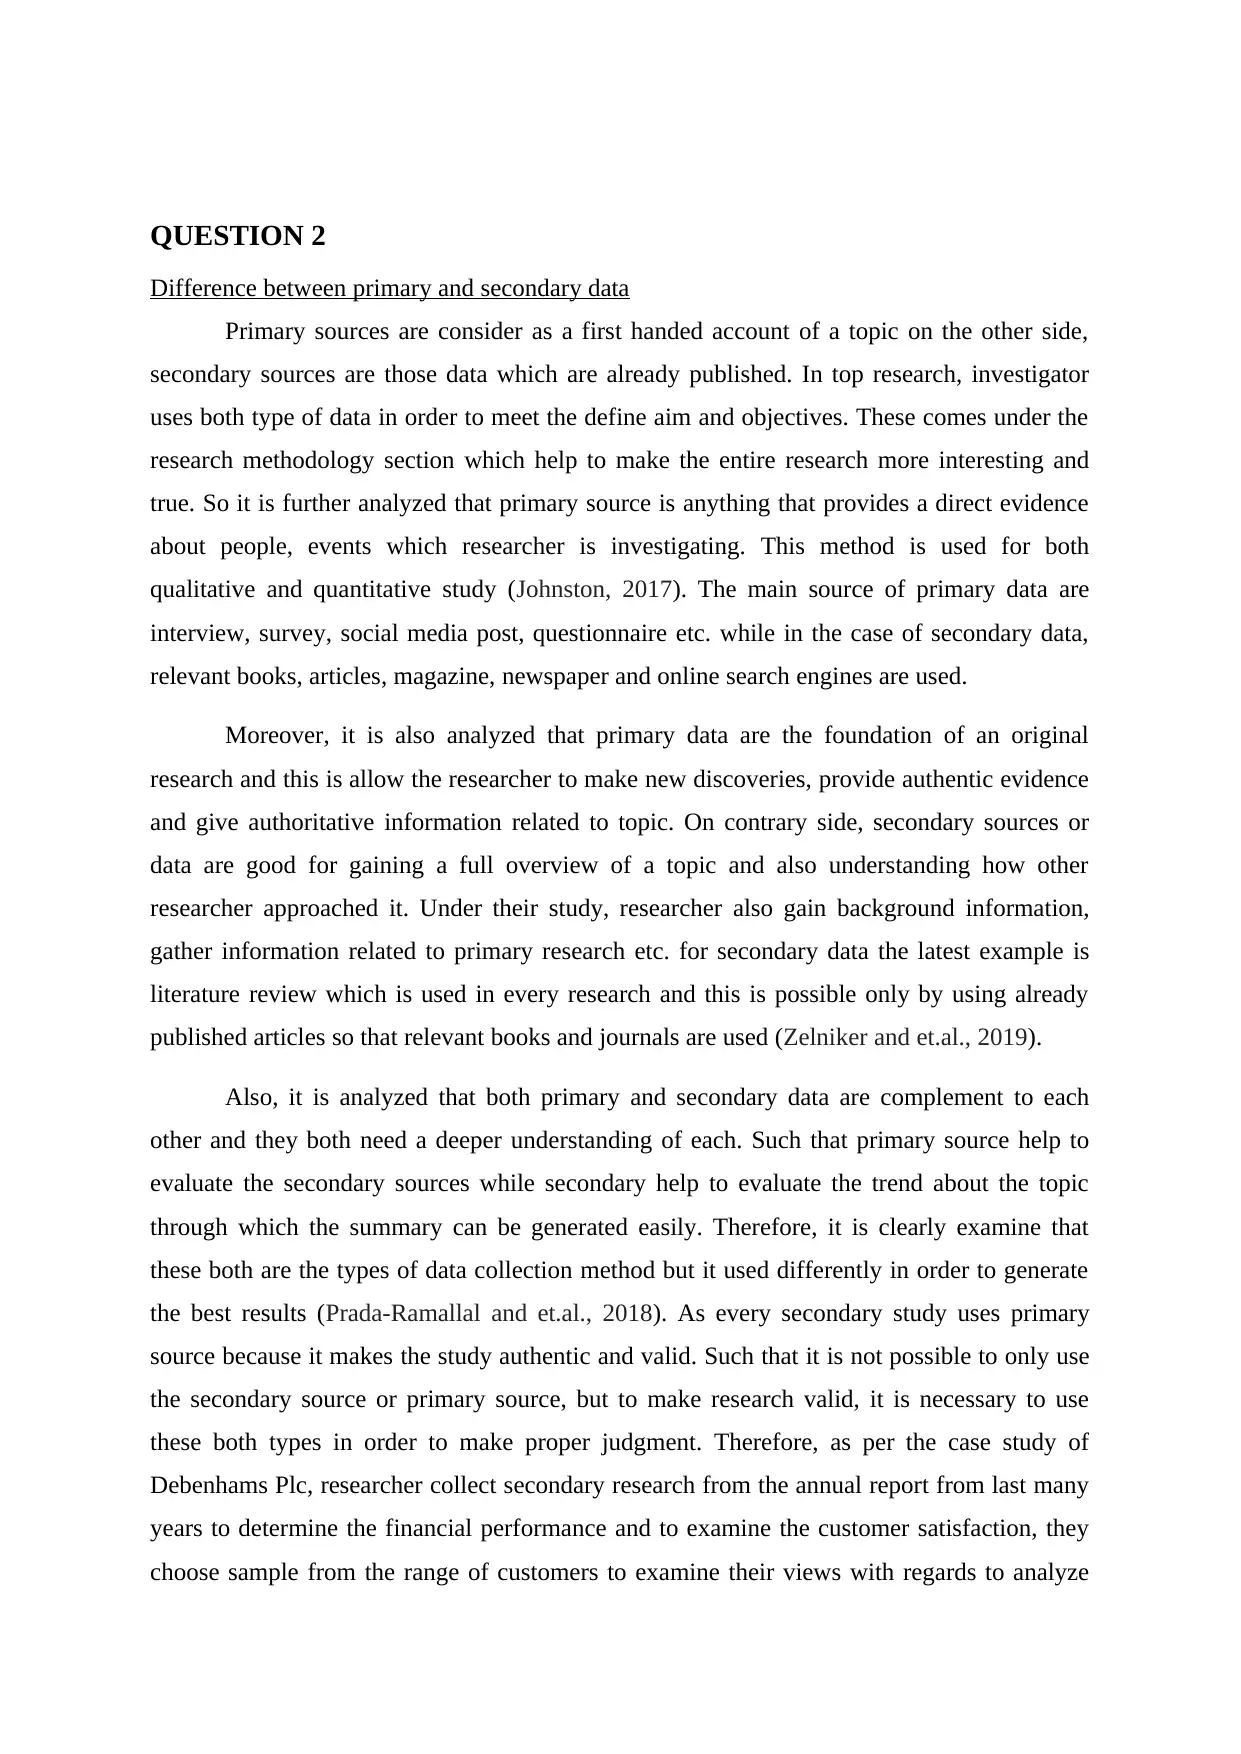
Primary sources are consider as a first handed account of a topic on the other side,
secondary sources are those data which are already published. In top research, investigator
uses both type of data in order to meet the define aim and objectives. These comes under the
research methodology section which help to make the entire research more interesting and
true. So it is further analyzed that primary source is anything that provides a direct evidence
about people, events which researcher is investigating. This method is used for both
qualitative and quantitative study (Johnston, 2017). The main source of primary data are
interview, survey, social media post, questionnaire etc. while in the case of secondary data,
relevant books, articles, magazine, newspaper and online search engines are used.
Moreover, it is also analyzed that primary data are the foundation of an original
research and this is allow the researcher to make new discoveries, provide authentic evidence
and give authoritative information related to topic. On contrary side, secondary sources or
data are good for gaining a full overview of a topic and also understanding how other
researcher approached it. Under their study, researcher also gain background information,
gather information related to primary research etc. for secondary data the latest example is
literature review which is used in every research and this is possible only by using already
published articles so that relevant books and journals are used (Zelniker and et.al., 2019).
Also, it is analyzed that both primary and secondary data are complement to each
other and they both need a deeper understanding of each. Such that primary source help to
evaluate the secondary sources while secondary help to evaluate the trend about the topic
through which the summary can be generated easily. Therefore, it is clearly examine that
these both are the types of data collection method but it used differently in order to generate
the best results (Prada-Ramallal and et.al., 2018). As every secondary study uses primary
source because it makes the study authentic and valid. Such that it is not possible to only use
the secondary source or primary source, but to make research valid, it is necessary to use
these both types in order to make proper judgment. Therefore, as per the case study of
Debenhams Plc, researcher collect secondary research from the annual report from last many
years to determine the financial performance and to examine the customer satisfaction, they
choose sample from the range of customers to examine their views with regards to analyze
Difference between primary and secondary data
Primary sources are consider as a first handed account of a topic on the other side,
secondary sources are those data which are already published. In top research, investigator
uses both type of data in order to meet the define aim and objectives. These comes under the
research methodology section which help to make the entire research more interesting and
true. So it is further analyzed that primary source is anything that provides a direct evidence
about people, events which researcher is investigating. This method is used for both
qualitative and quantitative study (Johnston, 2017). The main source of primary data are
interview, survey, social media post, questionnaire etc. while in the case of secondary data,
relevant books, articles, magazine, newspaper and online search engines are used.
Moreover, it is also analyzed that primary data are the foundation of an original
research and this is allow the researcher to make new discoveries, provide authentic evidence
and give authoritative information related to topic. On contrary side, secondary sources or
data are good for gaining a full overview of a topic and also understanding how other
researcher approached it. Under their study, researcher also gain background information,
gather information related to primary research etc. for secondary data the latest example is
literature review which is used in every research and this is possible only by using already
published articles so that relevant books and journals are used (Zelniker and et.al., 2019).
Also, it is analyzed that both primary and secondary data are complement to each
other and they both need a deeper understanding of each. Such that primary source help to
evaluate the secondary sources while secondary help to evaluate the trend about the topic
through which the summary can be generated easily. Therefore, it is clearly examine that
these both are the types of data collection method but it used differently in order to generate
the best results (Prada-Ramallal and et.al., 2018). As every secondary study uses primary
source because it makes the study authentic and valid. Such that it is not possible to only use
the secondary source or primary source, but to make research valid, it is necessary to use
these both types in order to make proper judgment. Therefore, as per the case study of
Debenhams Plc, researcher collect secondary research from the annual report from last many
years to determine the financial performance and to examine the customer satisfaction, they
choose sample from the range of customers to examine their views with regards to analyze
⊘ This is a preview!⊘
Do you want full access?
Subscribe today to unlock all pages.
Trusted by 1+ million students worldwide
whether company offer the best range of product to customer or not. So, it is clearly
determine that there is a use of both data in order to make the study valid and true.
Advantage and Disadvantage of primary and secondary data
QUESTION 3
Mean
Mode
Standard deviation
QUESTION 4
Importance of using effective management information system
CONCLUSION
determine that there is a use of both data in order to make the study valid and true.
Advantage and Disadvantage of primary and secondary data
QUESTION 3
Mean
Mode
Standard deviation
QUESTION 4
Importance of using effective management information system
CONCLUSION
Paraphrase This Document
Need a fresh take? Get an instant paraphrase of this document with our AI Paraphraser
REFERENCES
Books and Journals
Ernsting, C. and et.al., 2017. Using smartphones and health apps to change and manage
health behaviors: a population-based survey. Journal of medical Internet
research. 19(4). p.e101.
Etikan, I., Alkassim, R. and Abubakar, S., 2016. Comparision of snowball sampling and
sequential sampling technique. Biometrics and Biostatistics International
Journal. 3(1). p.55.
Formeister, E.J. and et.al., 2018. The epidemiology of vestibular migraine: a population-
based survey study. Otology & Neurotology. 39(8). pp.1037-1044.
Johnston, M.P., 2017. Secondary data analysis: A method of which the time has
come. Qualitative and quantitative methods in libraries. 3(3). pp.619-626.
Leevy, J.L. and et.al., 2018. A survey on addressing high-class imbalance in big
data. Journal of Big Data. 5(1). p.42.
Prada-Ramallal, G. and et.al., 2018. Primary versus secondary source of data in observational
studies and heterogeneity in meta-analyses of drug effects: a survey of major medical
journals. BMC medical research methodology. 18(1). p.97.
Shuva, M.A.H. and et.al., 2016. Thermodynamics data of valuable elements relevant to e-
waste processing through primary and secondary copper production: a review. Journal
of cleaner production. 131. pp.795-809.
Taherdoost, H., 2016. Sampling methods in research methodology; how to choose a sampling
technique for research. How to Choose a Sampling Technique for Research (April 10,
2016).
Wang, W. and et.al., 2017. Prevalence, incidence, and mortality of stroke in China: results
from a nationwide population-based survey of 480 687 adults. Circulation. 135(8).
pp.759-771.
Zelniker, T.A. and et.al., 2019. SGLT2 inhibitors for primary and secondary prevention of
cardiovascular and renal outcomes in type 2 diabetes: a systematic review and meta-
analysis of cardiovascular outcome trials. The Lancet.393(10166). pp.31-39.
1 out of 8
Related Documents


Your All-in-One AI-Powered Toolkit for Academic Success.
+13062052269
info@desklib.com
Available 24*7 on WhatsApp / Email
![[object Object]](/_next/static/media/star-bottom.7253800d.svg)
Unlock your academic potential
Copyright © 2020–2026 A2Z Services. All Rights Reserved. Developed and managed by ZUCOL.