Business Analysis: Decision-Making Under Uncertainty and Risk Analysis

Verified

Added on  2023/03/29

|12
|1379
|176
Homework Assignment
AI Summary
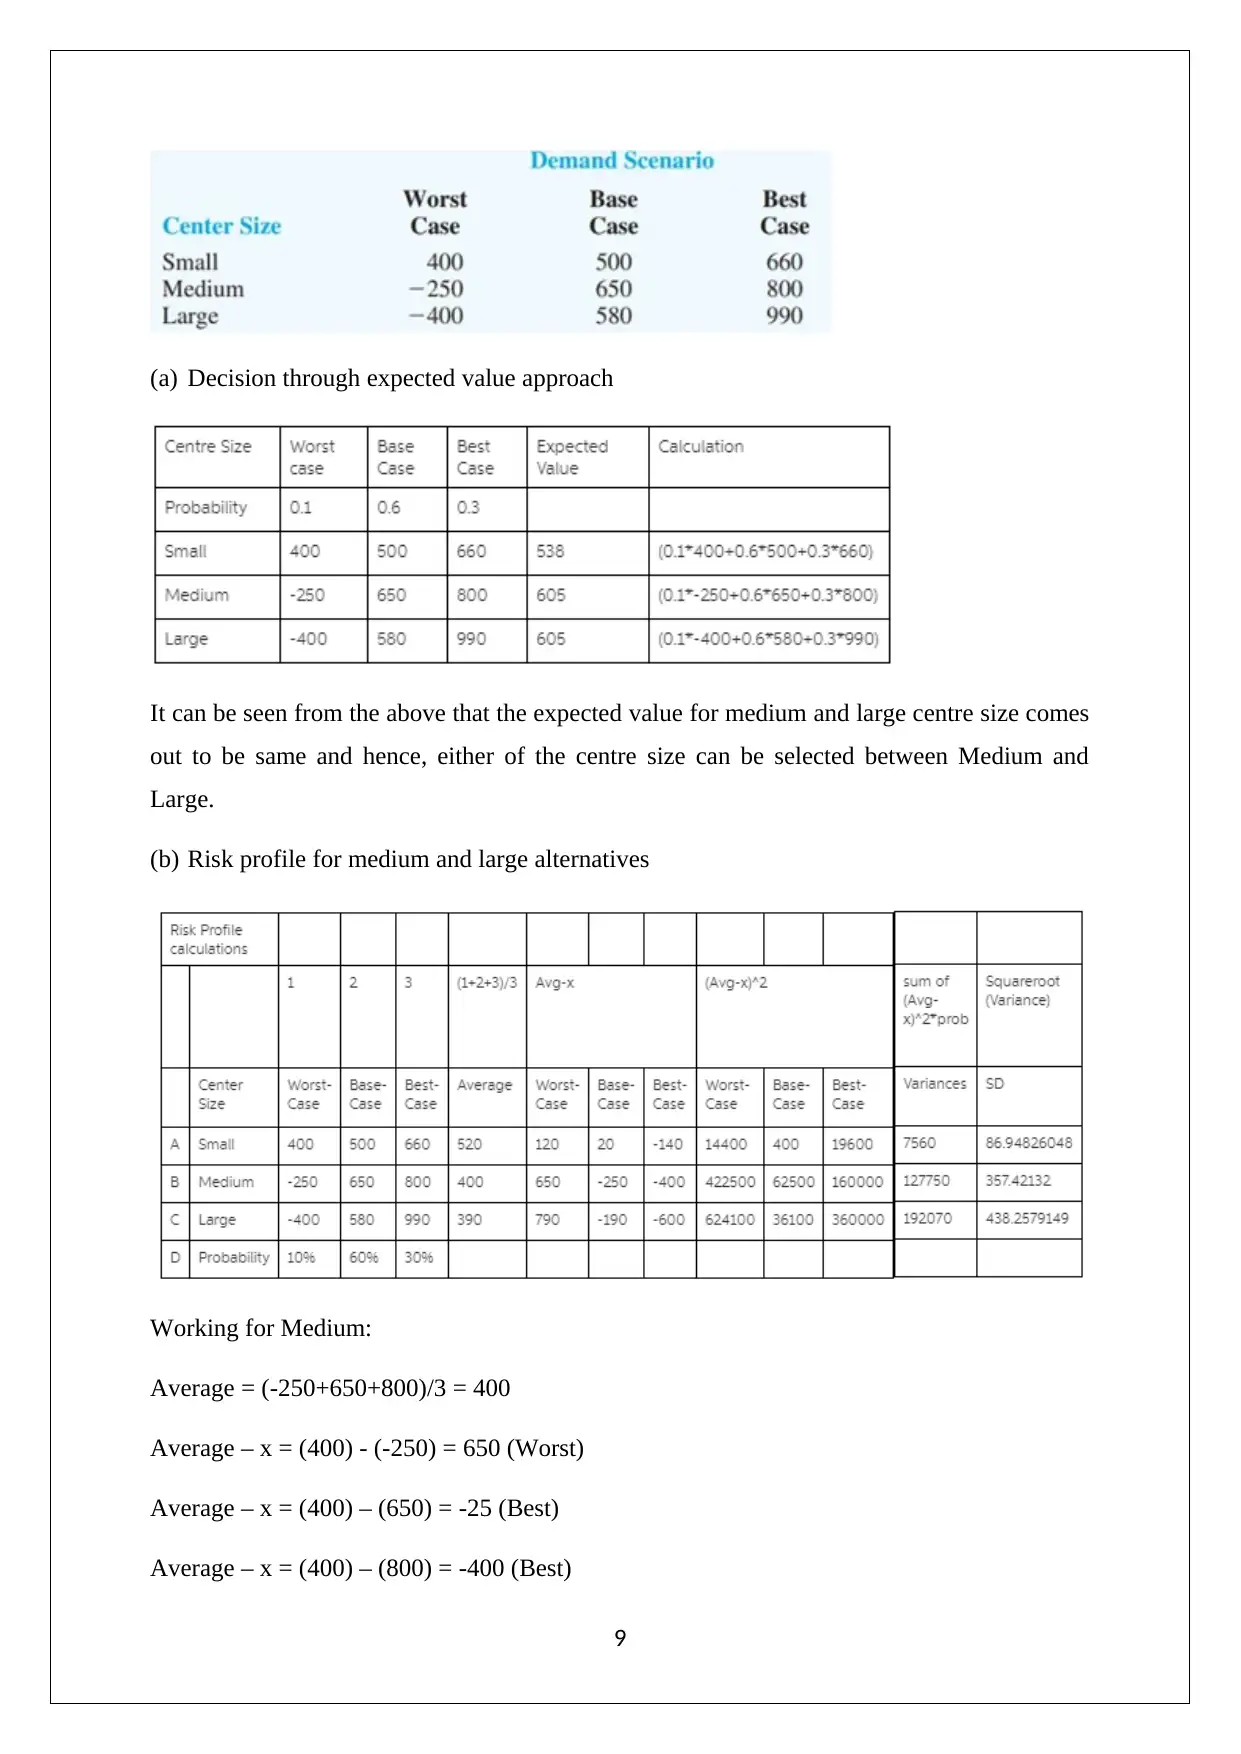
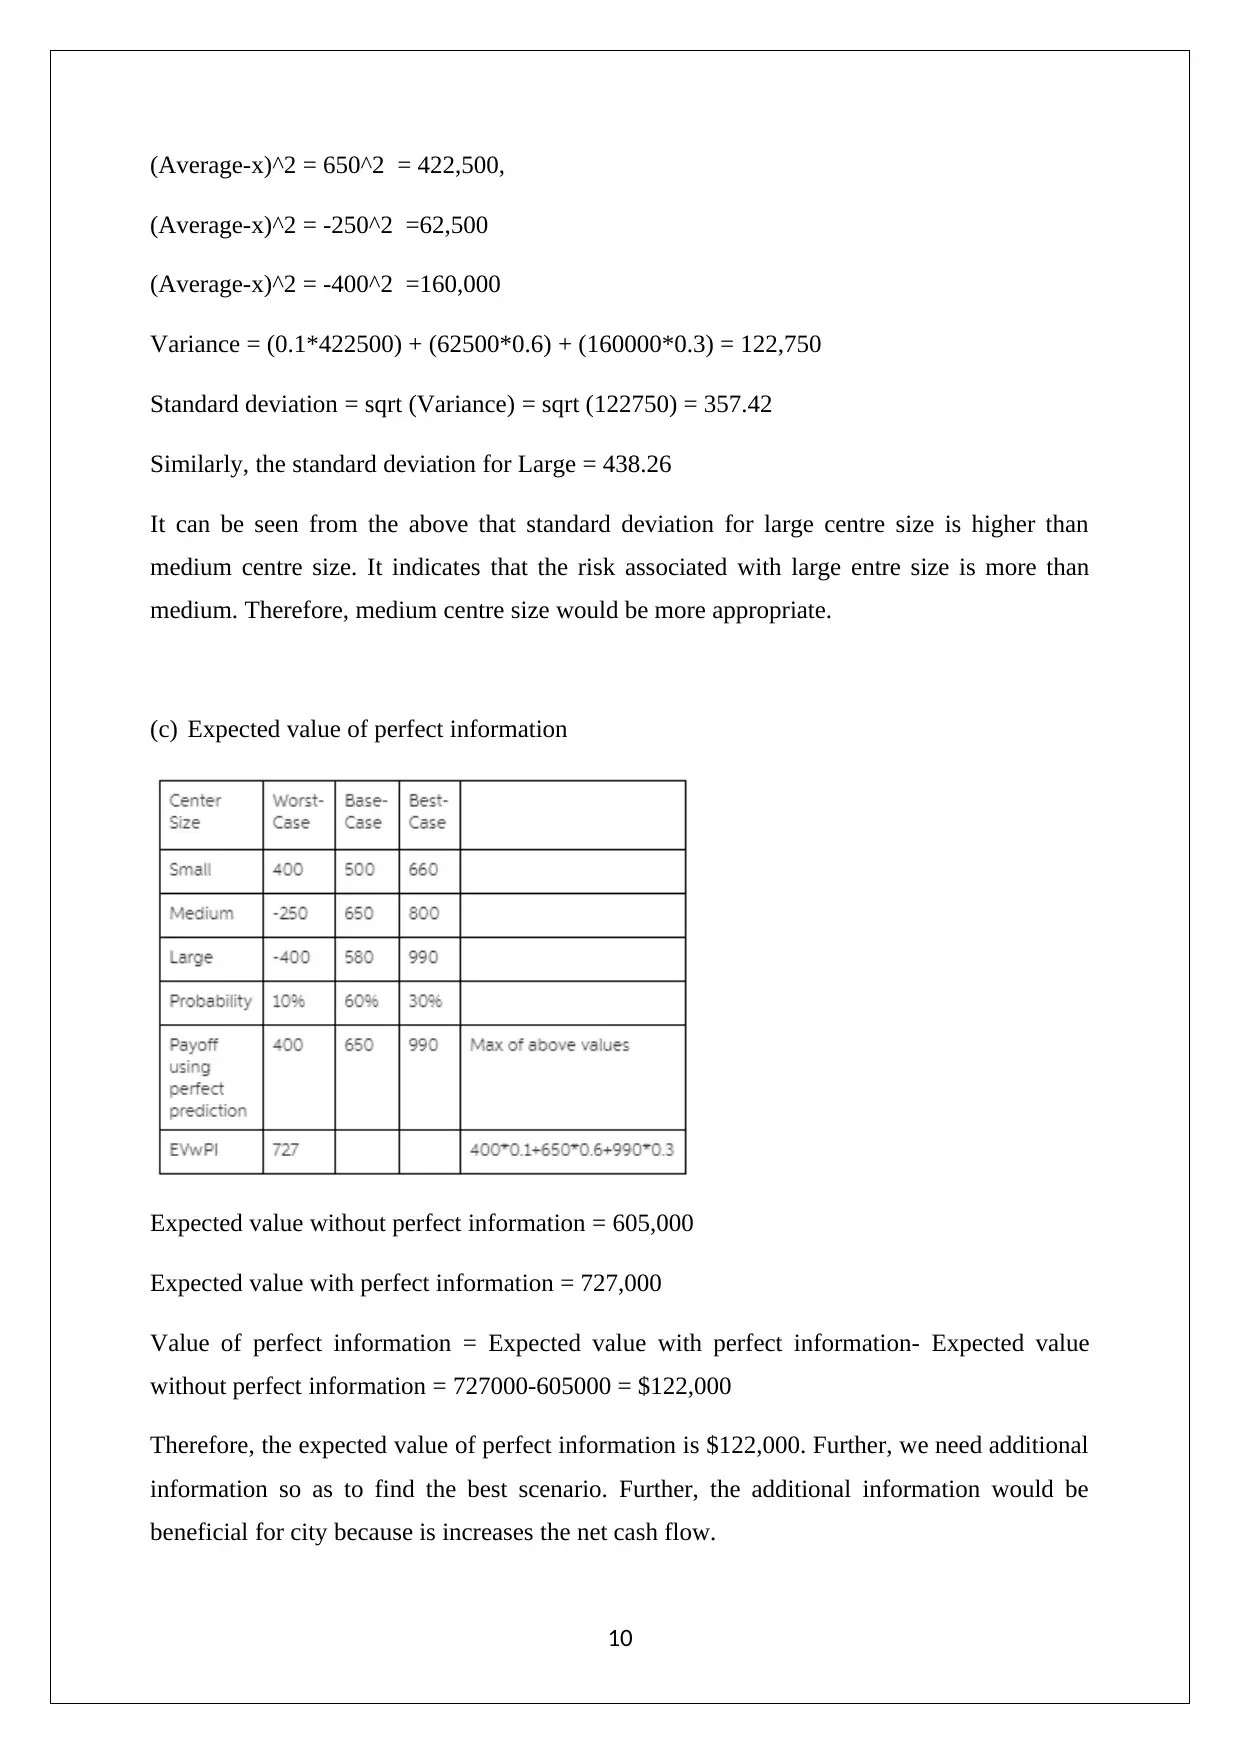
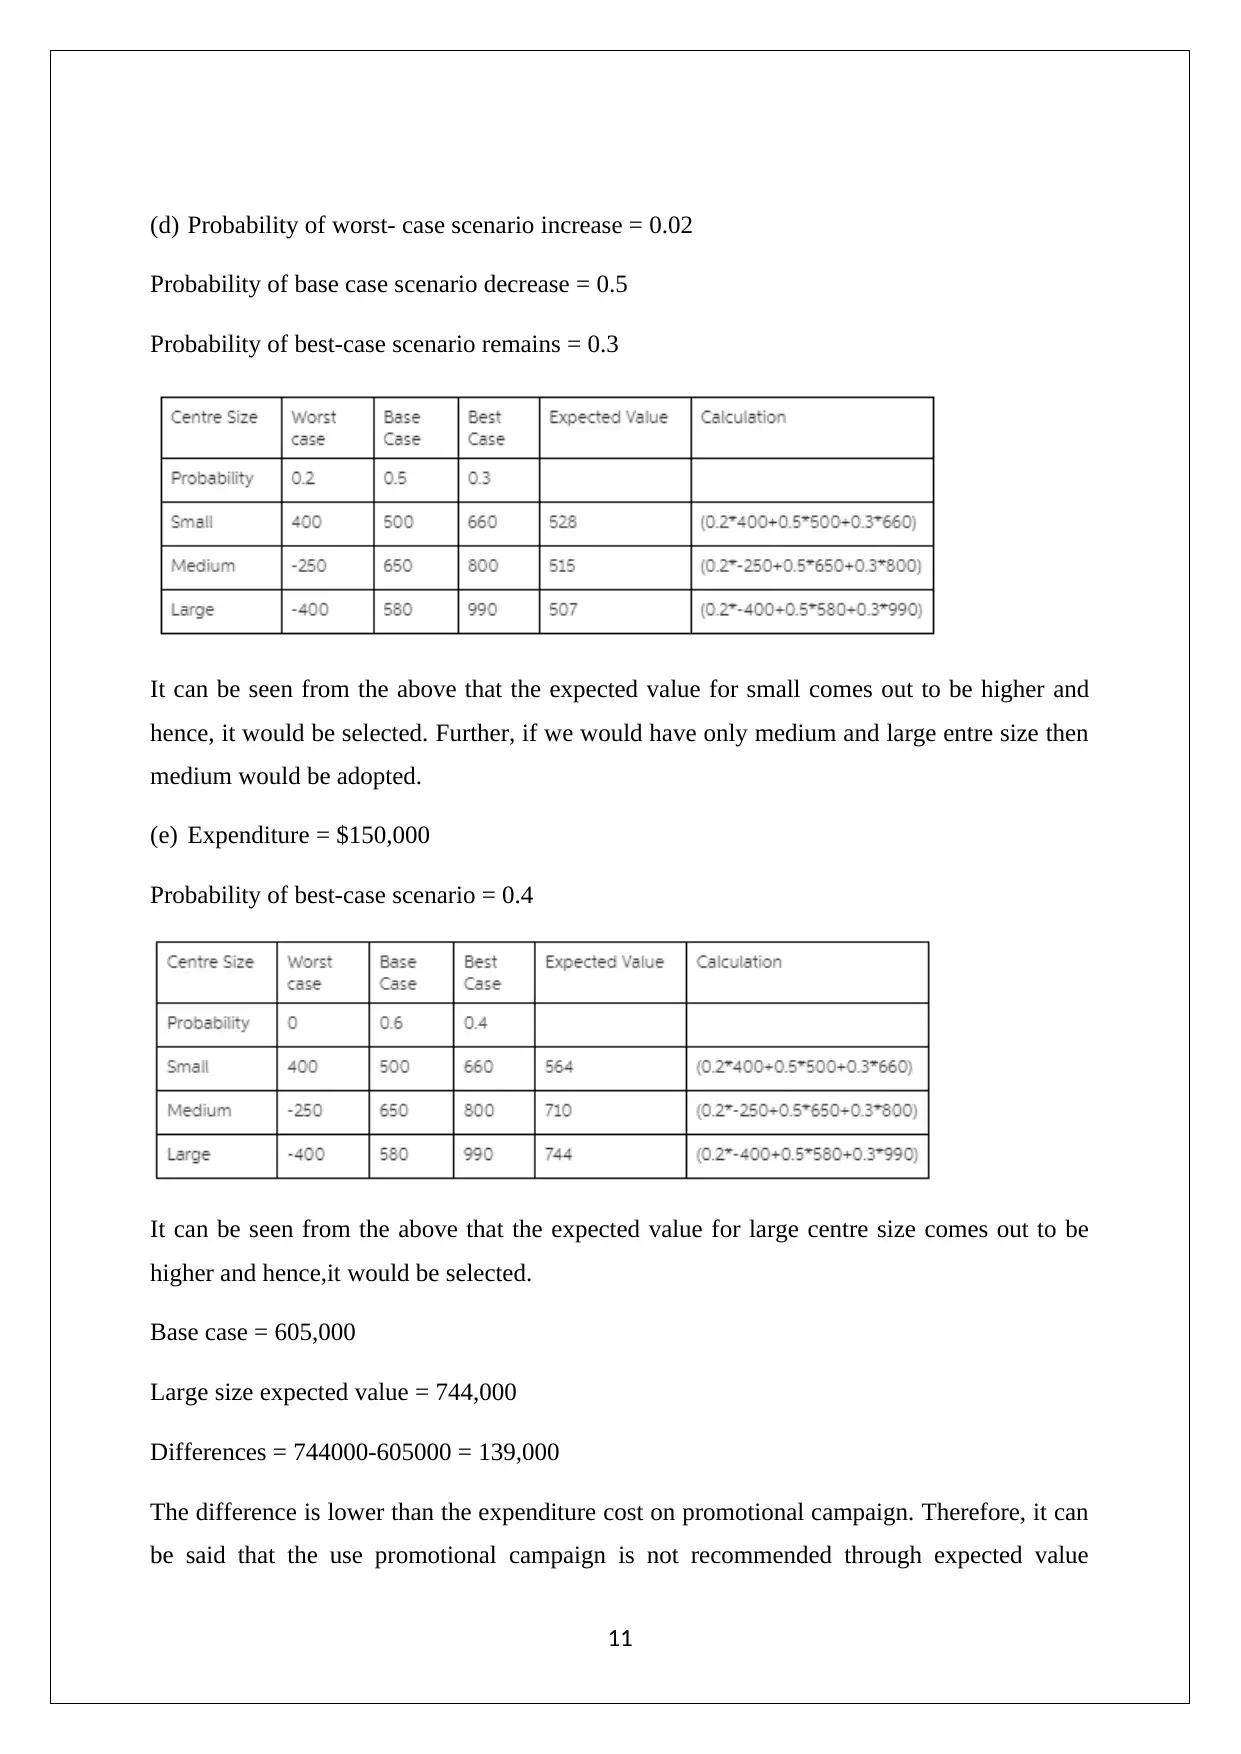
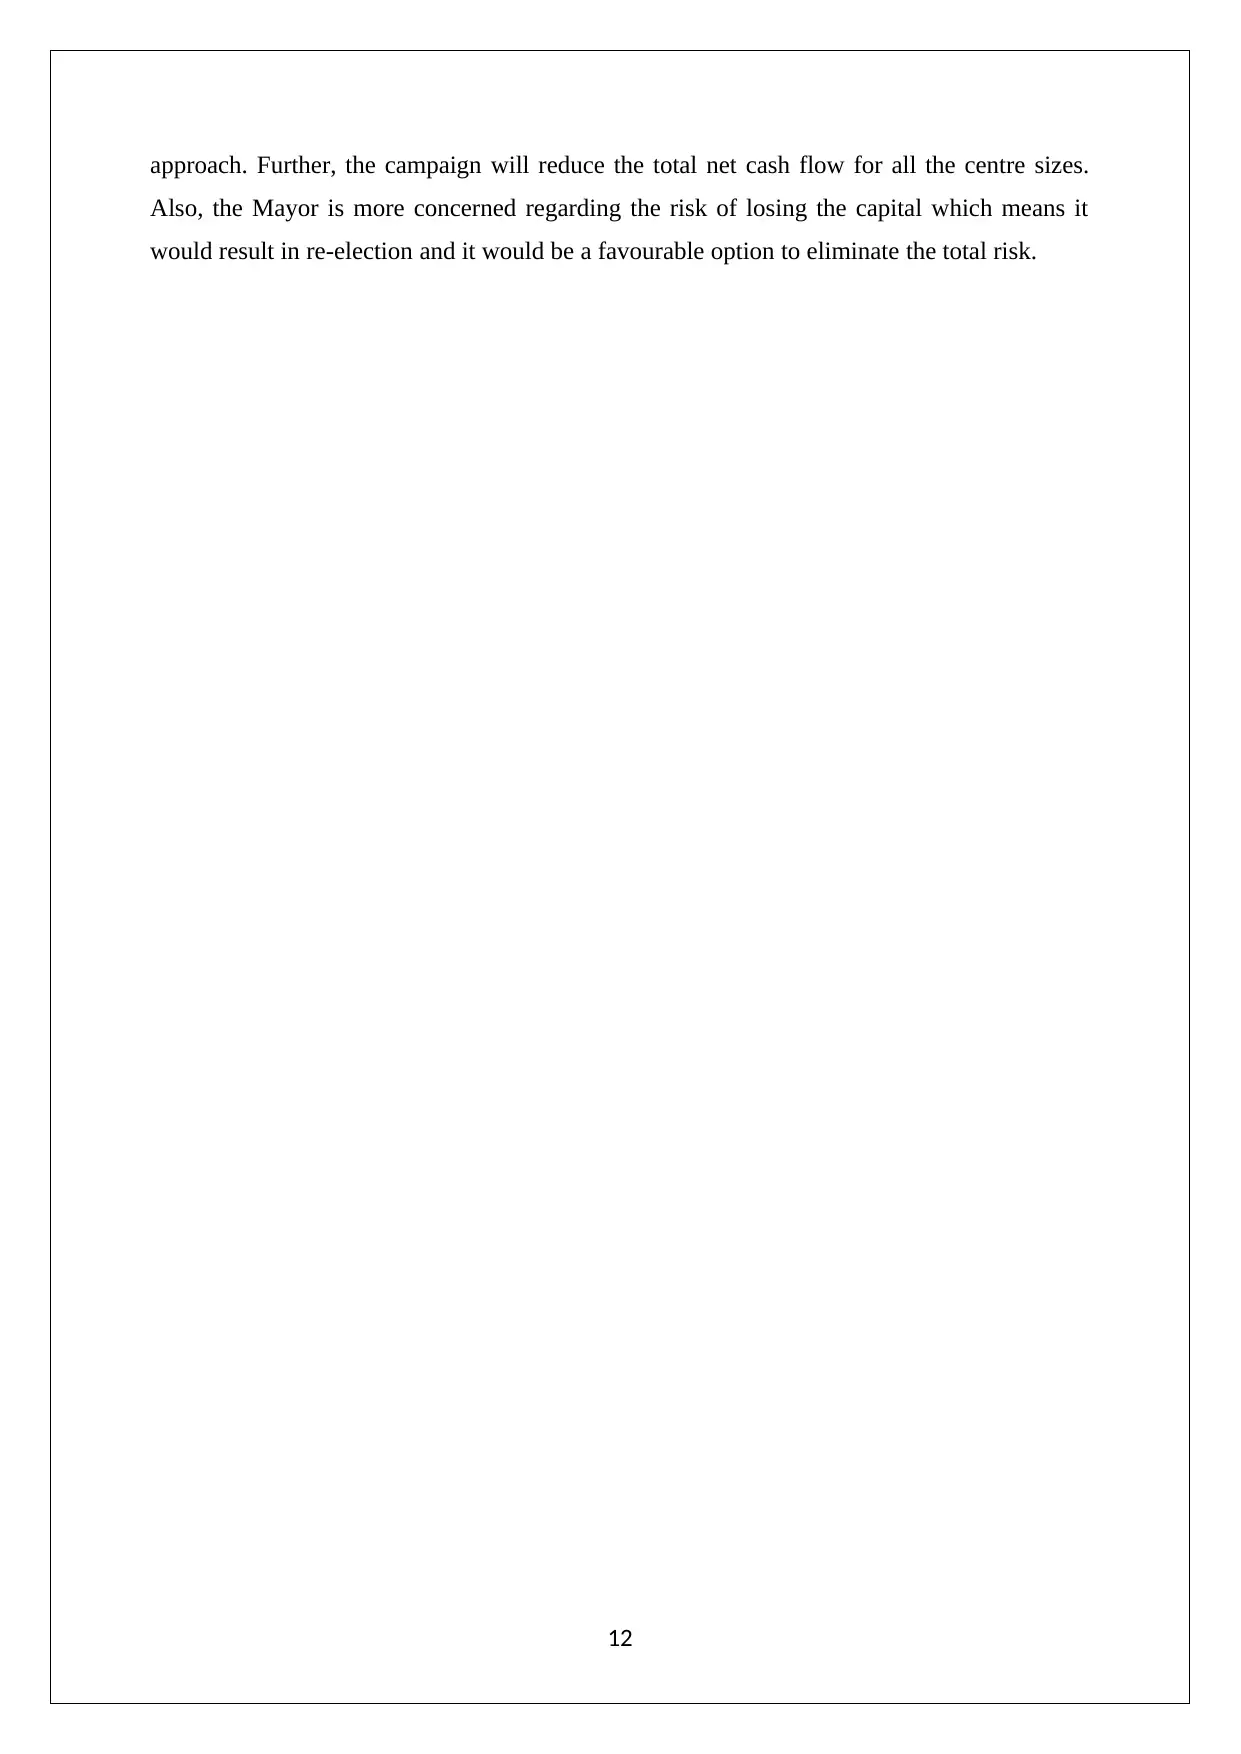
This assignment provides solutions to several business analysis questions related to decision-making under uncertainty. It covers topics such as optimistic, conservative, and minimax regret approaches, graphical sensitivity analysis, expected value approach, and risk profile analysis. The solutions demonstrate how to determine optimal decisions in various scenarios, including those with perfect information and promotional campaigns. The analysis includes calculations for expected values, standard deviations, and the value of perfect information, offering a comprehensive understanding of decision-making strategies in a business context. Desklib is a valuable resource for students seeking similar solved assignments and past papers.
Document Page
BUSINESS ANALYSIS
STUDENT ID:
[Pick the date]
tabler-icon-diamond-filled.svg

Paraphrase This Document

Need a fresh take? Get an instant paraphrase of this document with our AI Paraphraser
Document Page
Question 2
Profit payoff table for state of nature and decision alternatives is represented below.
(a) Recommended decision using optimistic, conservative and minimax regret approach
Optimistic Approach: Maximax
Decision D1 is considered to be more appropriate decision for the optimistic approach.
Conservative Approach: Maximin
Decision D3 is considered to be more appropriate decision for the conservative approach.
Minimax regret approach: Minimax of the losses
(Subtracting the payoffs from each element)
2
Document Page
Decision 2 and Decision 3, would be more appropriate decision through minimax regret
approach.
(b) The minimax decision procedure is taken into account.
Decision 1 would be used which means optimist approach would be taken into consideration.
(c) When payoff table provides the cost rather than profit, then the recommended decision
using optimistic, conservative and minimax regret approach needs to be determined.
Optimistic Approach: Maximax
Decision 3 would be more appropriate decision.
Conservative Approach: Maximin
Decision 2 and Decision 3 would be more appropriate decision.
Minimax regret approach: Minimax of the losses
S1 S2 S3 S4 Max Regret
D1 6 0 2 0 6
D2 3 1 0 2 3
3
Document Page
D3 1 2 2 6 6
D4 0 1 3 8 8
Decision 2 would be more appropriate decision
Question 8
Payoff table to represent the profit for state of nature and decision alternatives is represented
below.
(a) Graphical sensitivity analysis
Plot to show the expected value lines
Left and right side of alternative shows state of nature
Maximum probability would be 1 and thus, x axis would range between 0 and 1.
Equation for D1 = 2 + (10-2) p = 2 +8P
4
tabler-icon-diamond-filled.svg

Paraphrase This Document

Need a fresh take? Get an instant paraphrase of this document with our AI Paraphraser
Document Page
Equation for D2 = 3+ (4-3) p = 3+P
Now, at intersection equation for D1 would be same as equation for D2
2+8 P=3+P
P=0.142
Therefore,
D1 would be best option decision for range of P more than 0.142 whereas, D2 would be best
optimal decision for range of P lower than 0.412.
(b) Best decision using expected value approach
Expected value of D1 = 10*0.2 + 0.8*1 = 2.8
Expected value of D2 = 4*0.2 + 3*0.8 = 3.2
As, decision D2’s expected value is more and hence, the best decision using expected value
approach would be D2.
(c) Best decision from part (b) is D2 and the expected value of D1 is lower than or equal to
2.8
Let
Payoff for D2 = s
State of nature = S1
Expected value (D2) = 0.2s + (0.8*3) >= 2.8
0.2s > = 0.4
s>=2
Hence, the optimal decision would be D2.
Question 9
5
Document Page
Estimated quarterly profits ($’000)
(a) The chance event is the relevant level of demand of Myrtle Air Service. The sequence is
the amount of the estimated quarterly profits. There are two given decision alternatives
i.e. Full price service and Discount service. The number of total outcomes for chance
events would be 2 that means strong demand and weak demand.
(b) Full price service – Optimistic approach
Discount service- Conservative approach
Regret table (Opportunity loss)
The discount service would minimize the maximum regret.
(c) Probability of strong demand = 0.7
Probability of weak demand = 0.3
Expected value approach to find the optimal decision =?
Expected value (Full service) = 0.7*960 + 0.3*(-490) = 525
Expected value (Discount) = 0.7*710 +0.3*350 = 602
The discount service shows maximum expected value which means it would be optimal
decision.
(d) Probability of strong demand = 0.8
6
Document Page
Probability of weak demand = 0.2
Expected value approach to find the optimal decision =?
Expected value (Full service) = 0.8*960 + 0.2*(-490) = 670
Expected value (Discount) = 0.8*710 +0.2*350 = 638
The full price service shows maximum expected value which means it would be optimal
decision.
(e) Let the probability of strong demand is p.
Expected value (Full service) = p*960 + (1-p) *(-490) = 1450 p - 490
Expected value (Discount) = p*710 +(1-p) *350 = 360 p + 350
Now,
Expected value (Full service) = Expected value (Discount)
1450 p – 490 = 360 p + 350
p=0.77064
Here, p values lower than 0.77064, the preferable method would be discount service method
whereas, for p higher than 0.77064, full price method would be best decision.
Question 14
Payoff table to represent the profit for state of nature and decision alternatives is represented
below.
(a) Optimal decision strategy when the perfect information is available
When perfect information is available for state of nature 1 (S1) then will select d1 i.e. 250.
7
tabler-icon-diamond-filled.svg

Paraphrase This Document

Need a fresh take? Get an instant paraphrase of this document with our AI Paraphraser
Document Page
When perfect information is available for state of nature 2 (S2) then will select d1 and d2 i.e.
100.
When perfect information is available for state of nature 3 (S3) then will select d2 i.e. 75.
(b) Expected value for decision strategy made in part (a)
Expected value = (0.65*250) + (0.15*100) + (0.20*75) = 192.50
Expected value for decision strategy comes out to be 192.50.
(c) Expected value approach to find the appropriate decision without perfect information and
the expected value
Expected value for d1 = (0.65*250) + (0.15*100) +(0.20*25) = 182.50
Expected value for d2 = (0.65*250) + (0.15*100) +(0.20*75) = 95
Expected value is higher for d1 which refers that appropriate decision would be d1.
(d) Expected value of perfect information
Expected value of perfect information = Expected value with sample information - Expected
value without sample information
Expected value with sample information = 192.50
Expected value without sample information = 182.50
Hence,
Expected value of perfect information = 192.50 - 182.50 = 10
Therefore, expected value of perfect information would be 10.
Question 15
The costs including the fee of consultant is highlighted below.
8
Document Page
(a) Decision through expected value approach
It can be seen from the above that the expected value for medium and large centre size comes
out to be same and hence, either of the centre size can be selected between Medium and
Large.
(b) Risk profile for medium and large alternatives
Working for Medium:
Average = (-250+650+800)/3 = 400
Average – x = (400) - (-250) = 650 (Worst)
Average – x = (400) – (650) = -25 (Best)
Average – x = (400) – (800) = -400 (Best)
9
Document Page
(Average-x)^2 = 650^2 = 422,500,
(Average-x)^2 = -250^2 =62,500
(Average-x)^2 = -400^2 =160,000
Variance = (0.1*422500) + (62500*0.6) + (160000*0.3) = 122,750
Standard deviation = sqrt (Variance) = sqrt (122750) = 357.42
Similarly, the standard deviation for Large = 438.26
It can be seen from the above that standard deviation for large centre size is higher than
medium centre size. It indicates that the risk associated with large entre size is more than
medium. Therefore, medium centre size would be more appropriate.
(c) Expected value of perfect information
Expected value without perfect information = 605,000
Expected value with perfect information = 727,000
Value of perfect information = Expected value with perfect information- Expected value
without perfect information = 727000-605000 = $122,000
Therefore, the expected value of perfect information is $122,000. Further, we need additional
information so as to find the best scenario. Further, the additional information would be
beneficial for city because is increases the net cash flow.
10
tabler-icon-diamond-filled.svg

Paraphrase This Document

Need a fresh take? Get an instant paraphrase of this document with our AI Paraphraser
Document Page
(d) Probability of worst- case scenario increase = 0.02
Probability of base case scenario decrease = 0.5
Probability of best-case scenario remains = 0.3
It can be seen from the above that the expected value for small comes out to be higher and
hence, it would be selected. Further, if we would have only medium and large entre size then
medium would be adopted.
(e) Expenditure = $150,000
Probability of best-case scenario = 0.4
It can be seen from the above that the expected value for large centre size comes out to be
higher and hence,it would be selected.
Base case = 605,000
Large size expected value = 744,000
Differences = 744000-605000 = 139,000
The difference is lower than the expenditure cost on promotional campaign. Therefore, it can
be said that the use promotional campaign is not recommended through expected value
11
Document Page
approach. Further, the campaign will reduce the total net cash flow for all the centre sizes.
Also, the Mayor is more concerned regarding the risk of losing the capital which means it
would result in re-election and it would be a favourable option to eliminate the total risk.
12
chevron_up_icon
1 out of 12
circle_padding
hide_on_mobile
zoom_out_icon
[object Object]