Bangles Business Analysis: Data Driven Decisions and Strategies
VerifiedAdded on  2023/06/18
|21
|2010
|354
Report
AI Summary
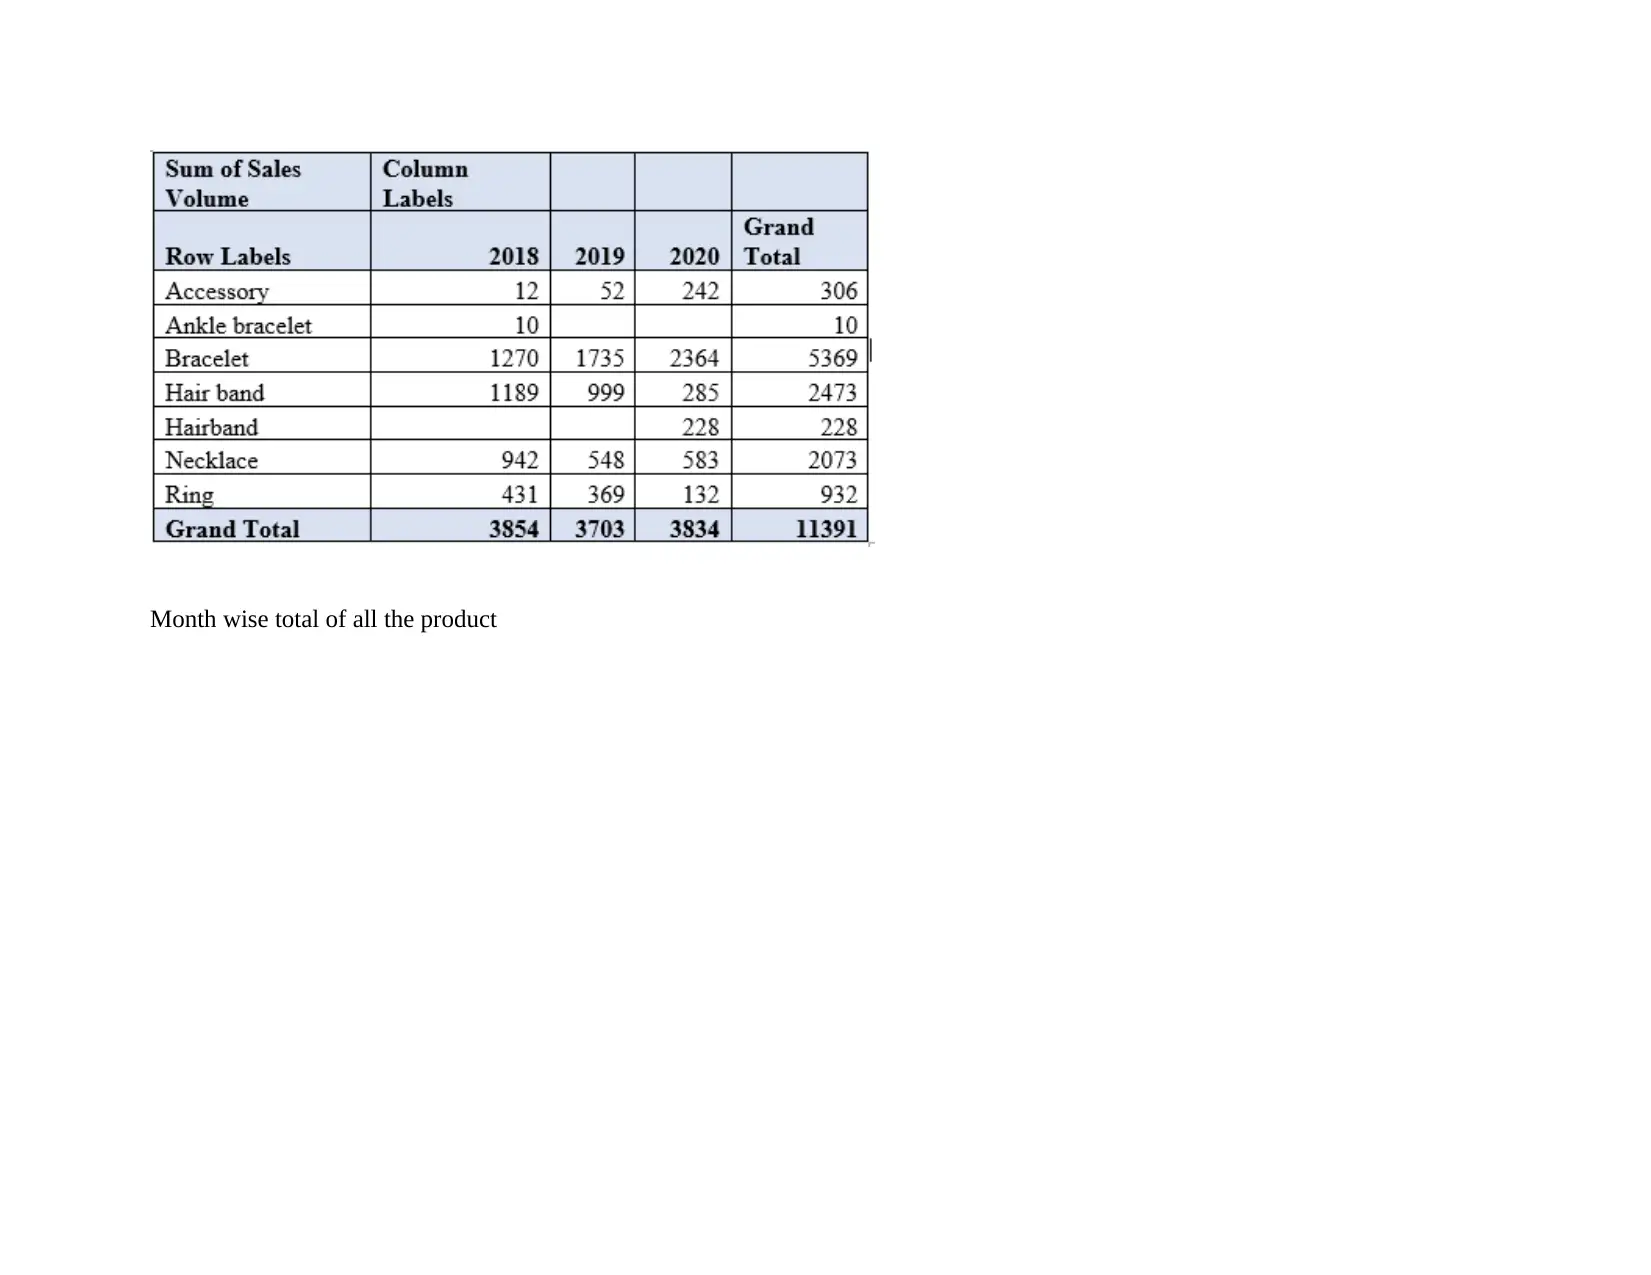
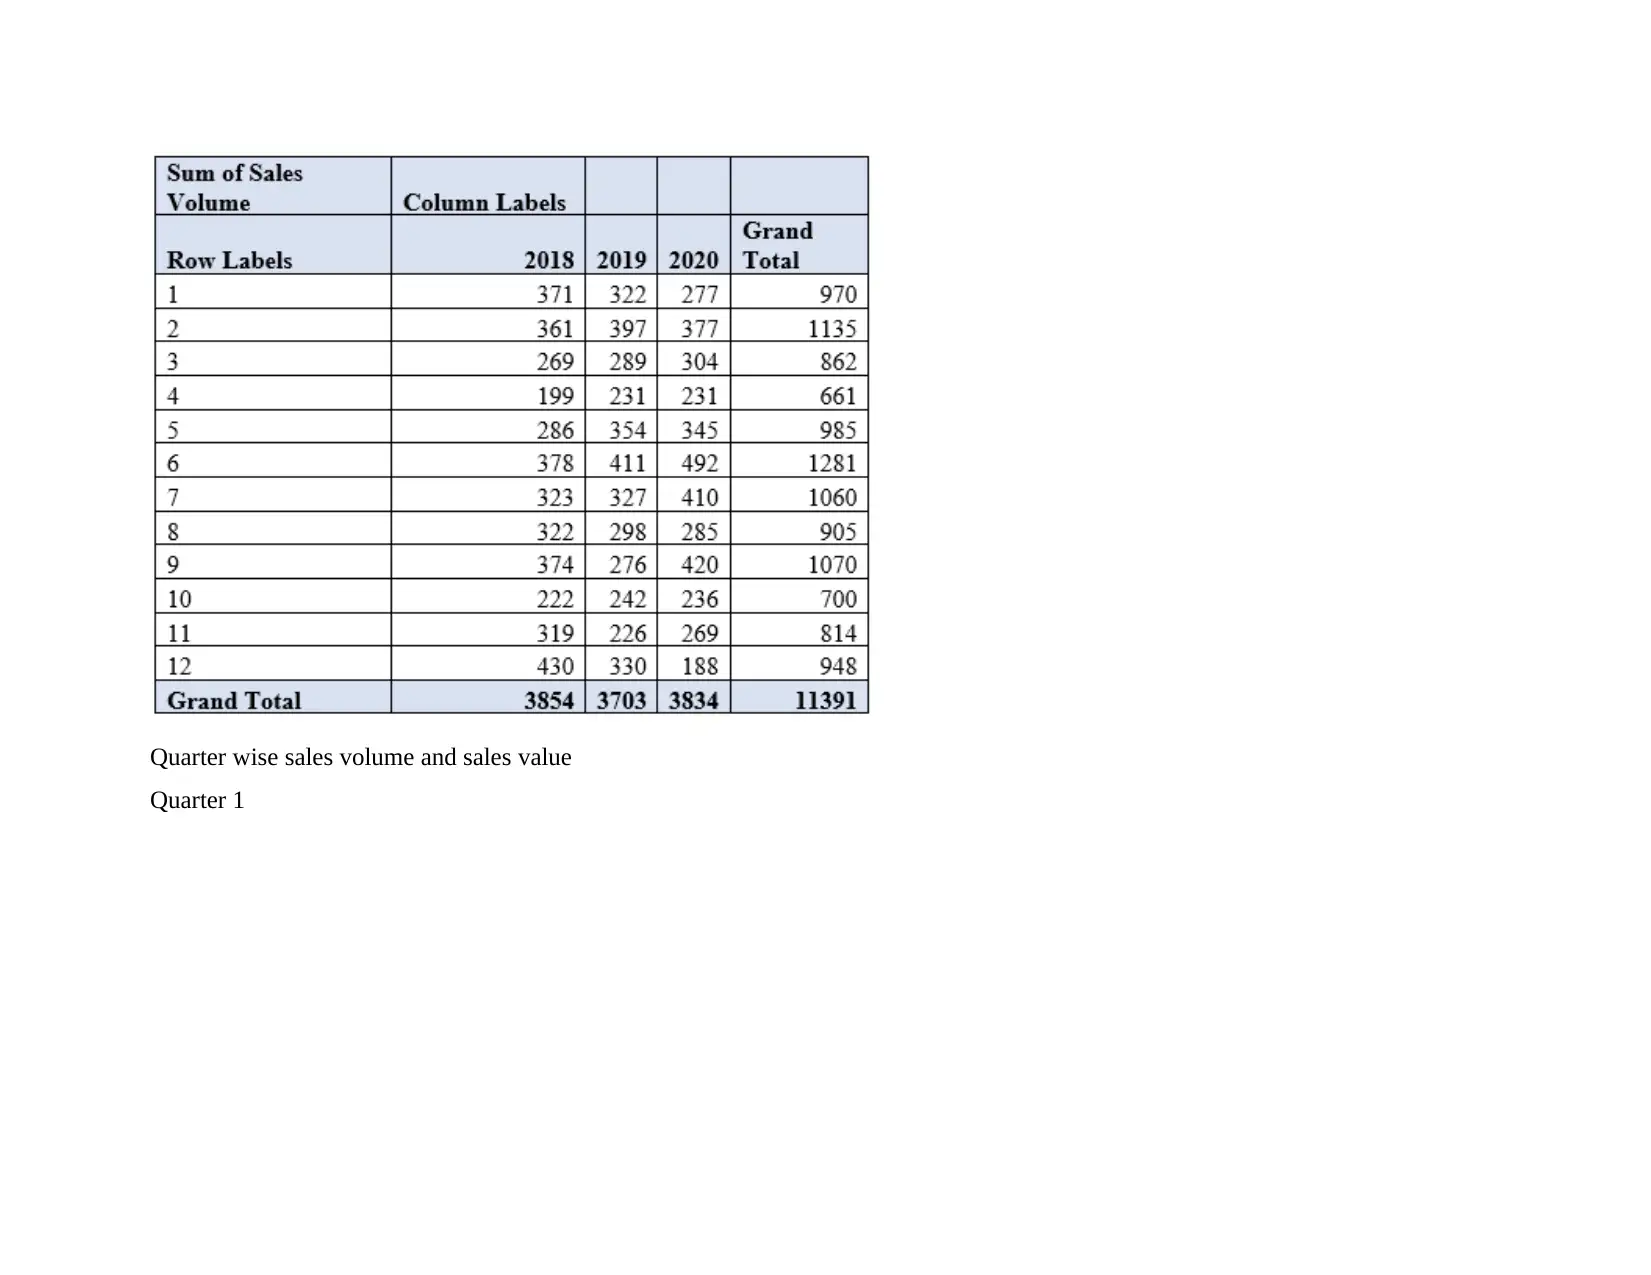
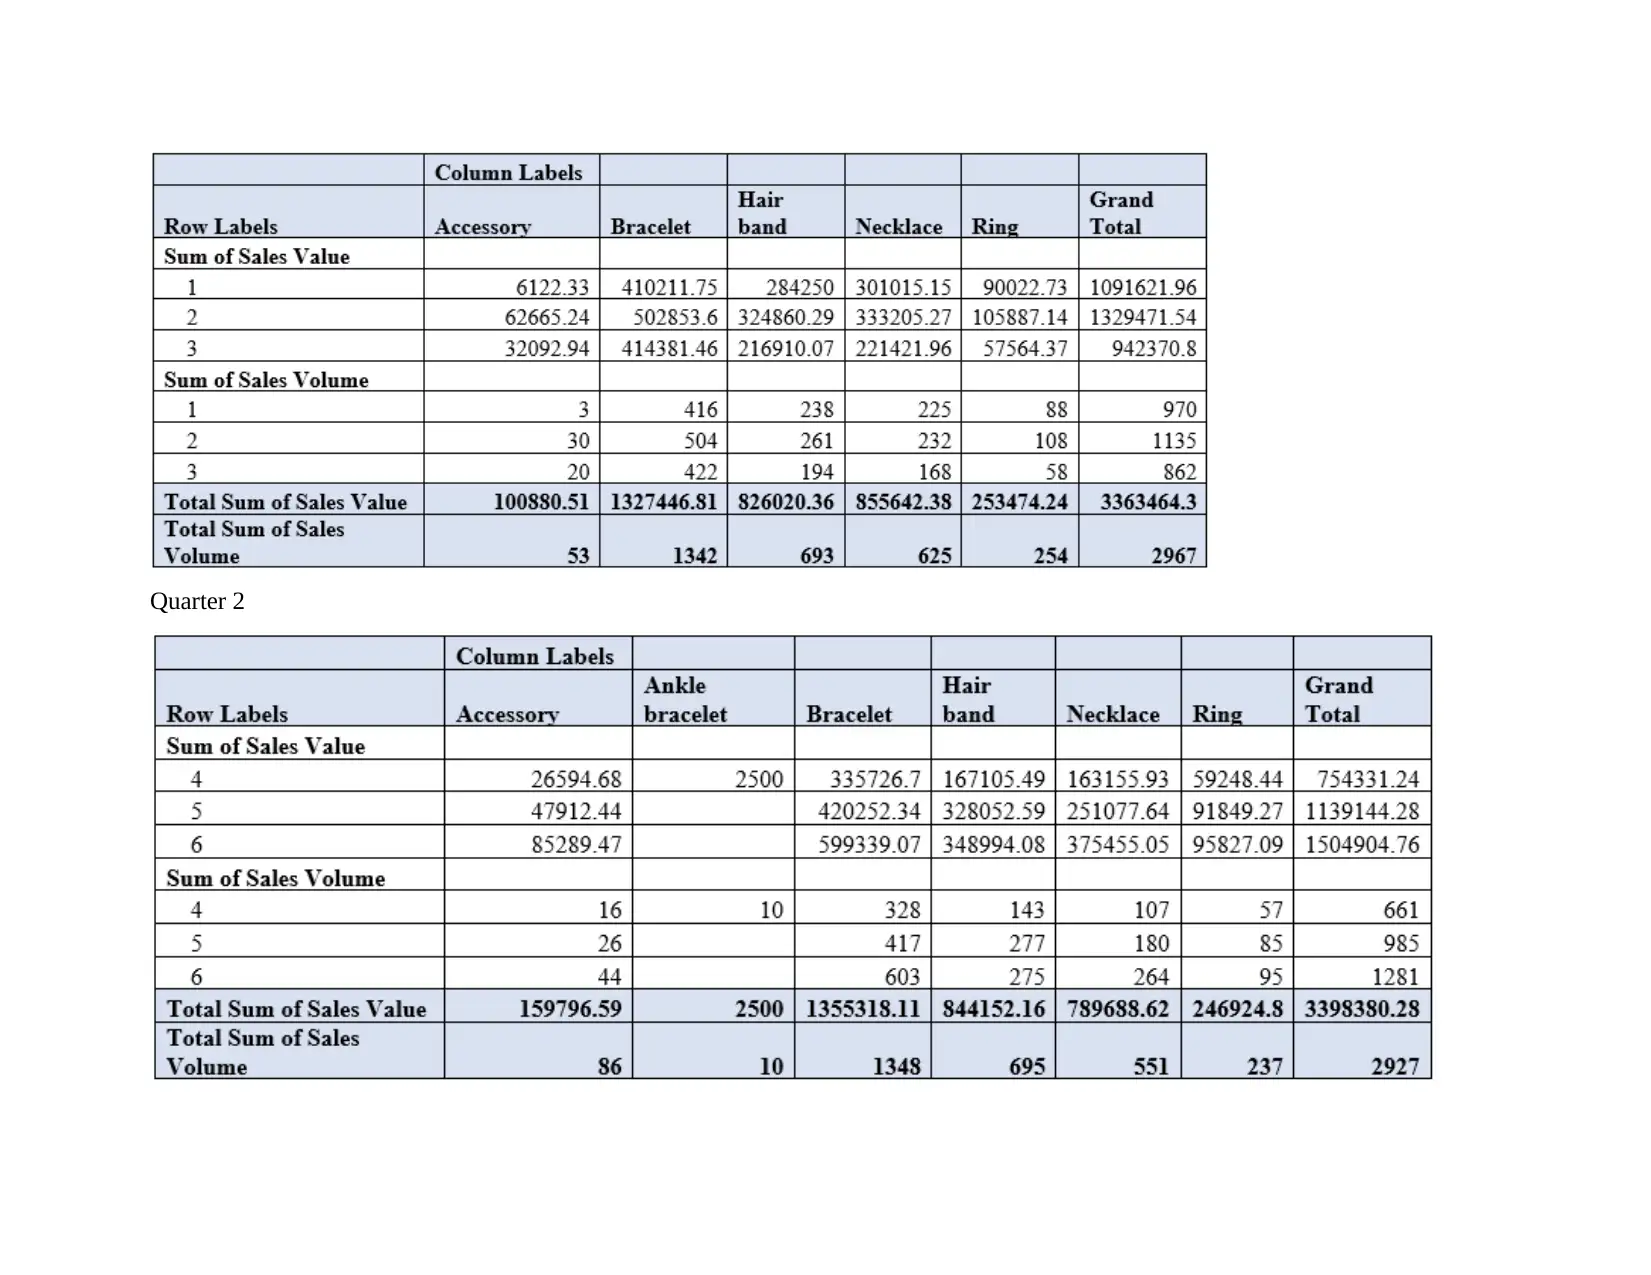
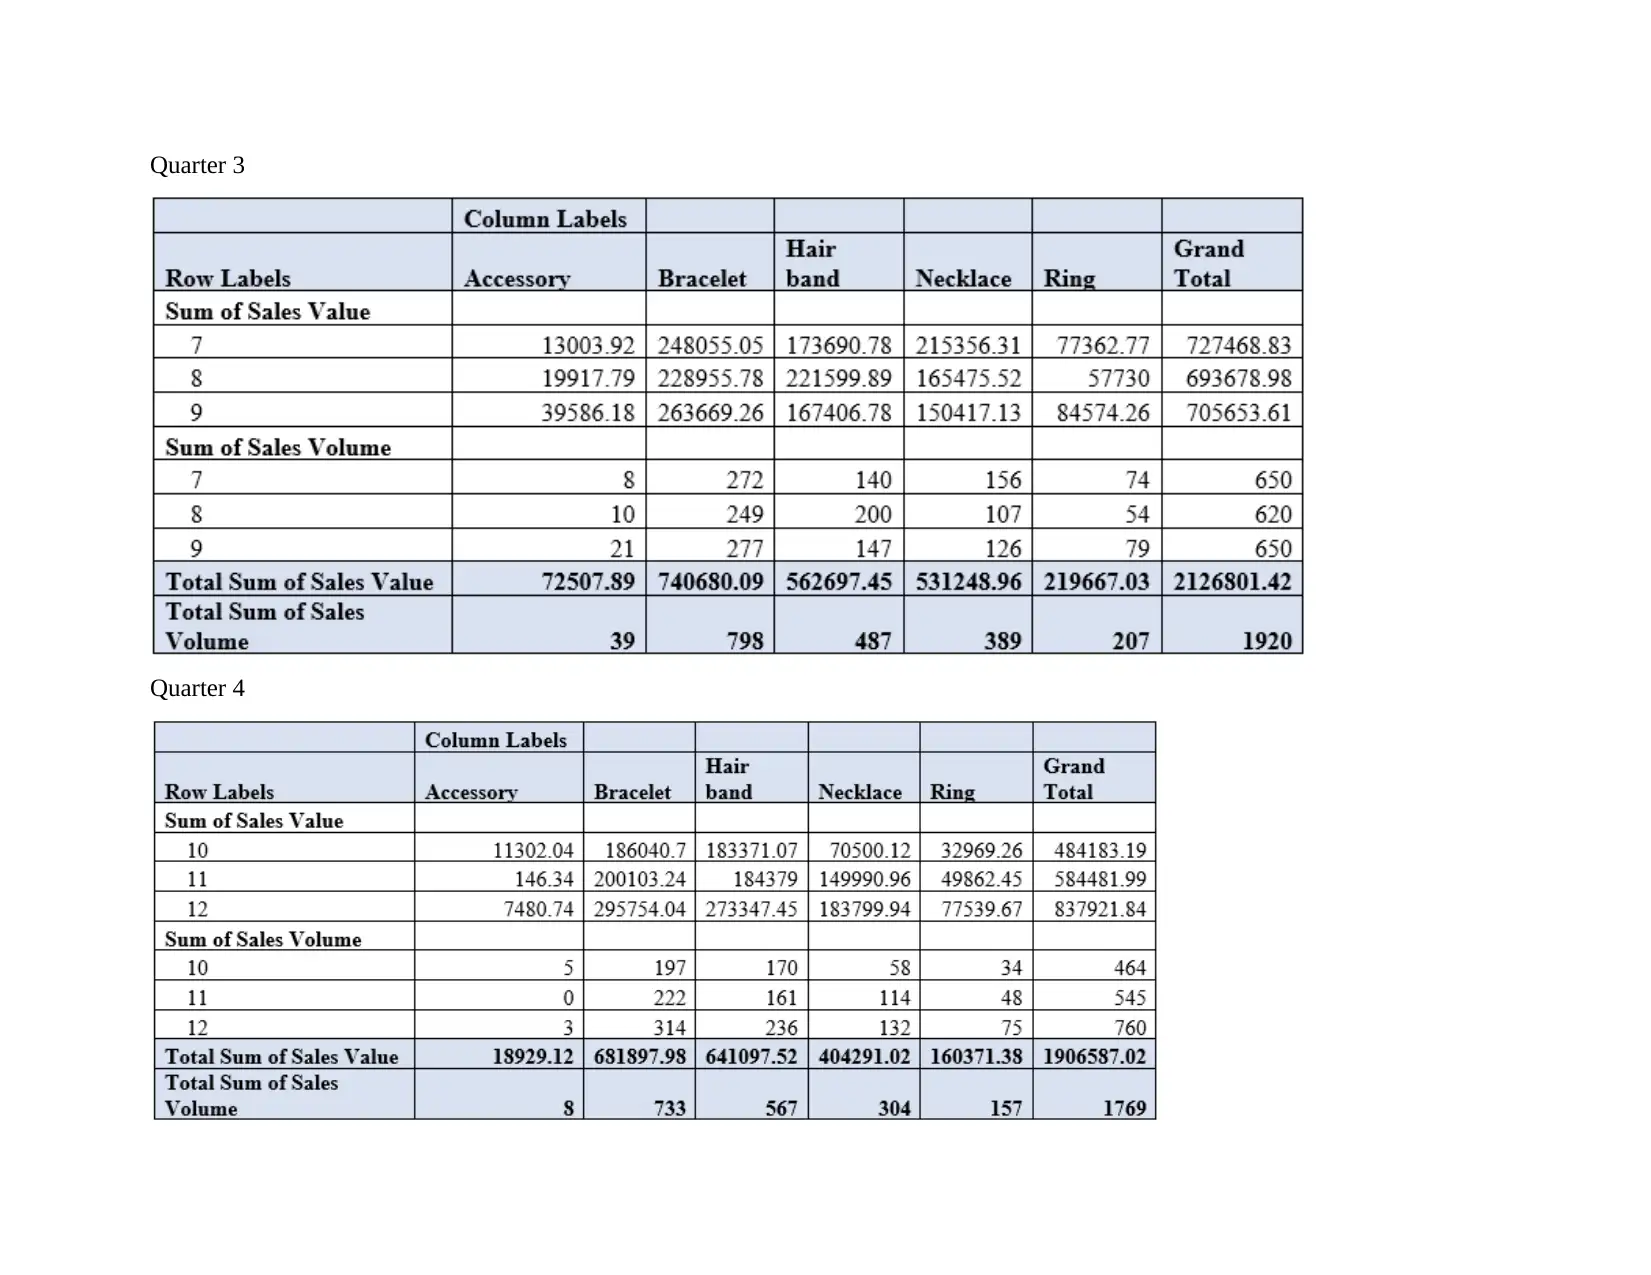
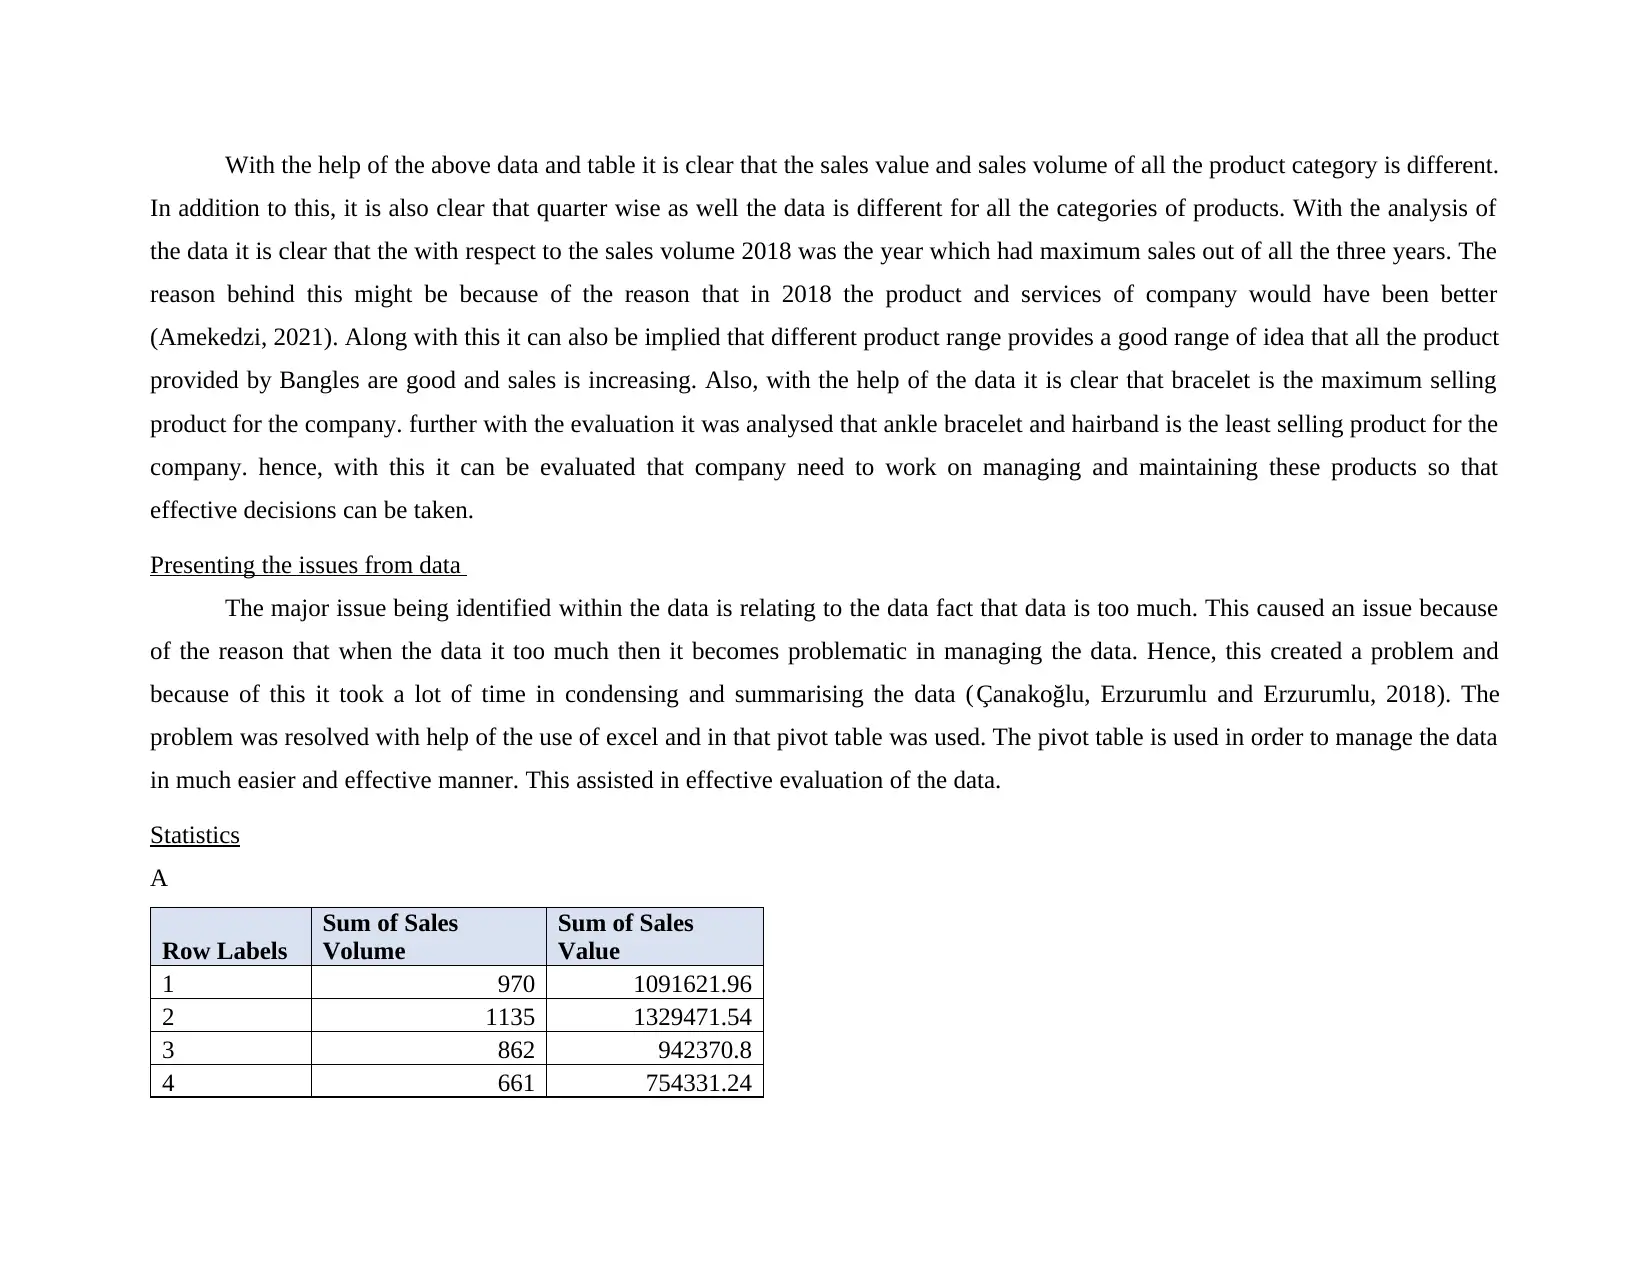
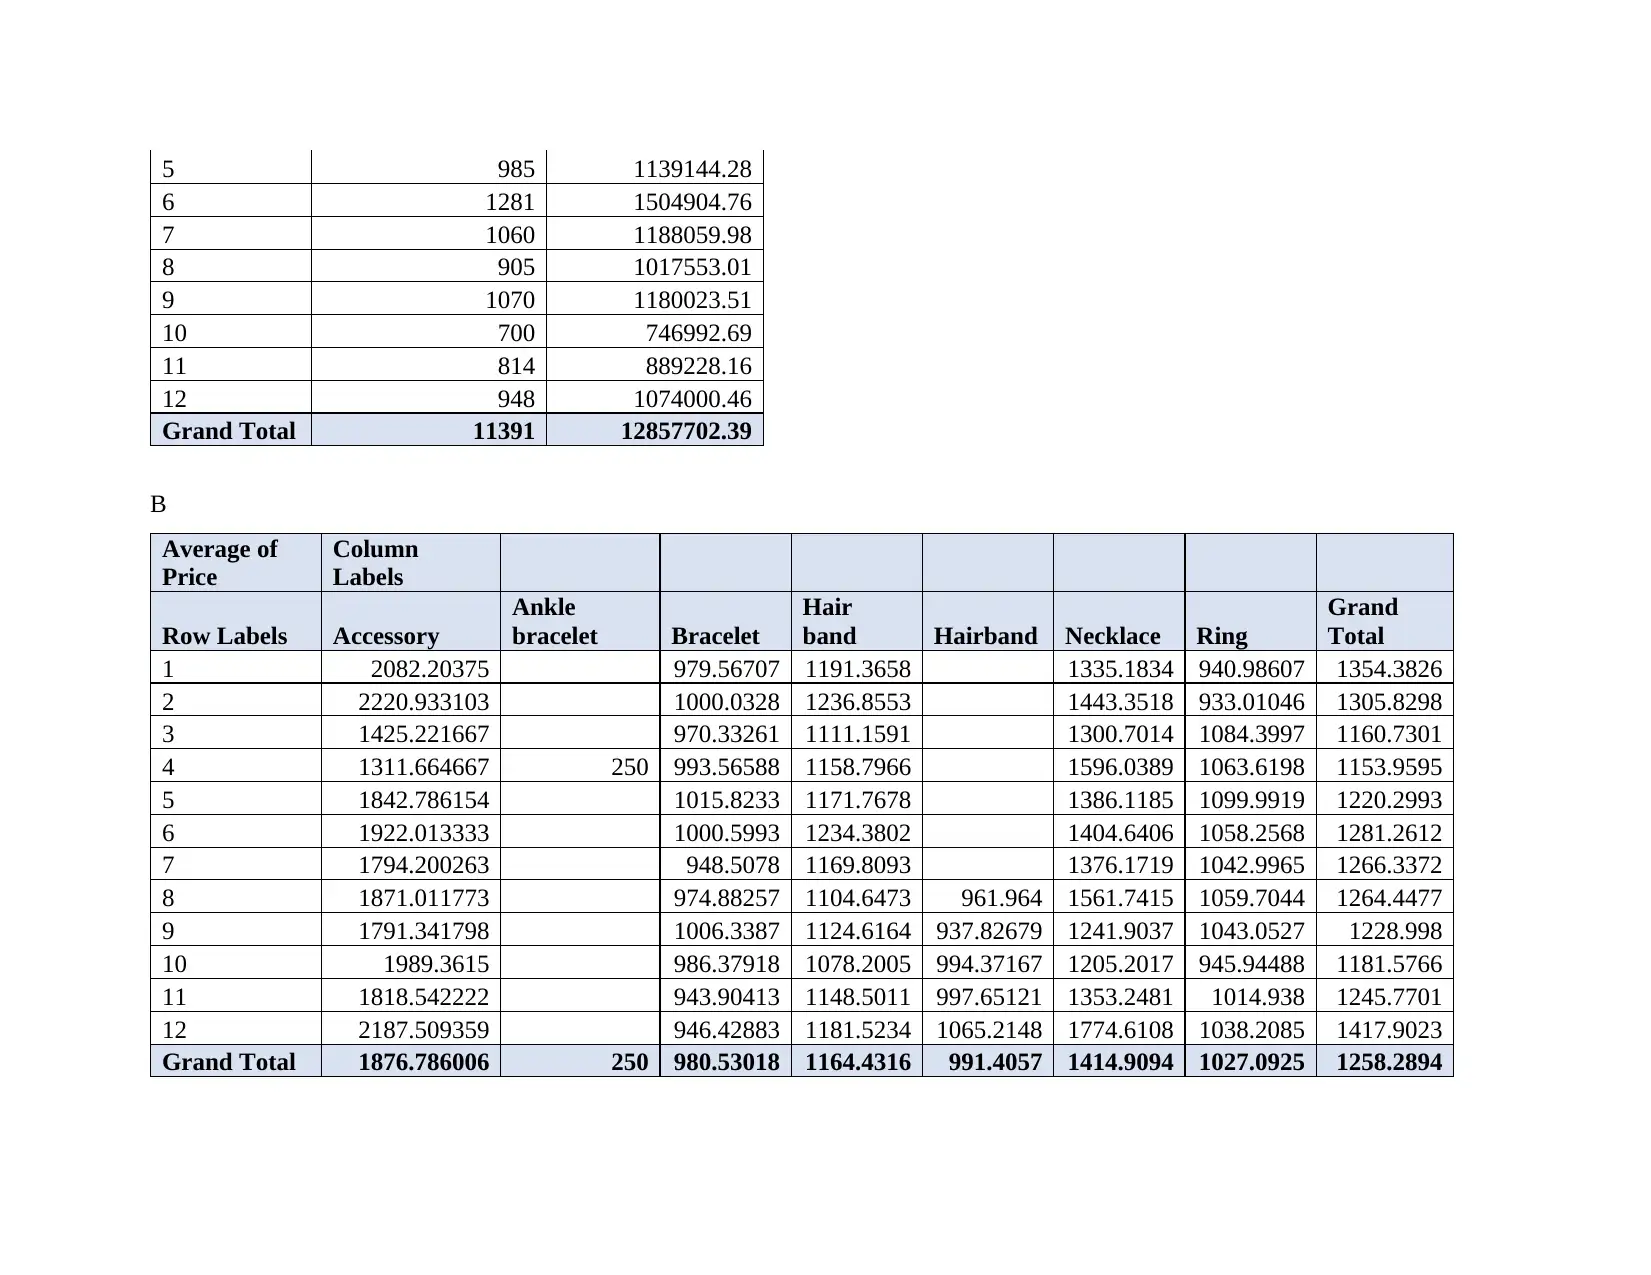
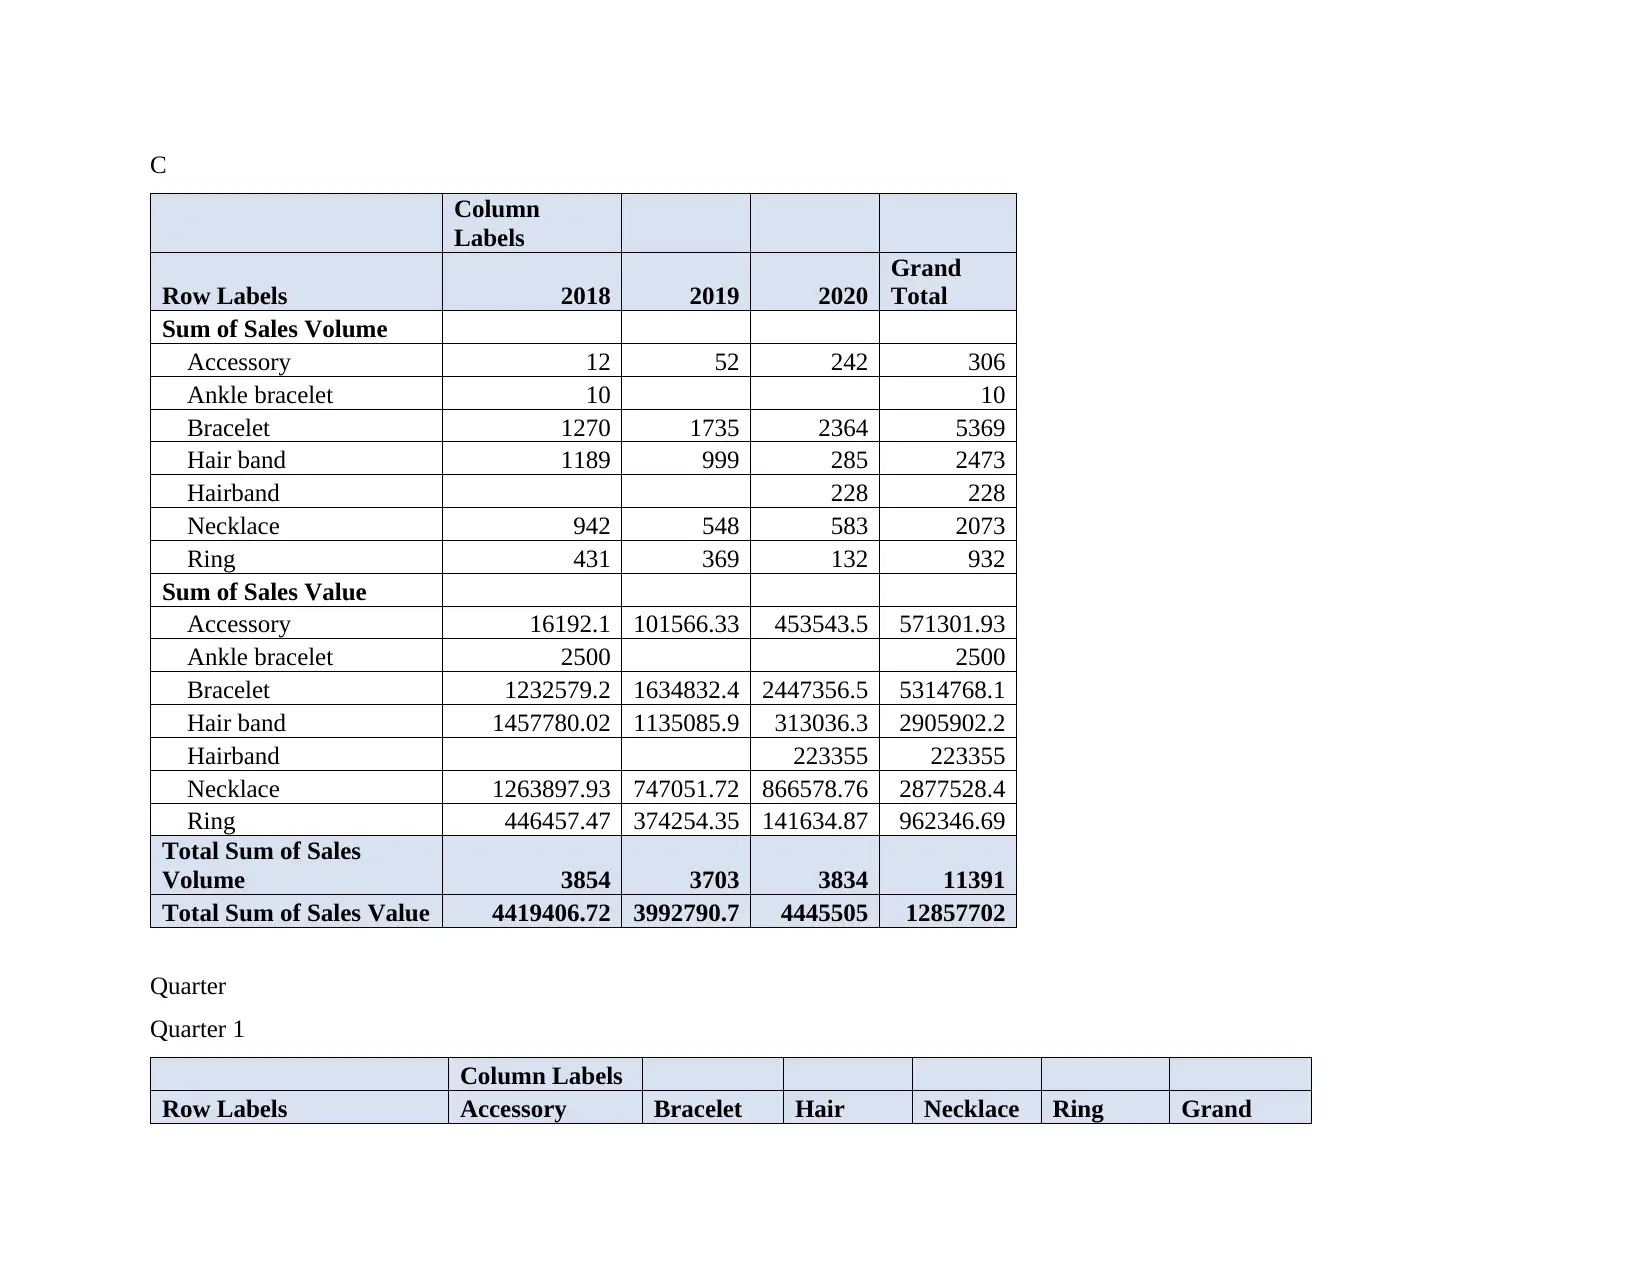
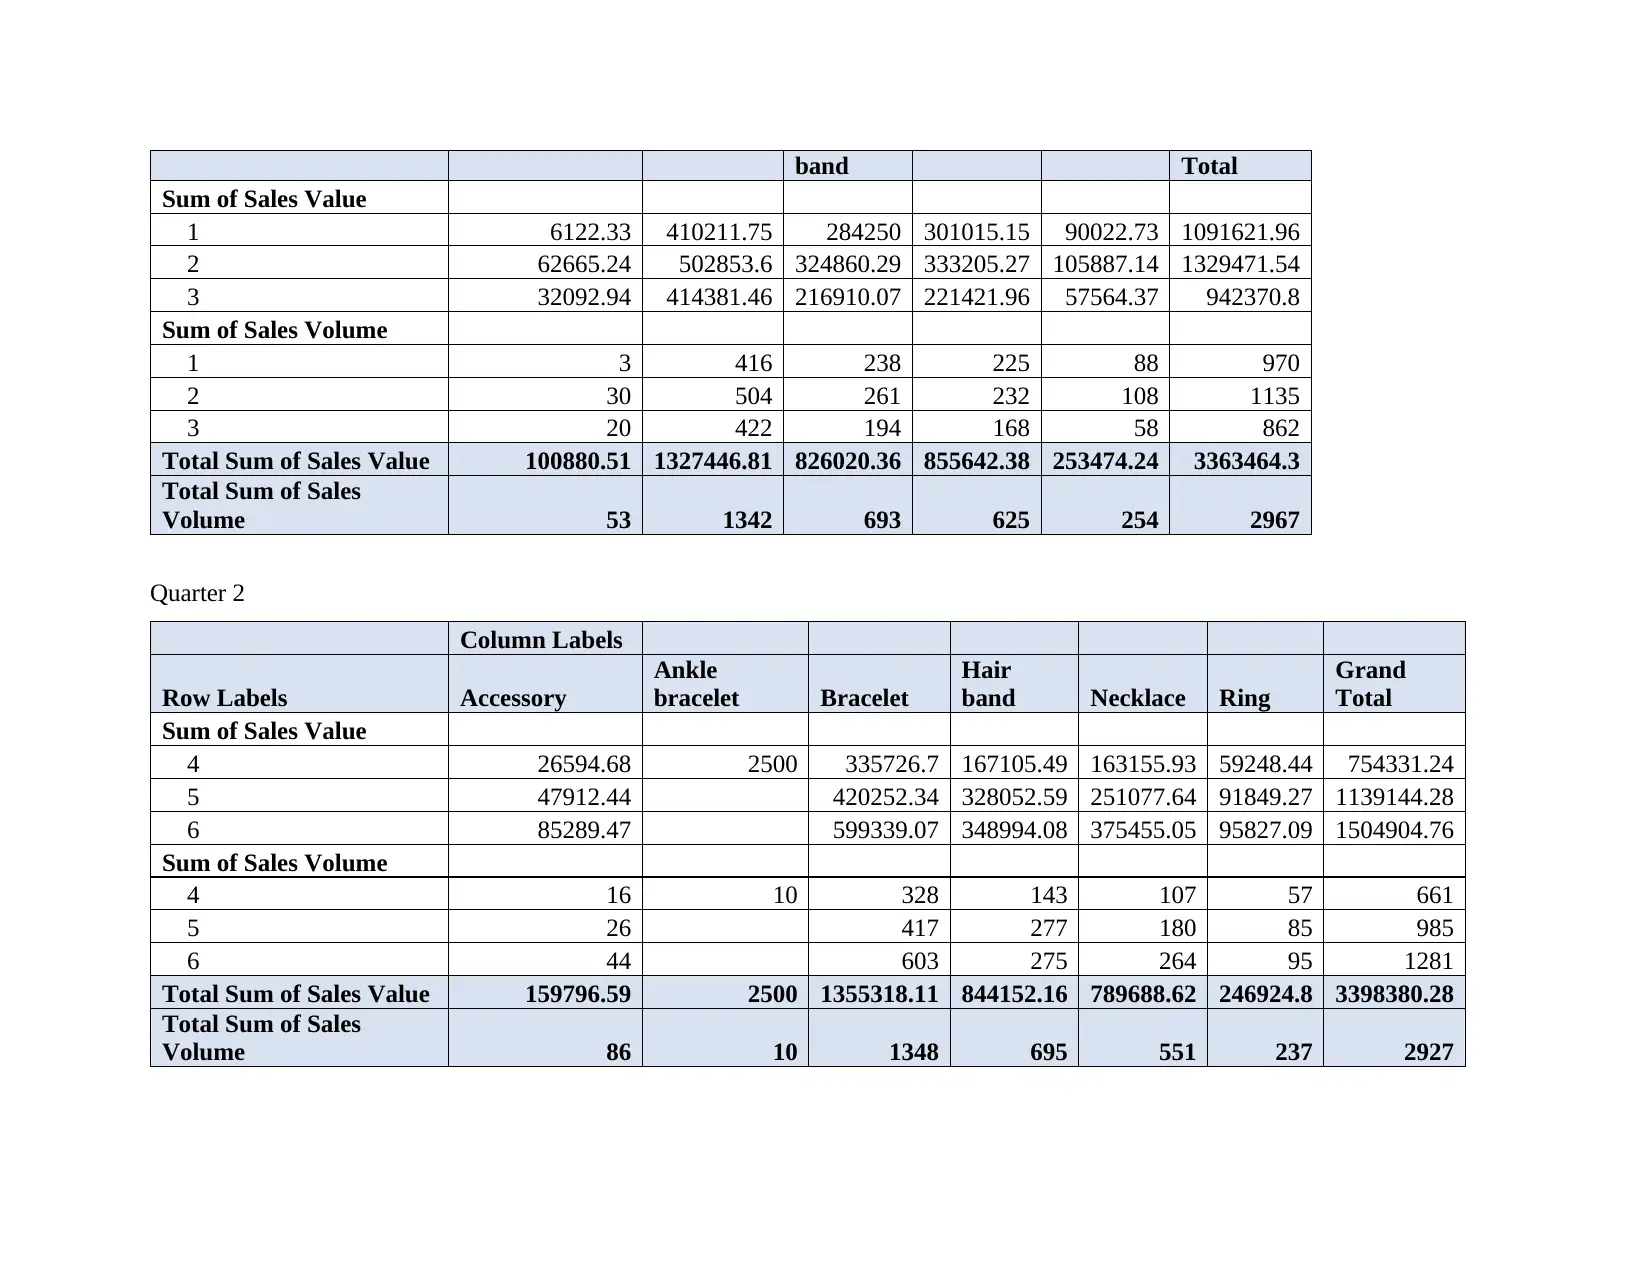
This report provides a comprehensive analysis of data-driven decisions for a business, focusing on key changes and trends that increase the significance of data analysis. It summarizes data describing the business functions of Bangles, identifying issues and presenting relevant statistics with visual images. The analysis covers product-wise, month-wise, and quarter-wise sales data, highlighting top-selling products and areas for improvement. The report also addresses challenges in managing large datasets and the use of tools like Excel pivot tables for effective data evaluation. Charts and commentary provide insights into sales trends, pricing strategies, and overall business management, with references to support the analysis. Desklib offers more resources like this to help students excel.

DATA DRIVEN DECISIONS FOR
BUSINESS
BUSINESS
Paraphrase This Document
Need a fresh take? Get an instant paraphrase of this document with our AI Paraphraser


TABLE OF CONTENTS
MAIN BODY...................................................................................................................................3
Summarizing the key changes and trend that increased significance of data analysis...............3
Producing a summary data which describe the data and business function of Bangles.............3
Presenting the issues from data...................................................................................................8
Statistics......................................................................................................................................8
Visual images through descriptive statistics.............................................................................14
A short commentary for each chart...........................................................................................18
REFERENCES..............................................................................................................................20
⊘ This is a preview!⊘
Do you want full access?
Subscribe today to unlock all pages.

Trusted by 1+ million students worldwide

MAIN BODY
Summarizing the key changes and trend that increased significance of data analysis
In the current era, data analysis is highly used in large as well as small companies. The importance of data analysis in each
field increases due to problems faced by the companies and it is only facts and figures that helps to identify any issues faced by
business. Also, each businesses seeking to increased their productivity and improve financial outcomes which can be attained by
implementation of data analysis (Todd, 2017). Apart from this, to enhance sales, business seeking towards better customer relationship
where data analysis also plays an important role. It is so because with the help of data analysis, company evaluate their ad campaigns,
personalized content and then develop products. This in turn assist to improve the performance of a company and that is why, to
comply with changing era, large businesses use data analysis which increases the importance of the same.
In addition to this, it becomes very difficult for business to analyse the frequent changes of market and to predict the future,
data analysis is more useful. Thus, marketing data analysis assist to provide an idea pertaining to future which in turn helps in
improving the sales. That is why, it has been analysed that with the help of machine learning’s companies are able to recognize the
data pattern and forecast accordingly. This in turn leads to smarter business moves and improve the operations by enhancing profit
margin as well.
Producing a summary data which describe the data and business function of Bangles
Product wise total of every year
Paraphrase This Document
Need a fresh take? Get an instant paraphrase of this document with our AI Paraphraser

Month wise total of all the product

Quarter wise sales volume and sales value
Quarter 1
Quarter 1
⊘ This is a preview!⊘
Do you want full access?
Subscribe today to unlock all pages.

Trusted by 1+ million students worldwide

Quarter 2
Paraphrase This Document
Need a fresh take? Get an instant paraphrase of this document with our AI Paraphraser

Quarter 3
Quarter 4
Quarter 4

With the help of the above data and table it is clear that the sales value and sales volume of all the product category is different.
In addition to this, it is also clear that quarter wise as well the data is different for all the categories of products. With the analysis of
the data it is clear that the with respect to the sales volume 2018 was the year which had maximum sales out of all the three years. The
reason behind this might be because of the reason that in 2018 the product and services of company would have been better
(Amekedzi, 2021). Along with this it can also be implied that different product range provides a good range of idea that all the product
provided by Bangles are good and sales is increasing. Also, with the help of the data it is clear that bracelet is the maximum selling
product for the company. further with the evaluation it was analysed that ankle bracelet and hairband is the least selling product for the
company. hence, with this it can be evaluated that company need to work on managing and maintaining these products so that
effective decisions can be taken.
Presenting the issues from data
The major issue being identified within the data is relating to the data fact that data is too much. This caused an issue because
of the reason that when the data it too much then it becomes problematic in managing the data. Hence, this created a problem and
because of this it took a lot of time in condensing and summarising the data (Çanakoğlu, Erzurumlu and Erzurumlu, 2018). The
problem was resolved with help of the use of excel and in that pivot table was used. The pivot table is used in order to manage the data
in much easier and effective manner. This assisted in effective evaluation of the data.
Statistics
A
Row Labels
Sum of Sales
Volume
Sum of Sales
Value
1 970 1091621.96
2 1135 1329471.54
3 862 942370.8
4 661 754331.24
⊘ This is a preview!⊘
Do you want full access?
Subscribe today to unlock all pages.

Trusted by 1+ million students worldwide

5 985 1139144.28
6 1281 1504904.76
7 1060 1188059.98
8 905 1017553.01
9 1070 1180023.51
10 700 746992.69
11 814 889228.16
12 948 1074000.46
Grand Total 11391 12857702.39
B
Average of
Price
Column
Labels
Row Labels Accessory
Ankle
bracelet Bracelet
Hair
band Hairband Necklace Ring
Grand
Total
1 2082.20375 979.56707 1191.3658 1335.1834 940.98607 1354.3826
2 2220.933103 1000.0328 1236.8553 1443.3518 933.01046 1305.8298
3 1425.221667 970.33261 1111.1591 1300.7014 1084.3997 1160.7301
4 1311.664667 250 993.56588 1158.7966 1596.0389 1063.6198 1153.9595
5 1842.786154 1015.8233 1171.7678 1386.1185 1099.9919 1220.2993
6 1922.013333 1000.5993 1234.3802 1404.6406 1058.2568 1281.2612
7 1794.200263 948.5078 1169.8093 1376.1719 1042.9965 1266.3372
8 1871.011773 974.88257 1104.6473 961.964 1561.7415 1059.7044 1264.4477
9 1791.341798 1006.3387 1124.6164 937.82679 1241.9037 1043.0527 1228.998
10 1989.3615 986.37918 1078.2005 994.37167 1205.2017 945.94488 1181.5766
11 1818.542222 943.90413 1148.5011 997.65121 1353.2481 1014.938 1245.7701
12 2187.509359 946.42883 1181.5234 1065.2148 1774.6108 1038.2085 1417.9023
Grand Total 1876.786006 250 980.53018 1164.4316 991.4057 1414.9094 1027.0925 1258.2894
Paraphrase This Document
Need a fresh take? Get an instant paraphrase of this document with our AI Paraphraser

C
Column
Labels
Row Labels 2018 2019 2020
Grand
Total
Sum of Sales Volume
Accessory 12 52 242 306
Ankle bracelet 10 10
Bracelet 1270 1735 2364 5369
Hair band 1189 999 285 2473
Hairband 228 228
Necklace 942 548 583 2073
Ring 431 369 132 932
Sum of Sales Value
Accessory 16192.1 101566.33 453543.5 571301.93
Ankle bracelet 2500 2500
Bracelet 1232579.2 1634832.4 2447356.5 5314768.1
Hair band 1457780.02 1135085.9 313036.3 2905902.2
Hairband 223355 223355
Necklace 1263897.93 747051.72 866578.76 2877528.4
Ring 446457.47 374254.35 141634.87 962346.69
Total Sum of Sales
Volume 3854 3703 3834 11391
Total Sum of Sales Value 4419406.72 3992790.7 4445505 12857702
Quarter
Quarter 1
Column Labels
Row Labels Accessory Bracelet Hair Necklace Ring Grand

band Total
Sum of Sales Value
1 6122.33 410211.75 284250 301015.15 90022.73 1091621.96
2 62665.24 502853.6 324860.29 333205.27 105887.14 1329471.54
3 32092.94 414381.46 216910.07 221421.96 57564.37 942370.8
Sum of Sales Volume
1 3 416 238 225 88 970
2 30 504 261 232 108 1135
3 20 422 194 168 58 862
Total Sum of Sales Value 100880.51 1327446.81 826020.36 855642.38 253474.24 3363464.3
Total Sum of Sales
Volume 53 1342 693 625 254 2967
Quarter 2
Column Labels
Row Labels Accessory
Ankle
bracelet Bracelet
Hair
band Necklace Ring
Grand
Total
Sum of Sales Value
4 26594.68 2500 335726.7 167105.49 163155.93 59248.44 754331.24
5 47912.44 420252.34 328052.59 251077.64 91849.27 1139144.28
6 85289.47 599339.07 348994.08 375455.05 95827.09 1504904.76
Sum of Sales Volume
4 16 10 328 143 107 57 661
5 26 417 277 180 85 985
6 44 603 275 264 95 1281
Total Sum of Sales Value 159796.59 2500 1355318.11 844152.16 789688.62 246924.8 3398380.28
Total Sum of Sales
Volume 86 10 1348 695 551 237 2927
Sum of Sales Value
1 6122.33 410211.75 284250 301015.15 90022.73 1091621.96
2 62665.24 502853.6 324860.29 333205.27 105887.14 1329471.54
3 32092.94 414381.46 216910.07 221421.96 57564.37 942370.8
Sum of Sales Volume
1 3 416 238 225 88 970
2 30 504 261 232 108 1135
3 20 422 194 168 58 862
Total Sum of Sales Value 100880.51 1327446.81 826020.36 855642.38 253474.24 3363464.3
Total Sum of Sales
Volume 53 1342 693 625 254 2967
Quarter 2
Column Labels
Row Labels Accessory
Ankle
bracelet Bracelet
Hair
band Necklace Ring
Grand
Total
Sum of Sales Value
4 26594.68 2500 335726.7 167105.49 163155.93 59248.44 754331.24
5 47912.44 420252.34 328052.59 251077.64 91849.27 1139144.28
6 85289.47 599339.07 348994.08 375455.05 95827.09 1504904.76
Sum of Sales Volume
4 16 10 328 143 107 57 661
5 26 417 277 180 85 985
6 44 603 275 264 95 1281
Total Sum of Sales Value 159796.59 2500 1355318.11 844152.16 789688.62 246924.8 3398380.28
Total Sum of Sales
Volume 86 10 1348 695 551 237 2927
⊘ This is a preview!⊘
Do you want full access?
Subscribe today to unlock all pages.

Trusted by 1+ million students worldwide
1 out of 21
Related Documents
Your All-in-One AI-Powered Toolkit for Academic Success.
 +13062052269
info@desklib.com
Available 24*7 on WhatsApp / Email
Unlock your academic potential
Copyright © 2020–2025 A2Z Services. All Rights Reserved. Developed and managed by ZUCOL.


