Food for Friends: Business Analysis, Recommendations, and Strategy

Verified

Added on  2023/04/21

|12
|429
|489
Report
AI Summary
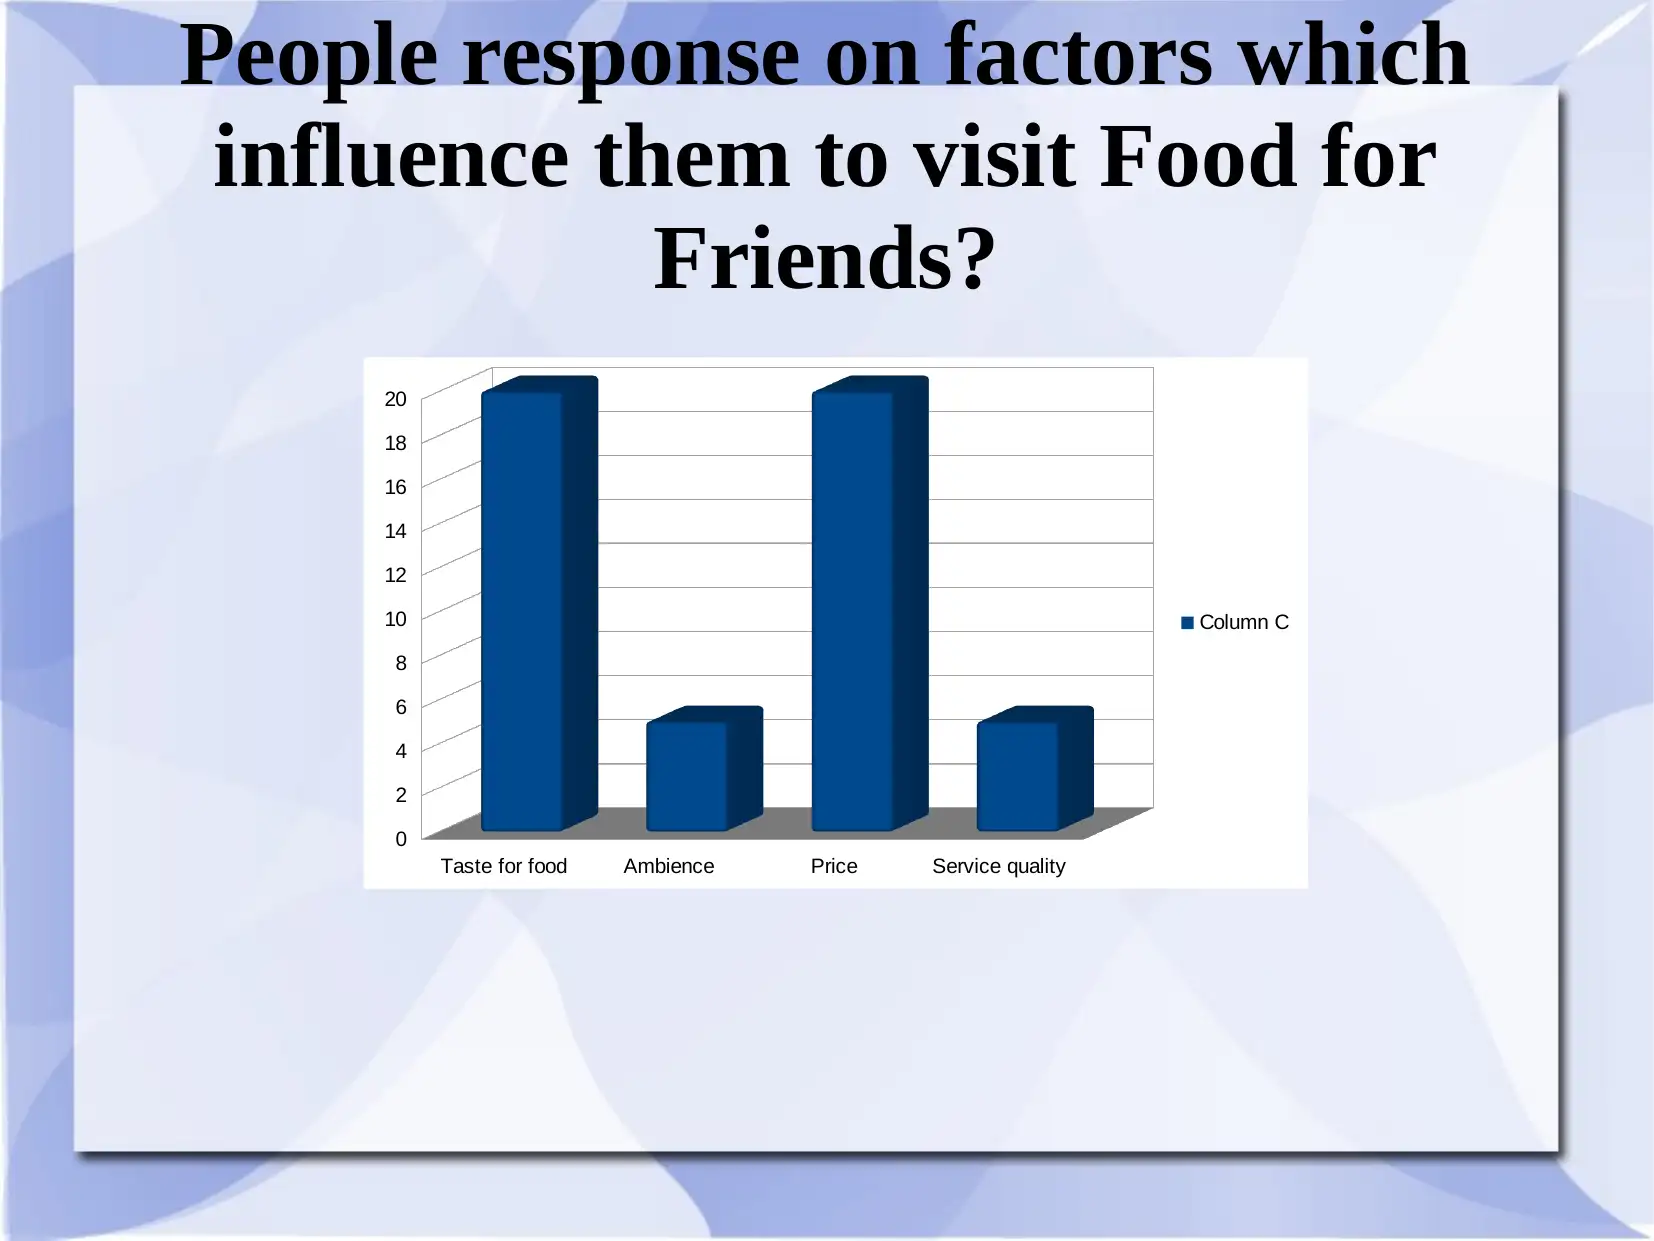
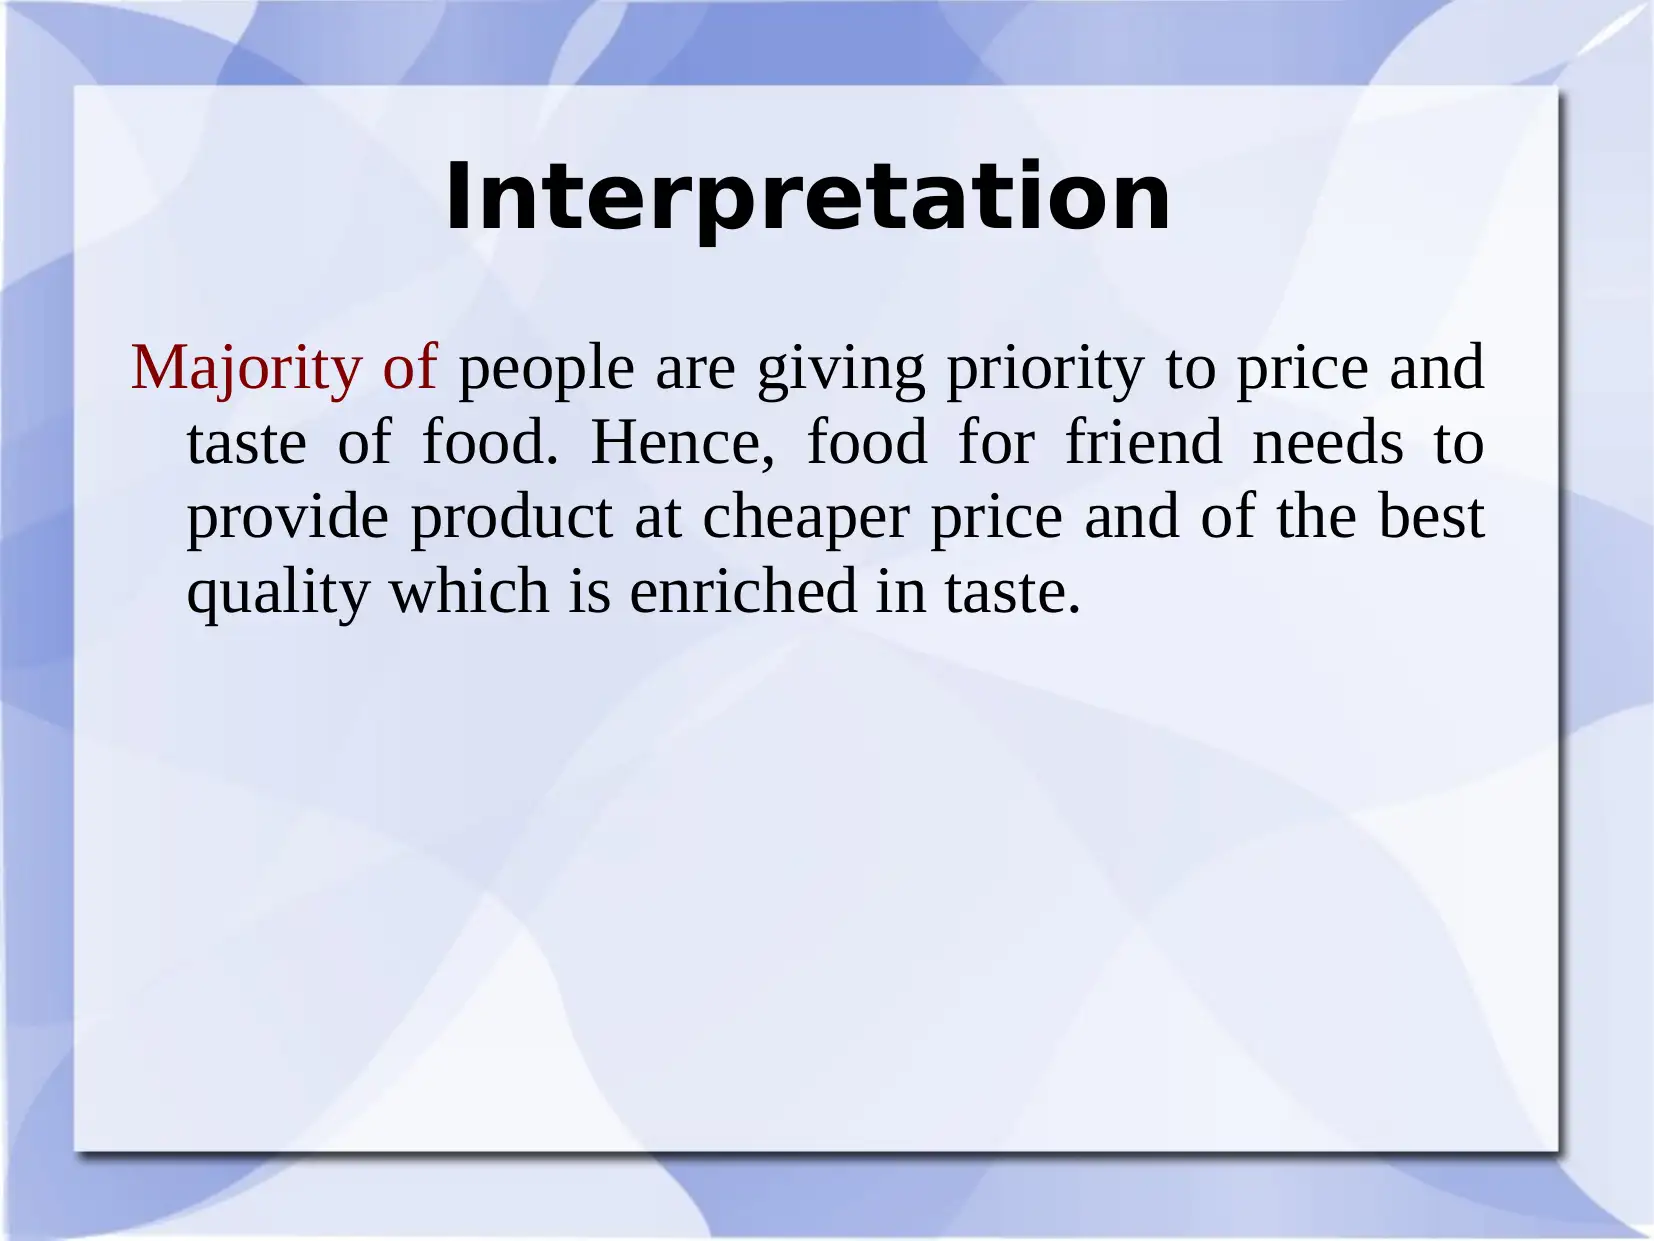
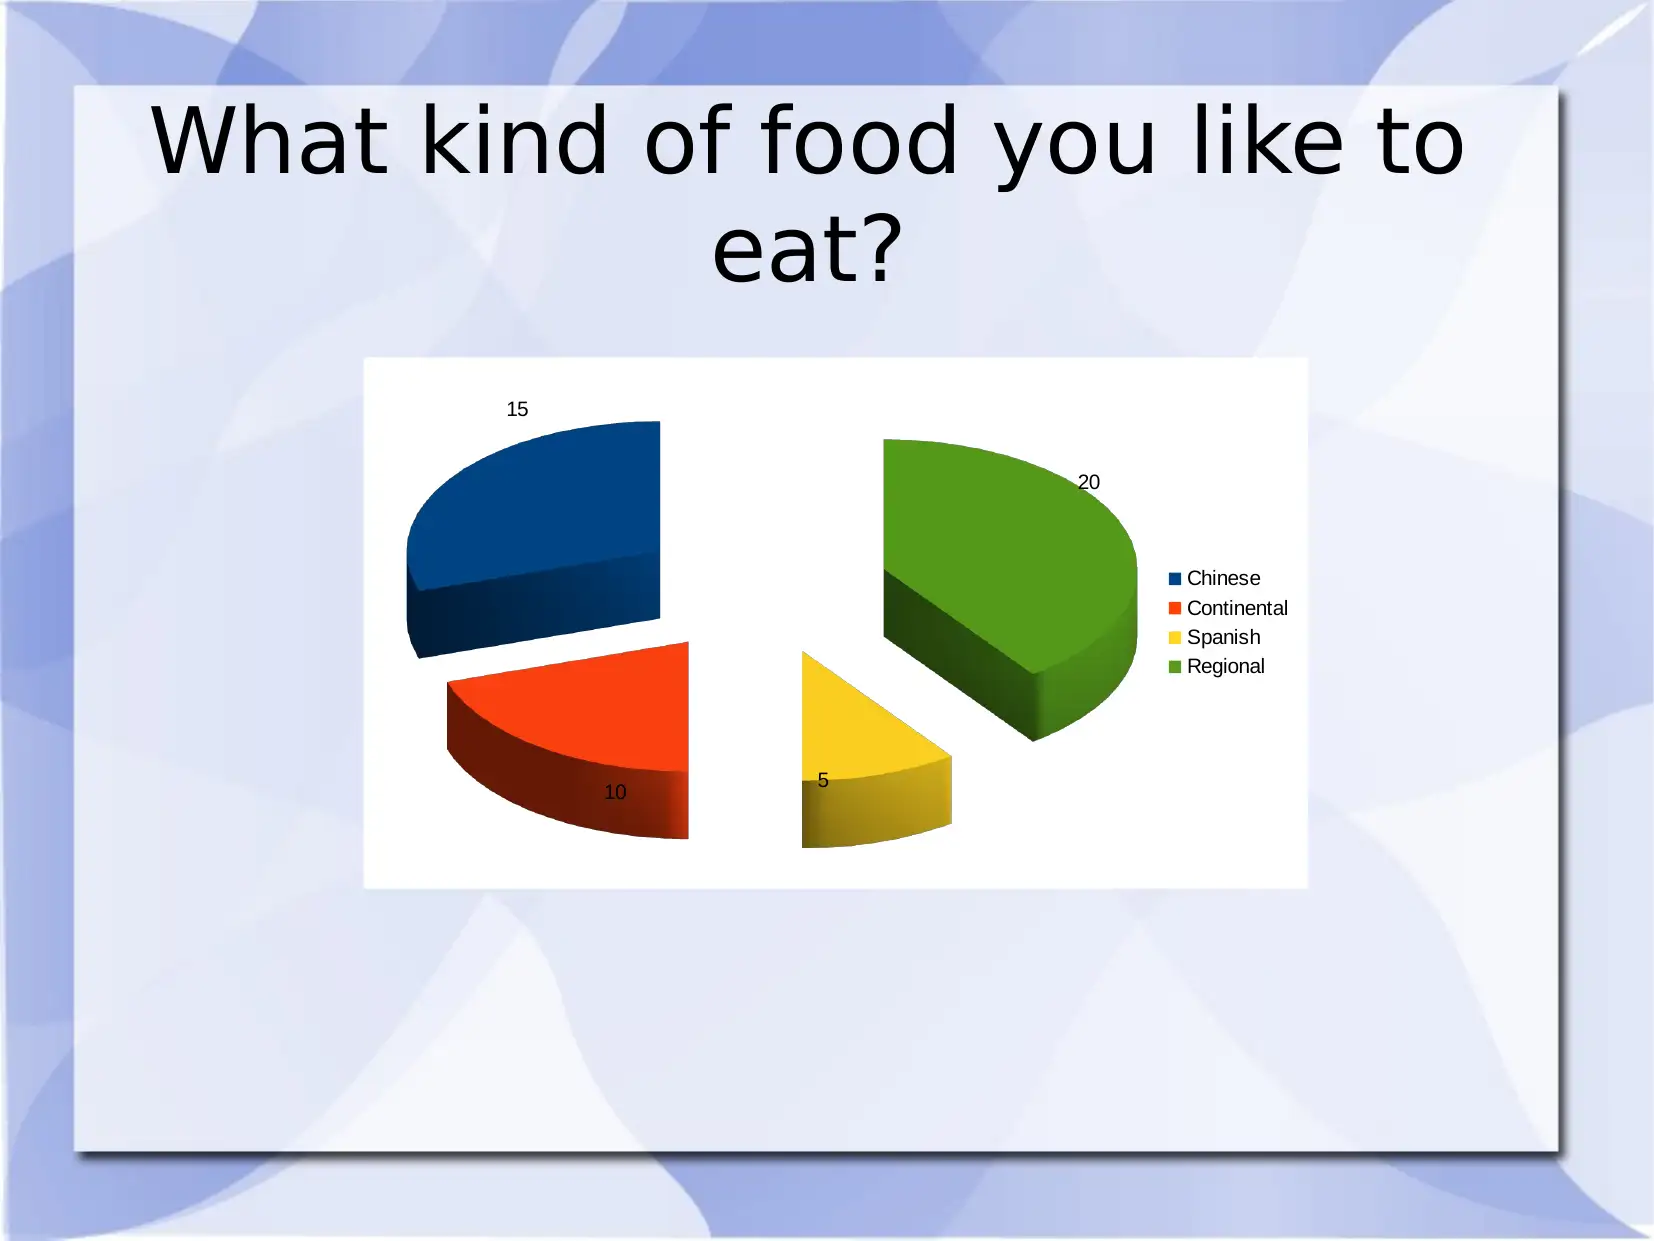
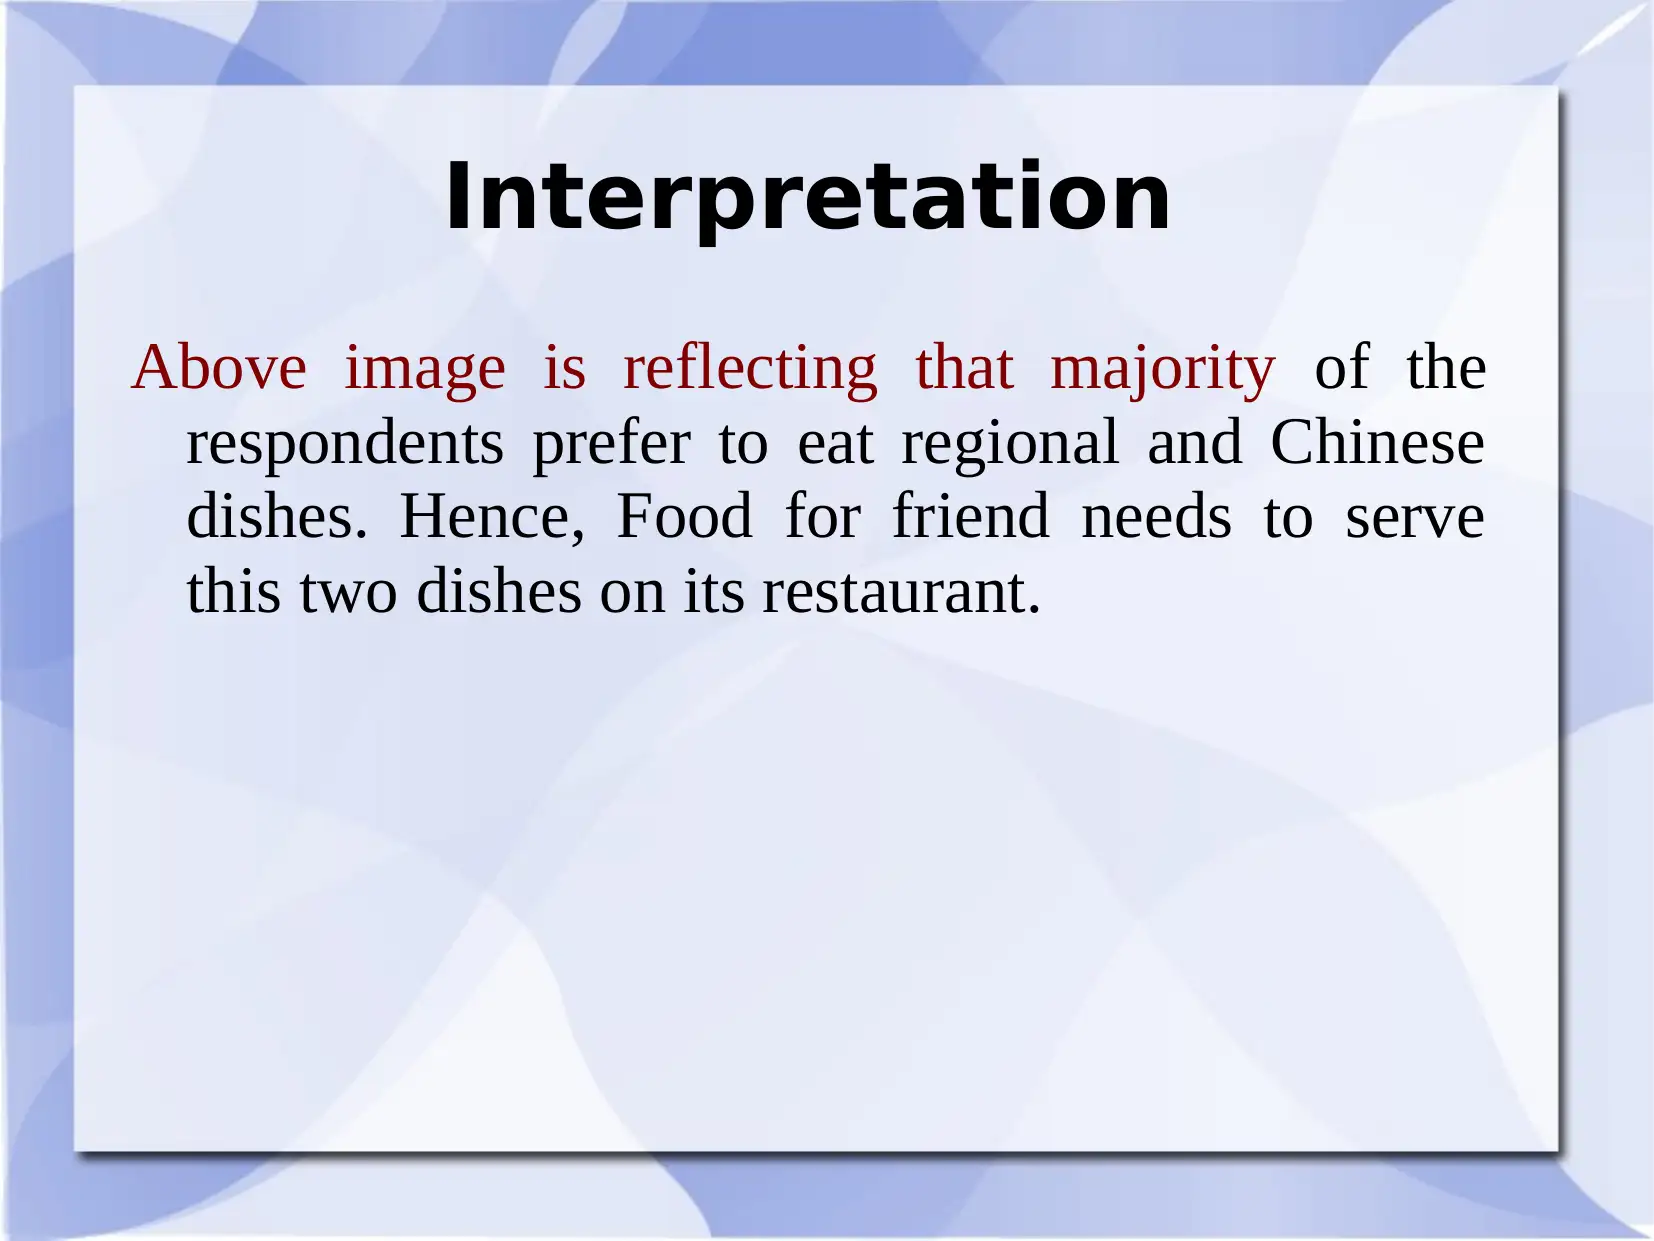
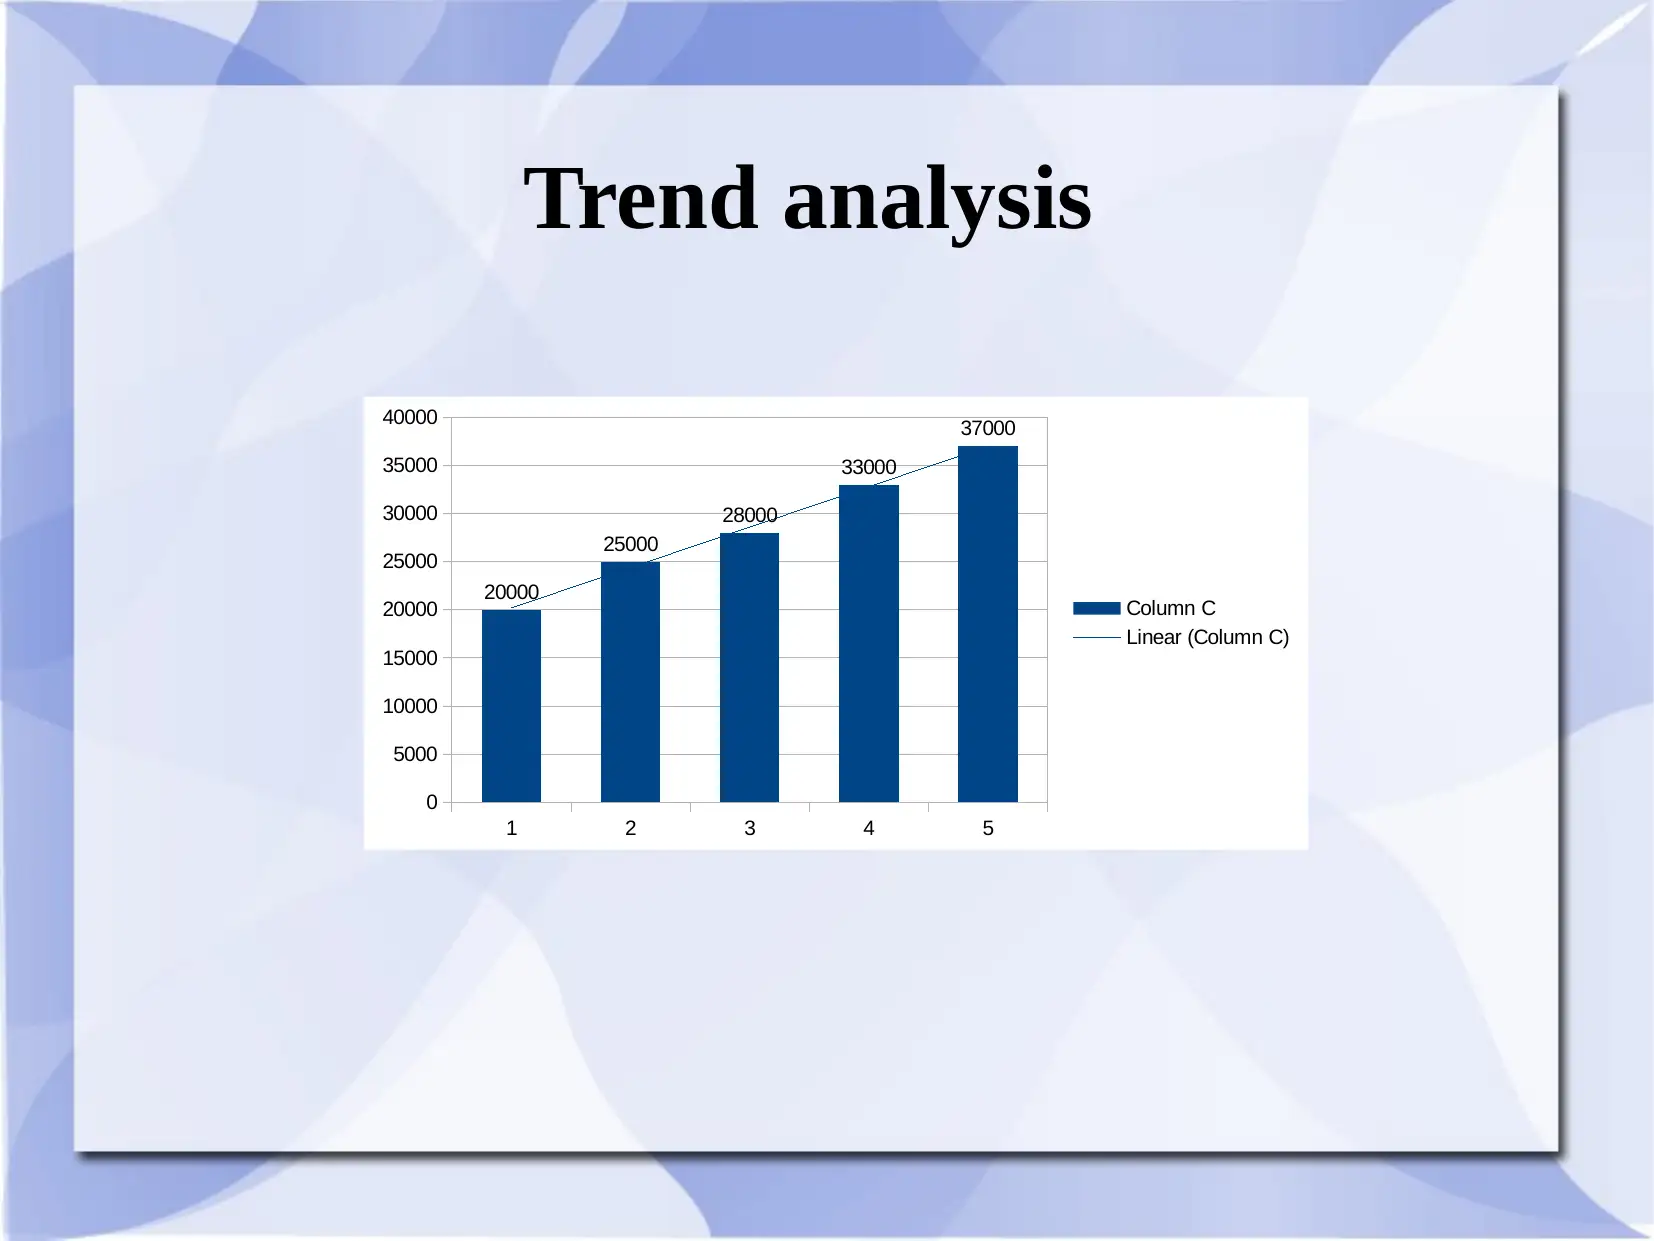
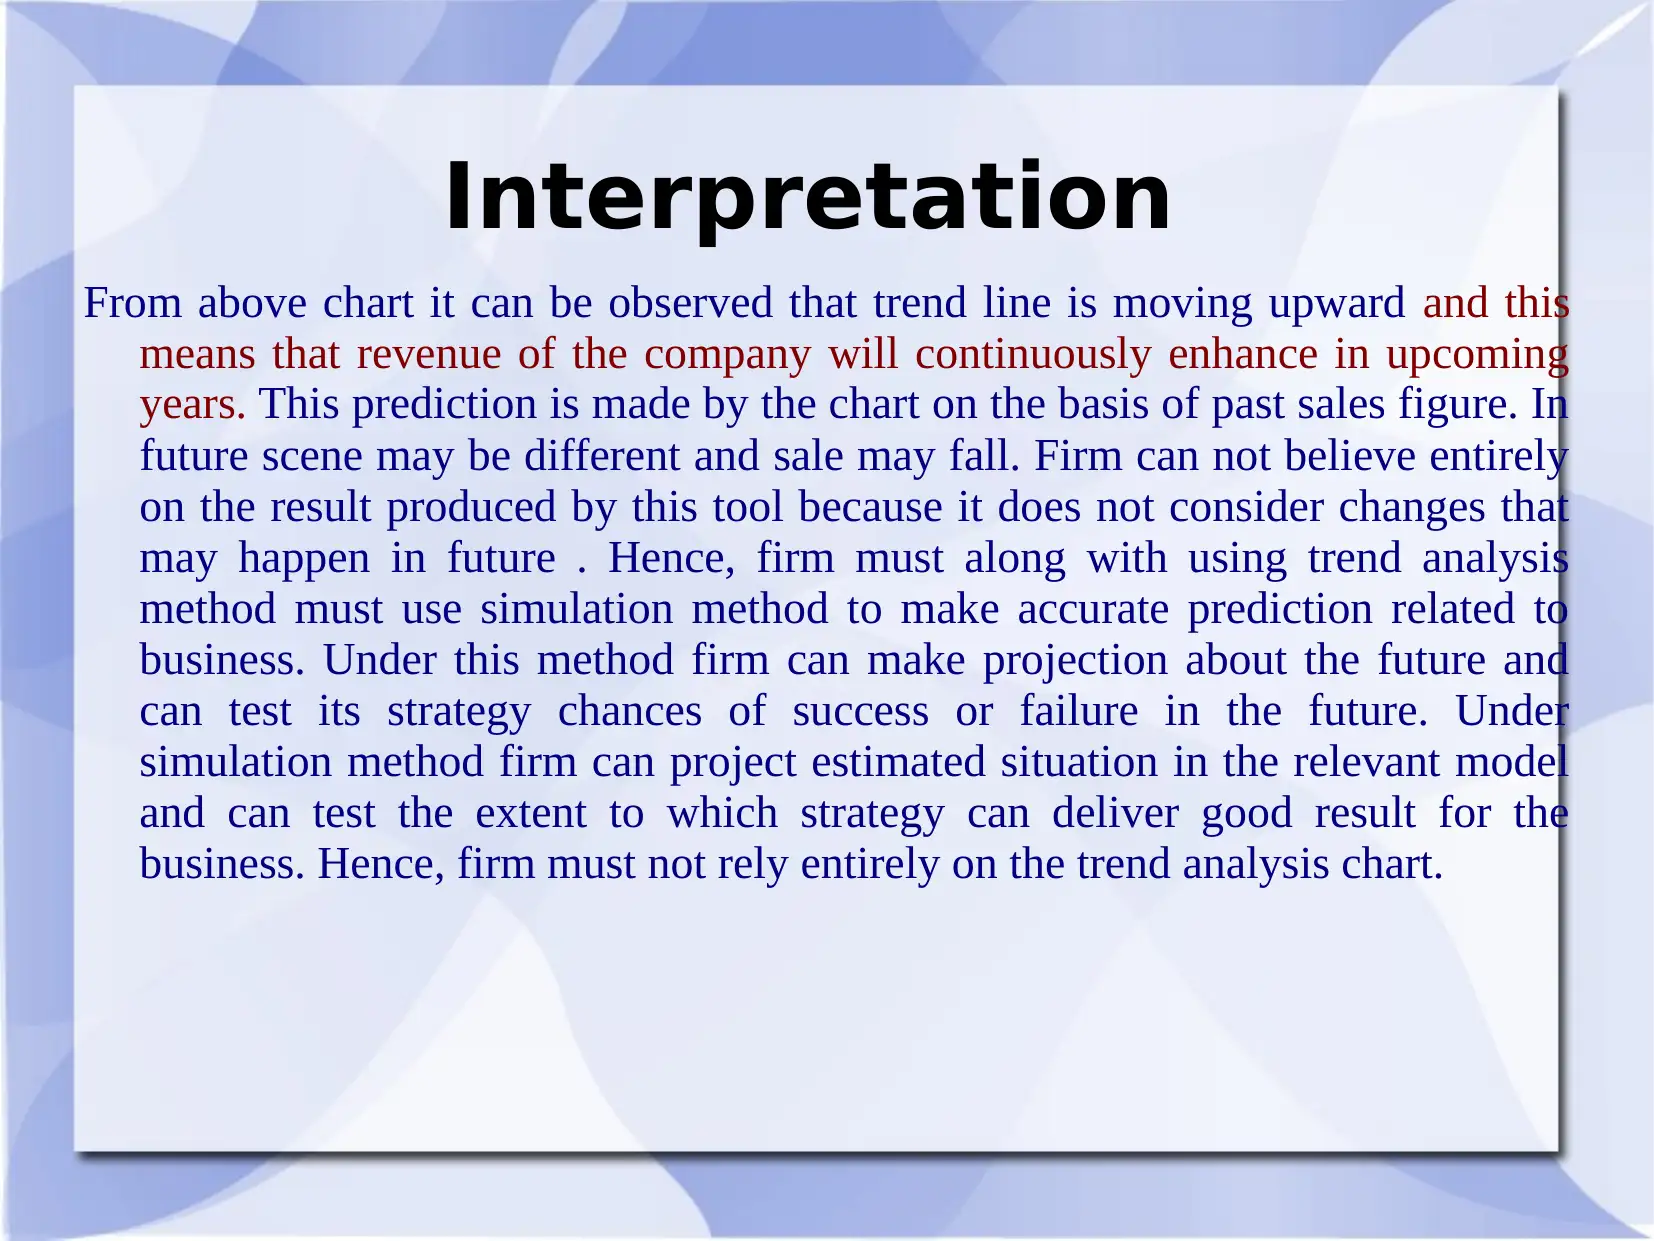
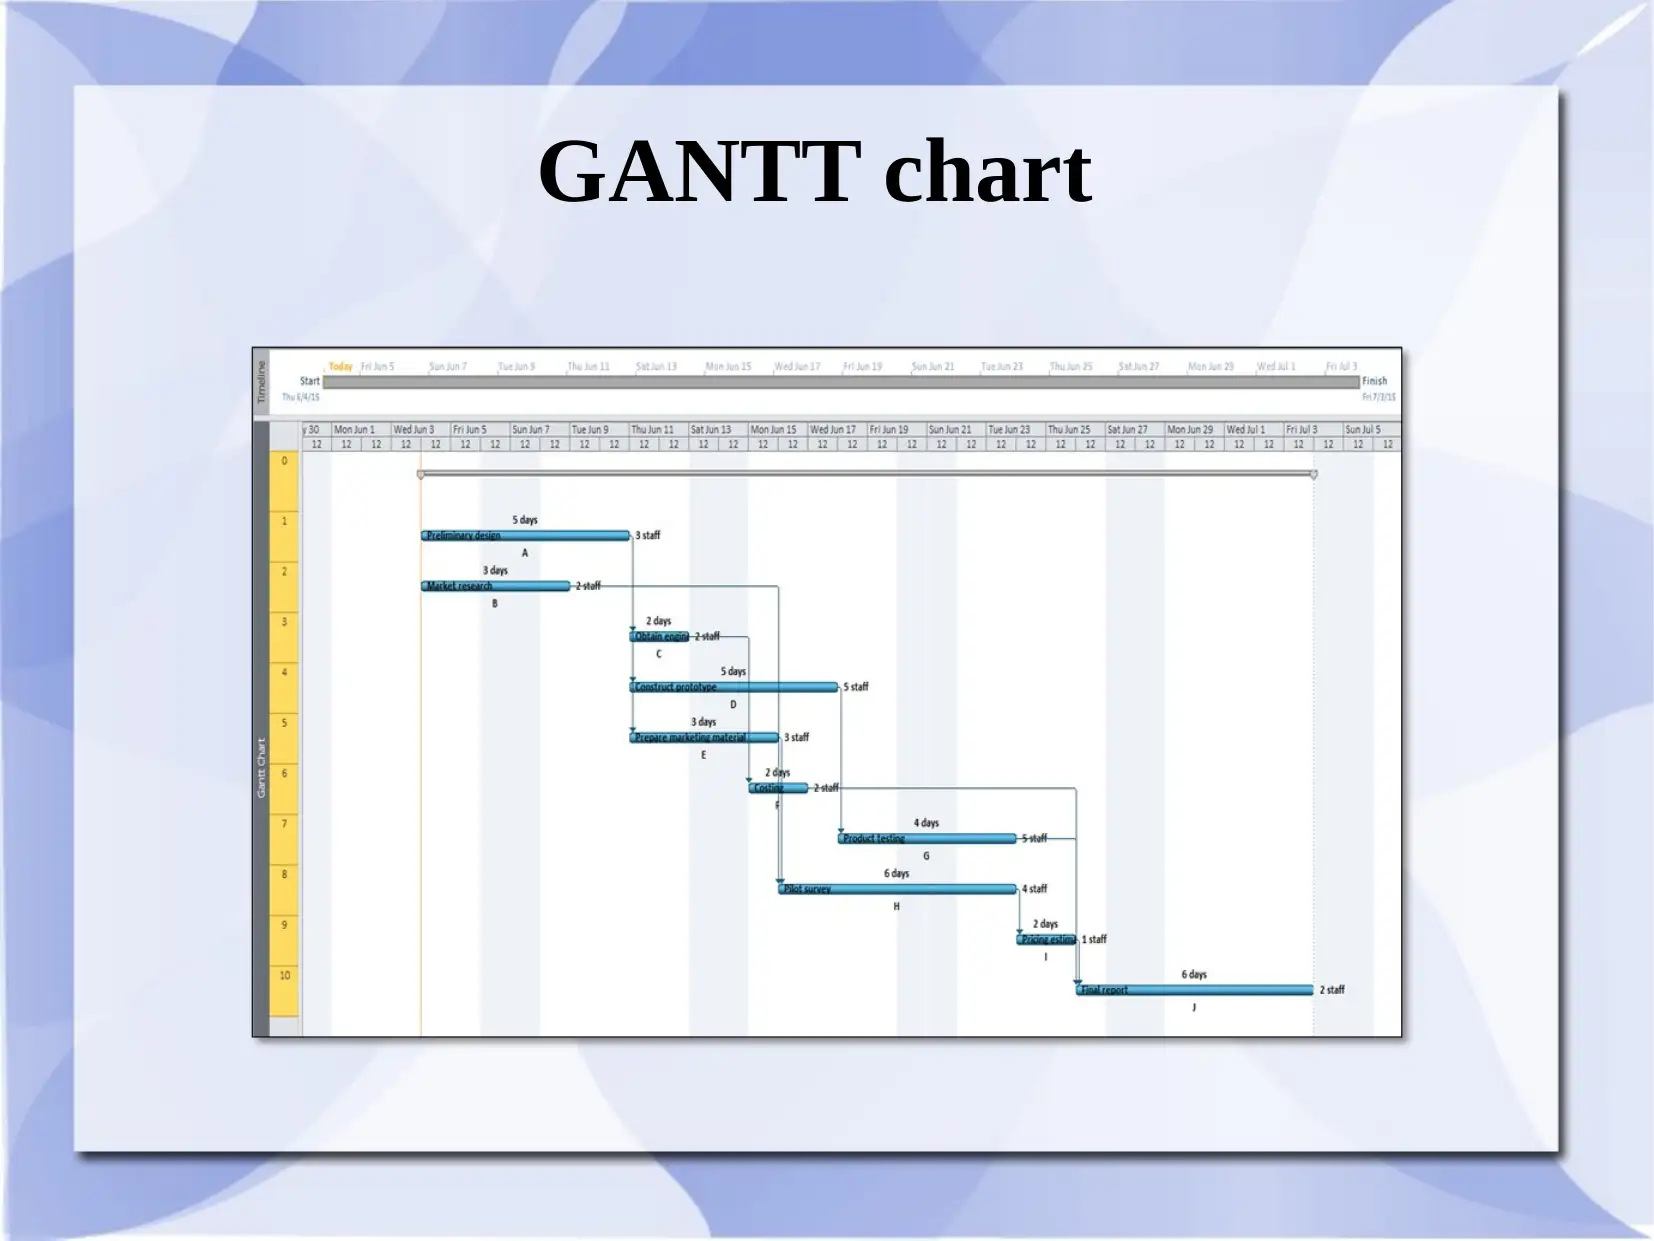
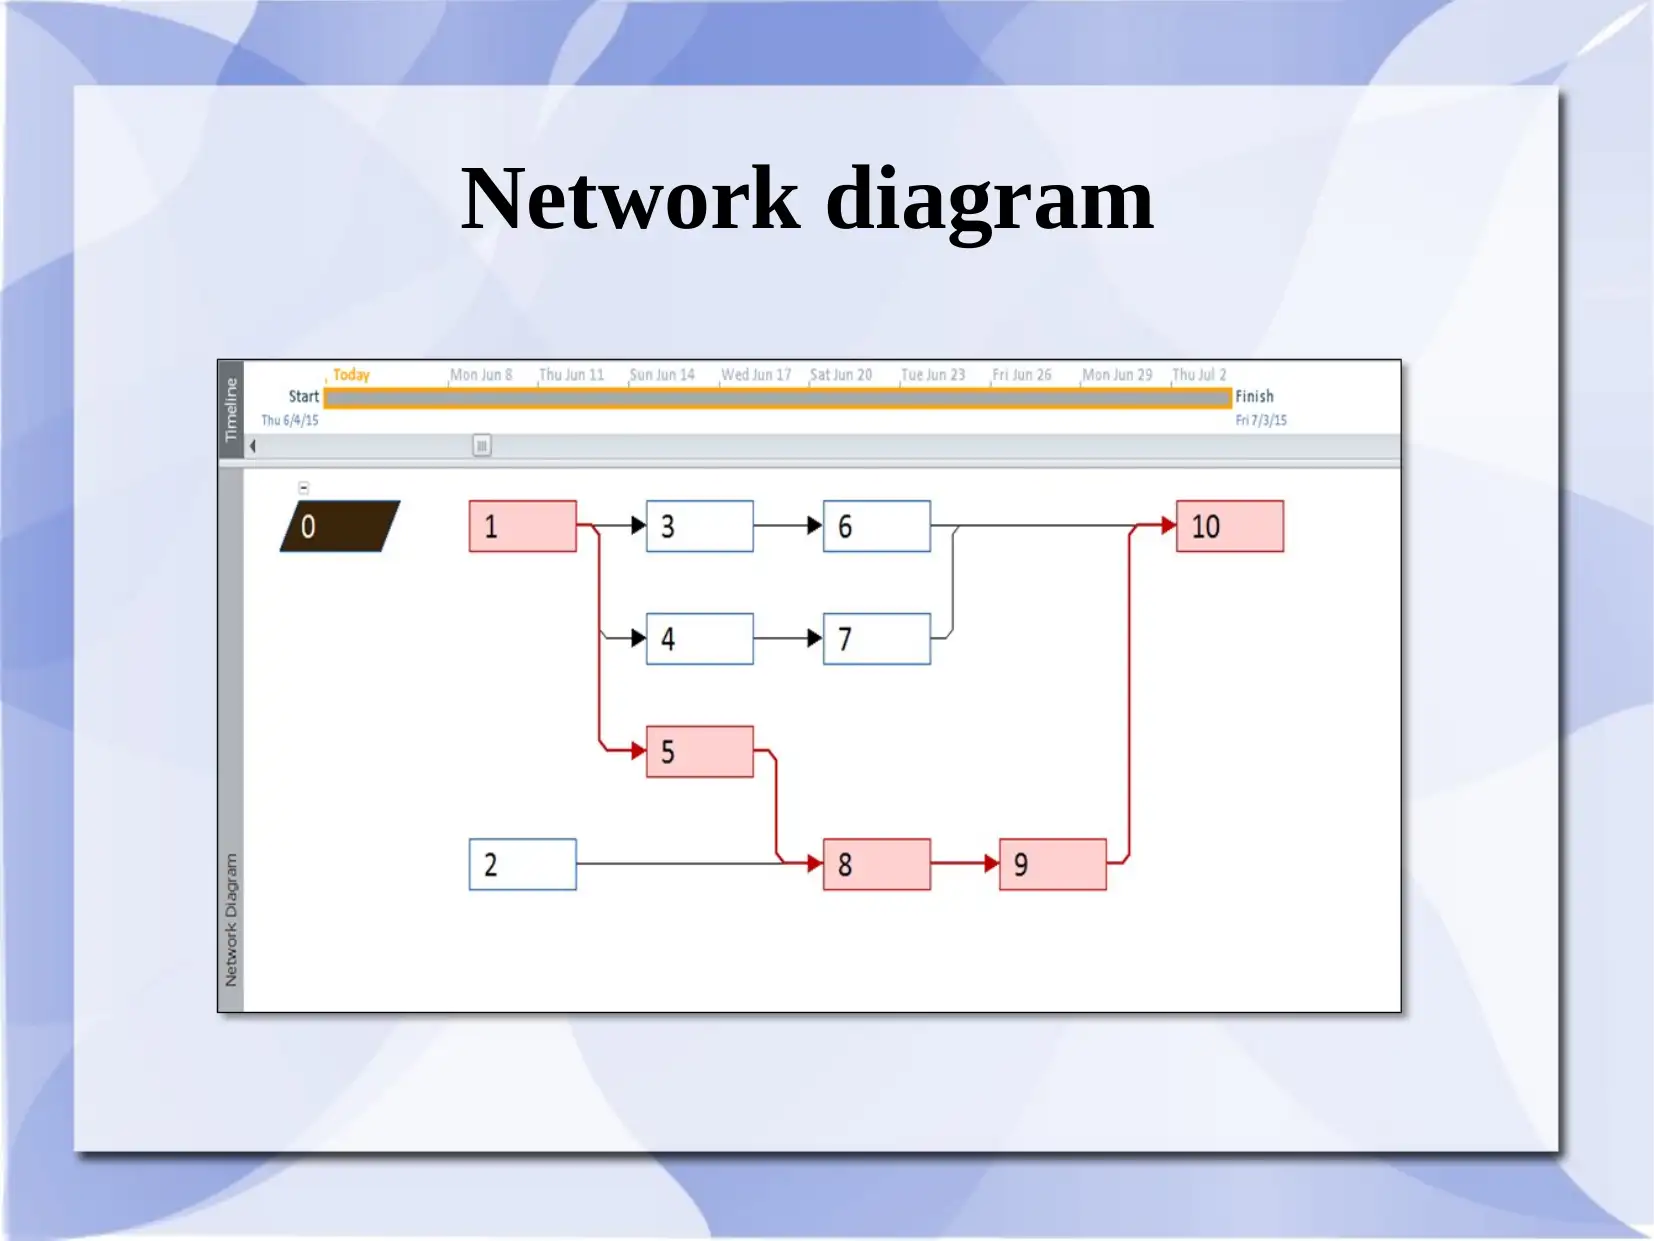
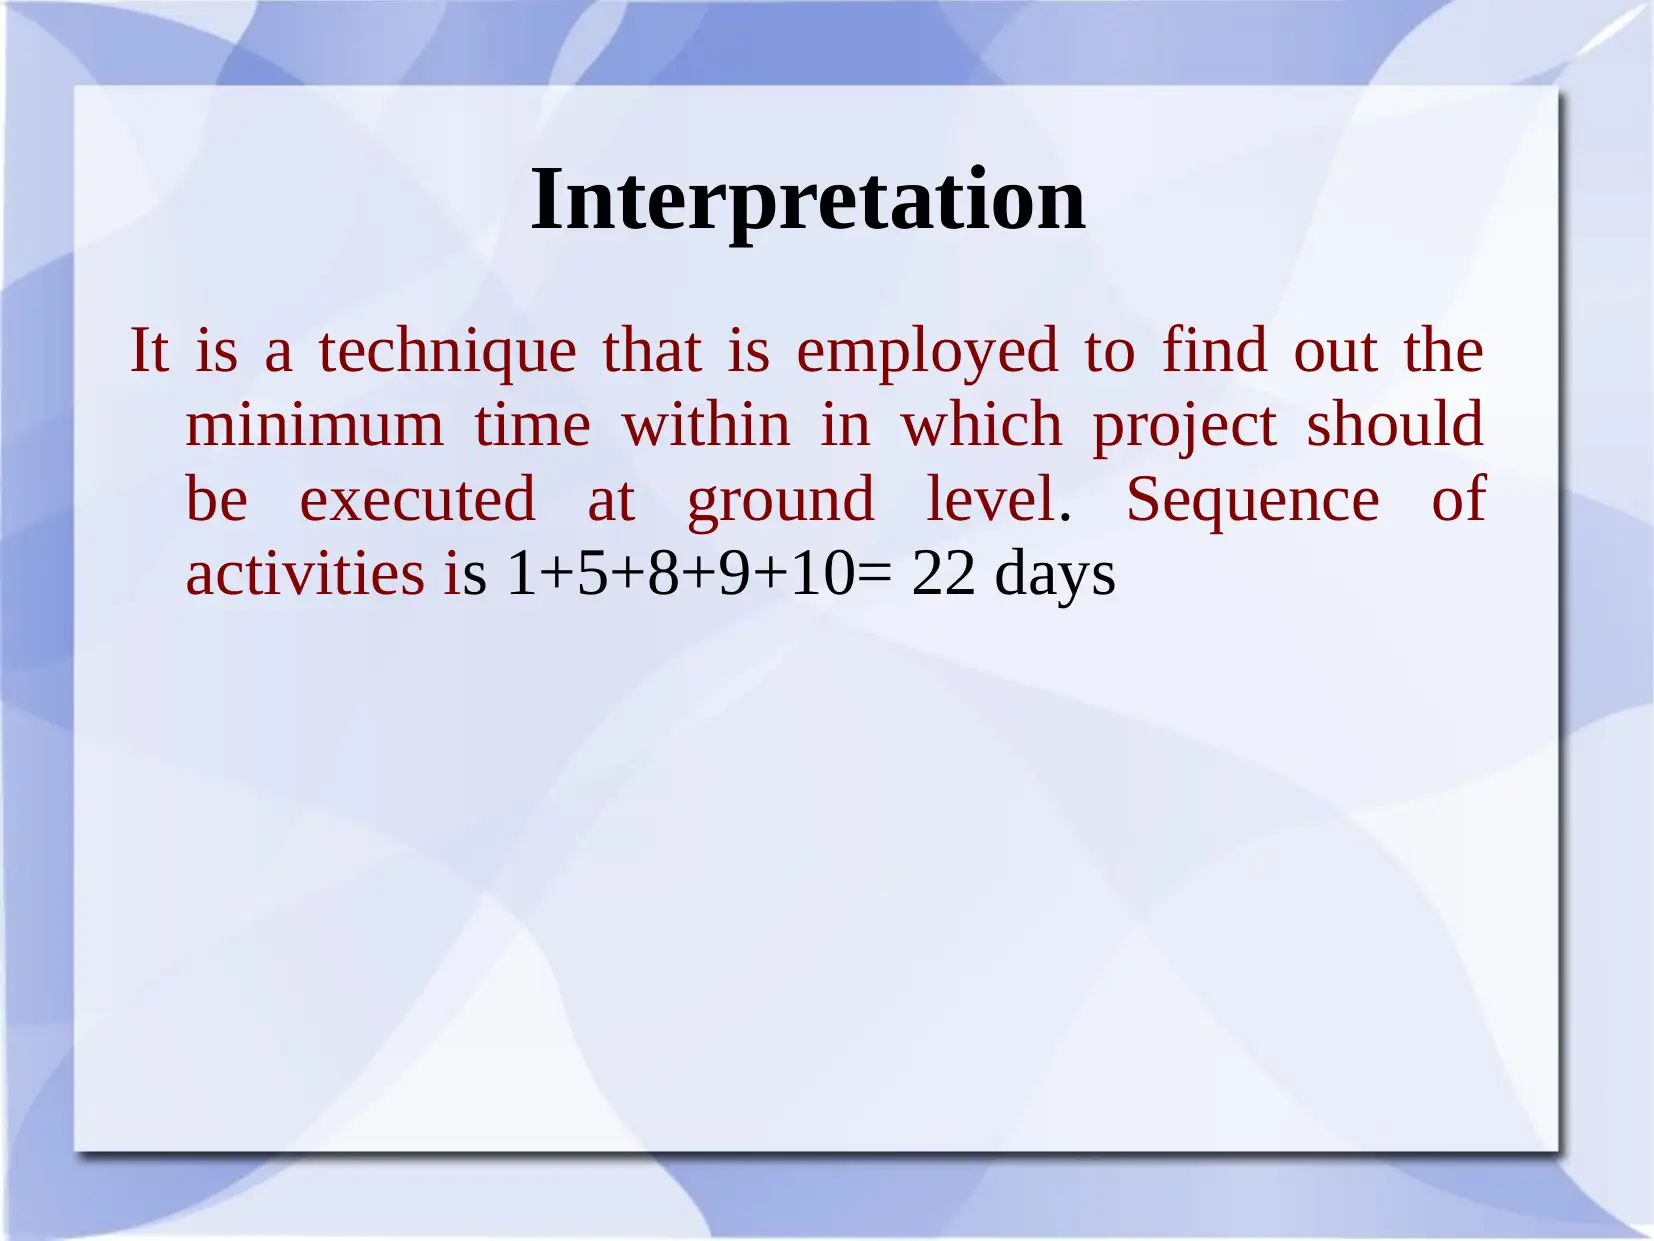
This report analyzes Food for Friends, examining customer preferences, trend analysis, and project management tools. The analysis indicates that customers prioritize price and food quality. The report suggests that Food for Friends should offer competitive pricing and high-quality food, especially regional and Chinese dishes. Trend analysis indicates an upward revenue trend, but the report recommends using simulation methods for more accurate future predictions. The report also includes a Gantt chart to determine the minimum project execution time. The report provides recommendations for future business decisions and strategies based on the analysis of the available data.
Document Page
BUSINESS DECISION MAKING
tabler-icon-diamond-filled.svg

Paraphrase This Document

Need a fresh take? Get an instant paraphrase of this document with our AI Paraphraser
Document Page
People response on factors which
influence them to visit Food for
Friends?
Taste for food Ambience Price Service quality
0
2
4
6
8
10
12
14
16
18
20
Column C
Document Page
Interpretation
Majority of people are giving priority to price and
taste of food. Hence, food for friend needs to
provide product at cheaper price and of the best
quality which is enriched in taste.
Document Page
What kind of food you like to
eat?
15
10 5
20
Chinese
Continental
Spanish
Regional
tabler-icon-diamond-filled.svg

Paraphrase This Document

Need a fresh take? Get an instant paraphrase of this document with our AI Paraphraser
Document Page
Interpretation
Above image is reflecting that majority of the
respondents prefer to eat regional and Chinese
dishes. Hence, Food for friend needs to serve
this two dishes on its restaurant.
Document Page
Trend analysis
1 2 3 4 5
0
5000
10000
15000
20000
25000
30000
35000
40000
20000
25000
28000
33000
37000
Column C
Linear (Column C)
Document Page
Interpretation
From above chart it can be observed that trend line is moving upward and this
means that revenue of the company will continuously enhance in upcoming
years. This prediction is made by the chart on the basis of past sales figure. In
future scene may be different and sale may fall. Firm can not believe entirely
on the result produced by this tool because it does not consider changes that
may happen in future . Hence, firm must along with using trend analysis
method must use simulation method to make accurate prediction related to
business. Under this method firm can make projection about the future and
can test its strategy chances of success or failure in the future. Under
simulation method firm can project estimated situation in the relevant model
and can test the extent to which strategy can deliver good result for the
business. Hence, firm must not rely entirely on the trend analysis chart.
tabler-icon-diamond-filled.svg

Paraphrase This Document

Need a fresh take? Get an instant paraphrase of this document with our AI Paraphraser
Document Page
GANTT chart
Document Page
Network diagram
Document Page
Interpretation
It is a technique that is employed to find out the
minimum time within in which project should
be executed at ground level. Sequence of
activities is 1+5+8+9+10= 22 days
tabler-icon-diamond-filled.svg

Paraphrase This Document

Need a fresh take? Get an instant paraphrase of this document with our AI Paraphraser
Document Page
References
Gibbons, J.D. and Chakraborti, S., 2011.
Nonparametric statistical inference (pp. 977-979).
Springer Berlin Heidelberg.
Huber, P.J., 2011. Robust statistics. Springer Berlin
Heidelberg.
Karlan, D. and Valdivia, M., 2011. Teaching
entrepreneurship: Impact of business training on
microfinance clients and institutions. Review of
Economics and statistics. 93(2). pp.510-527.
Document Page
Thank you
chevron_up_icon
1 out of 12
circle_padding
hide_on_mobile
zoom_out_icon
[object Object]