Business Analysis Report: Statistical Analysis of BLITZ Store Data
VerifiedAdded on 2020/05/28
|8
|1153
|66
Report
AI Summary
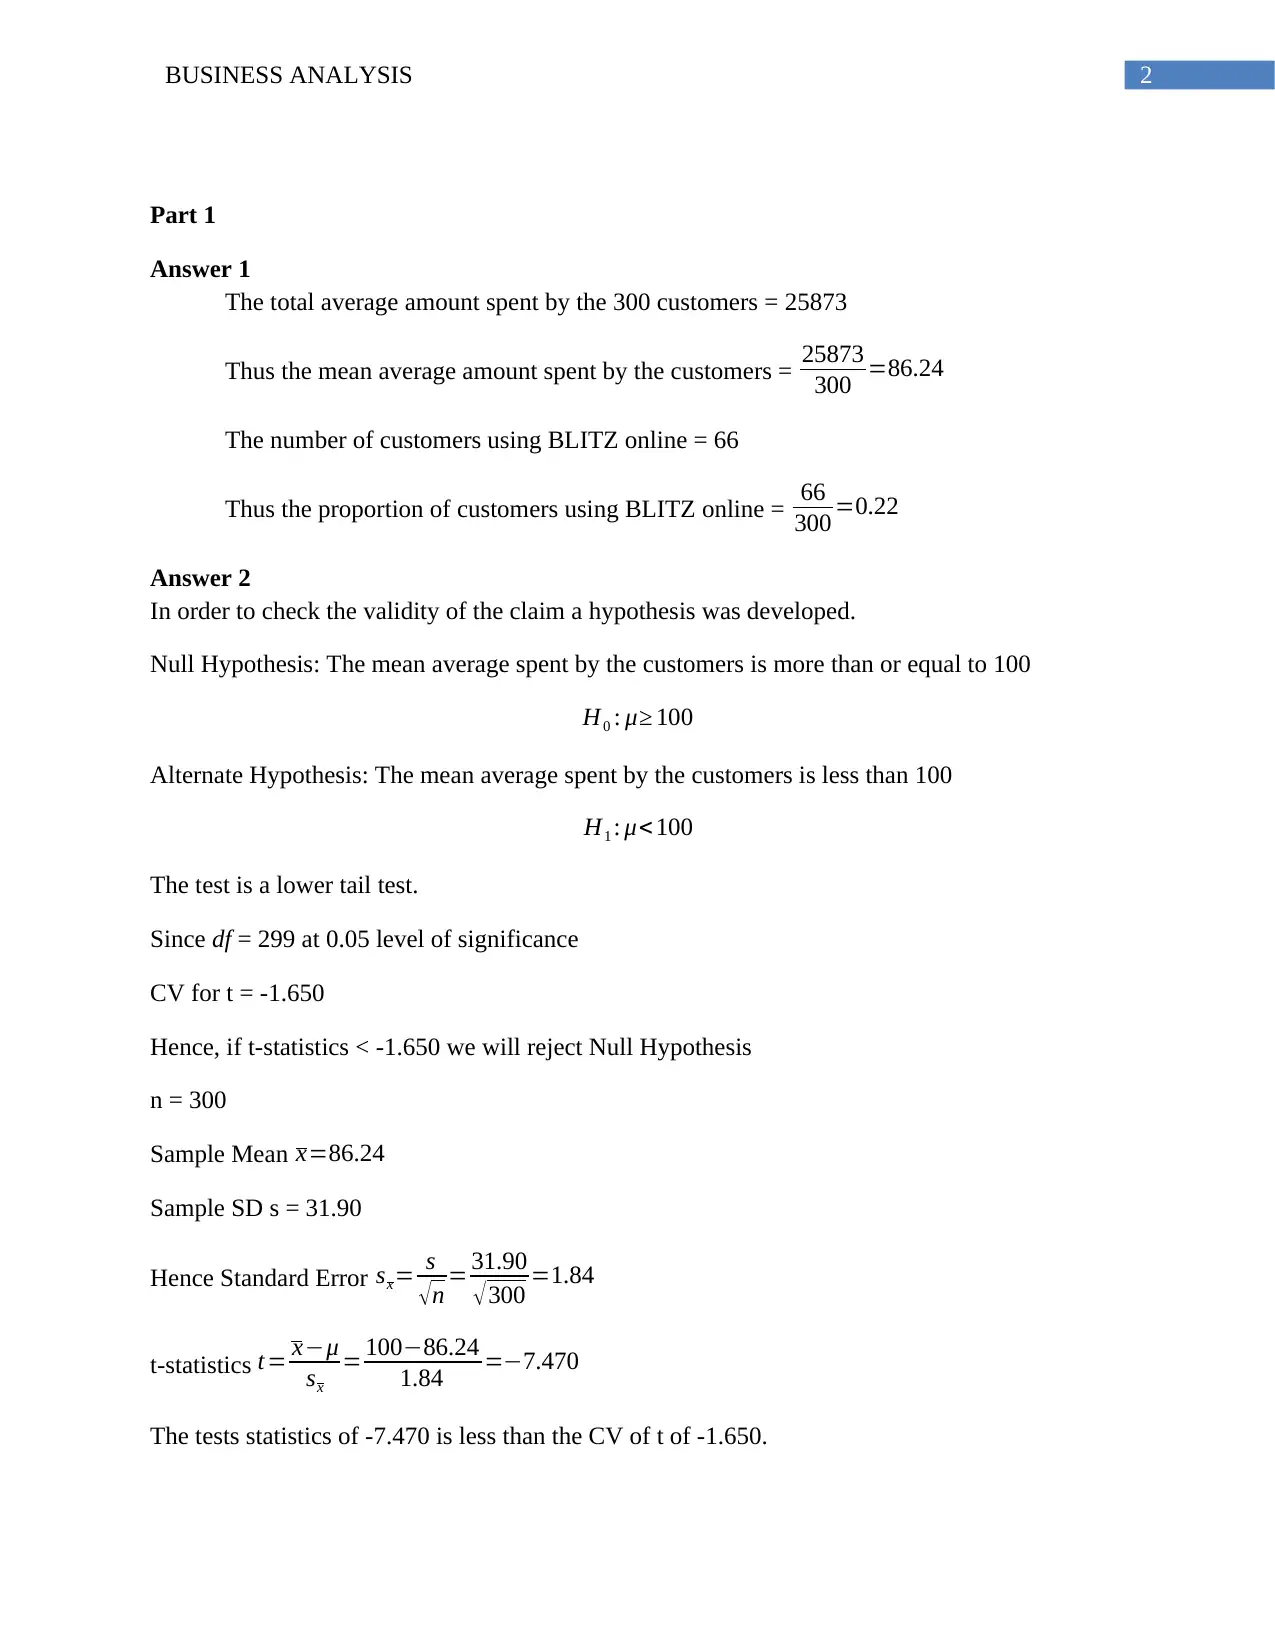
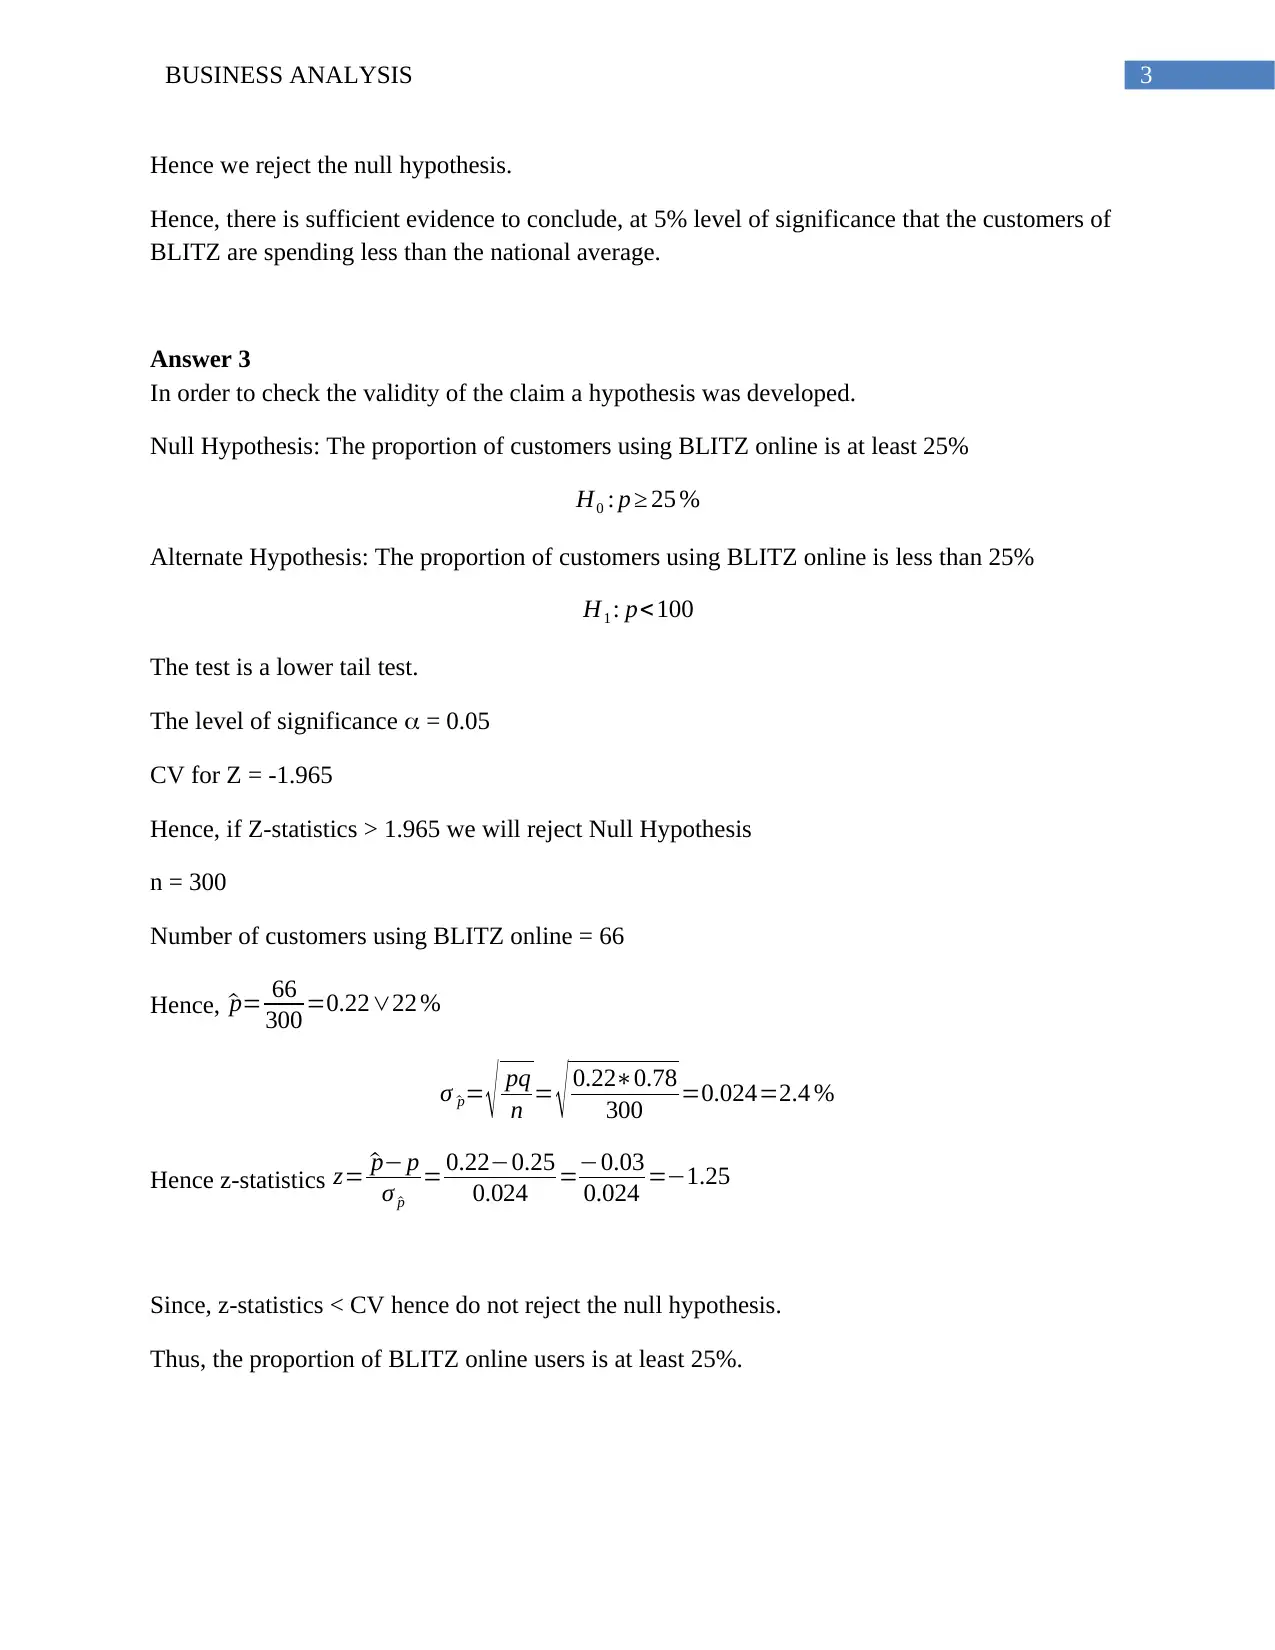
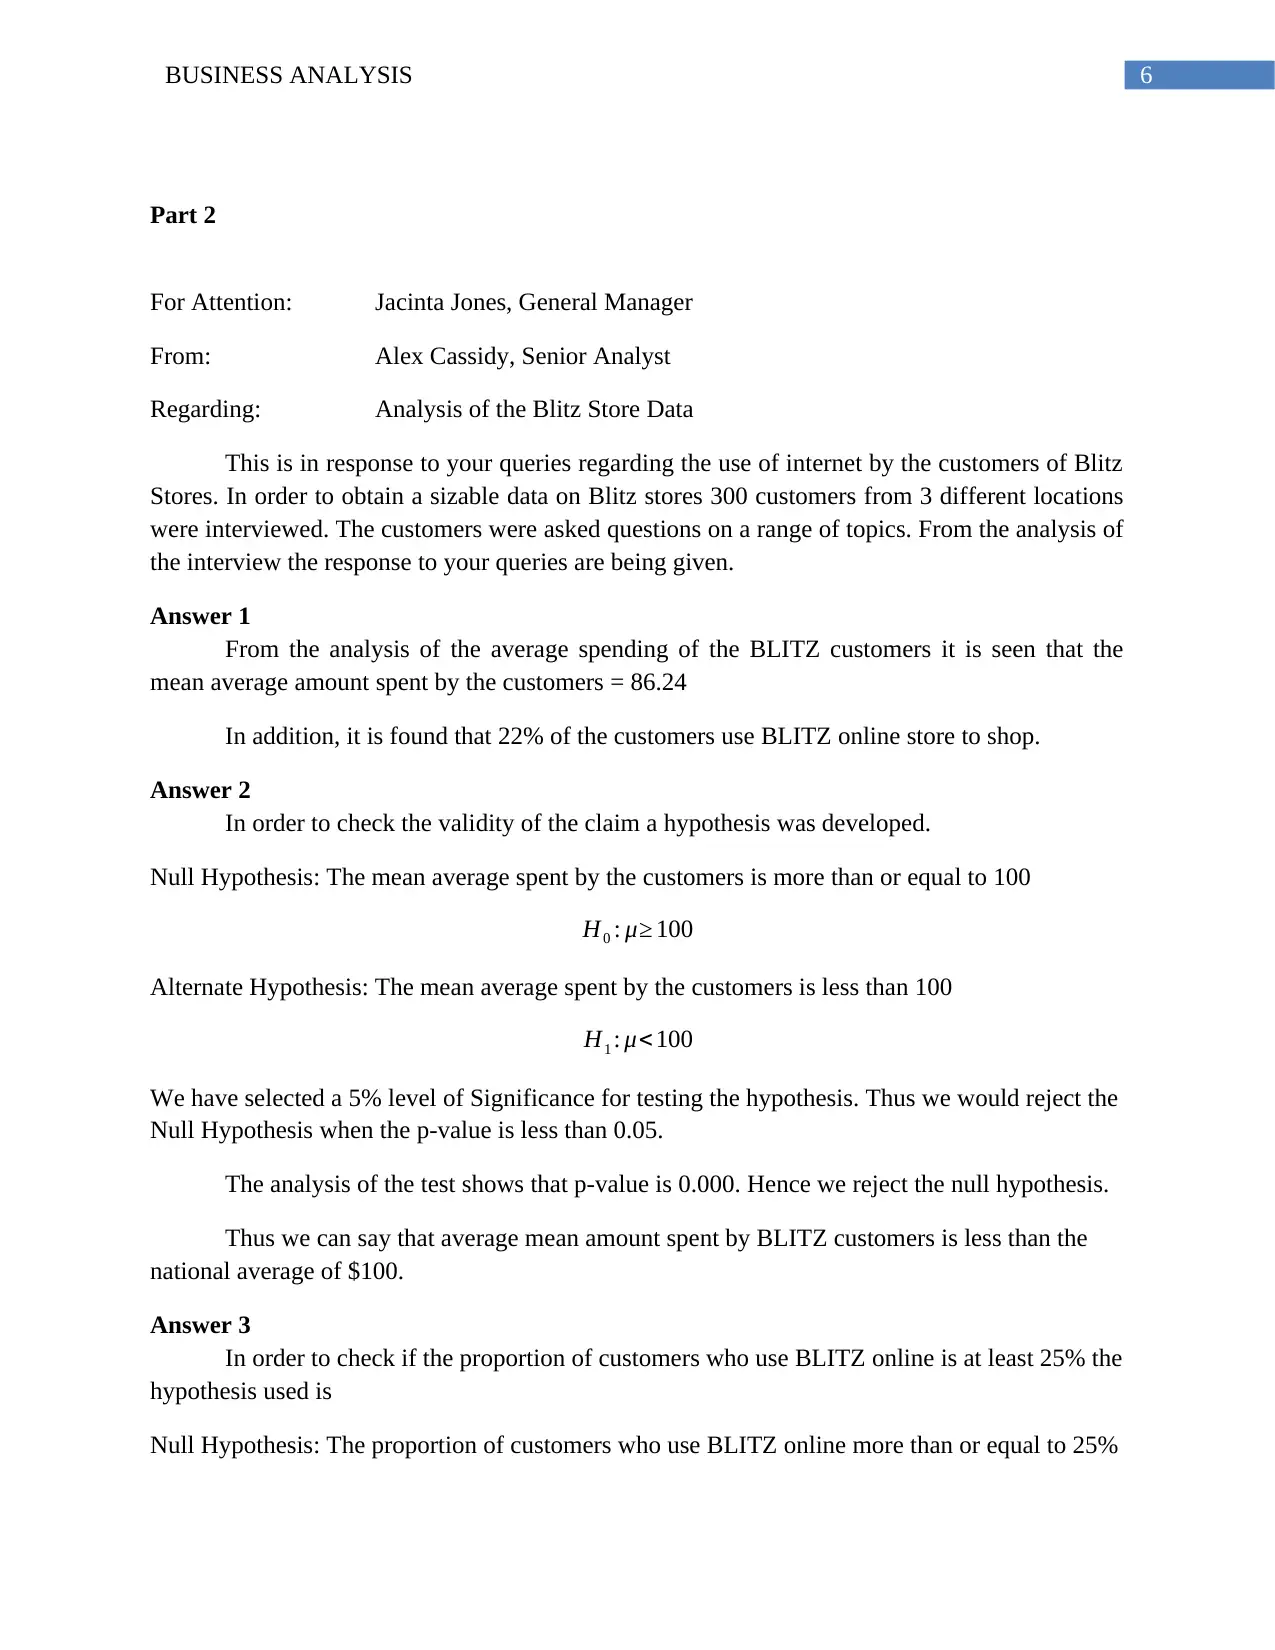
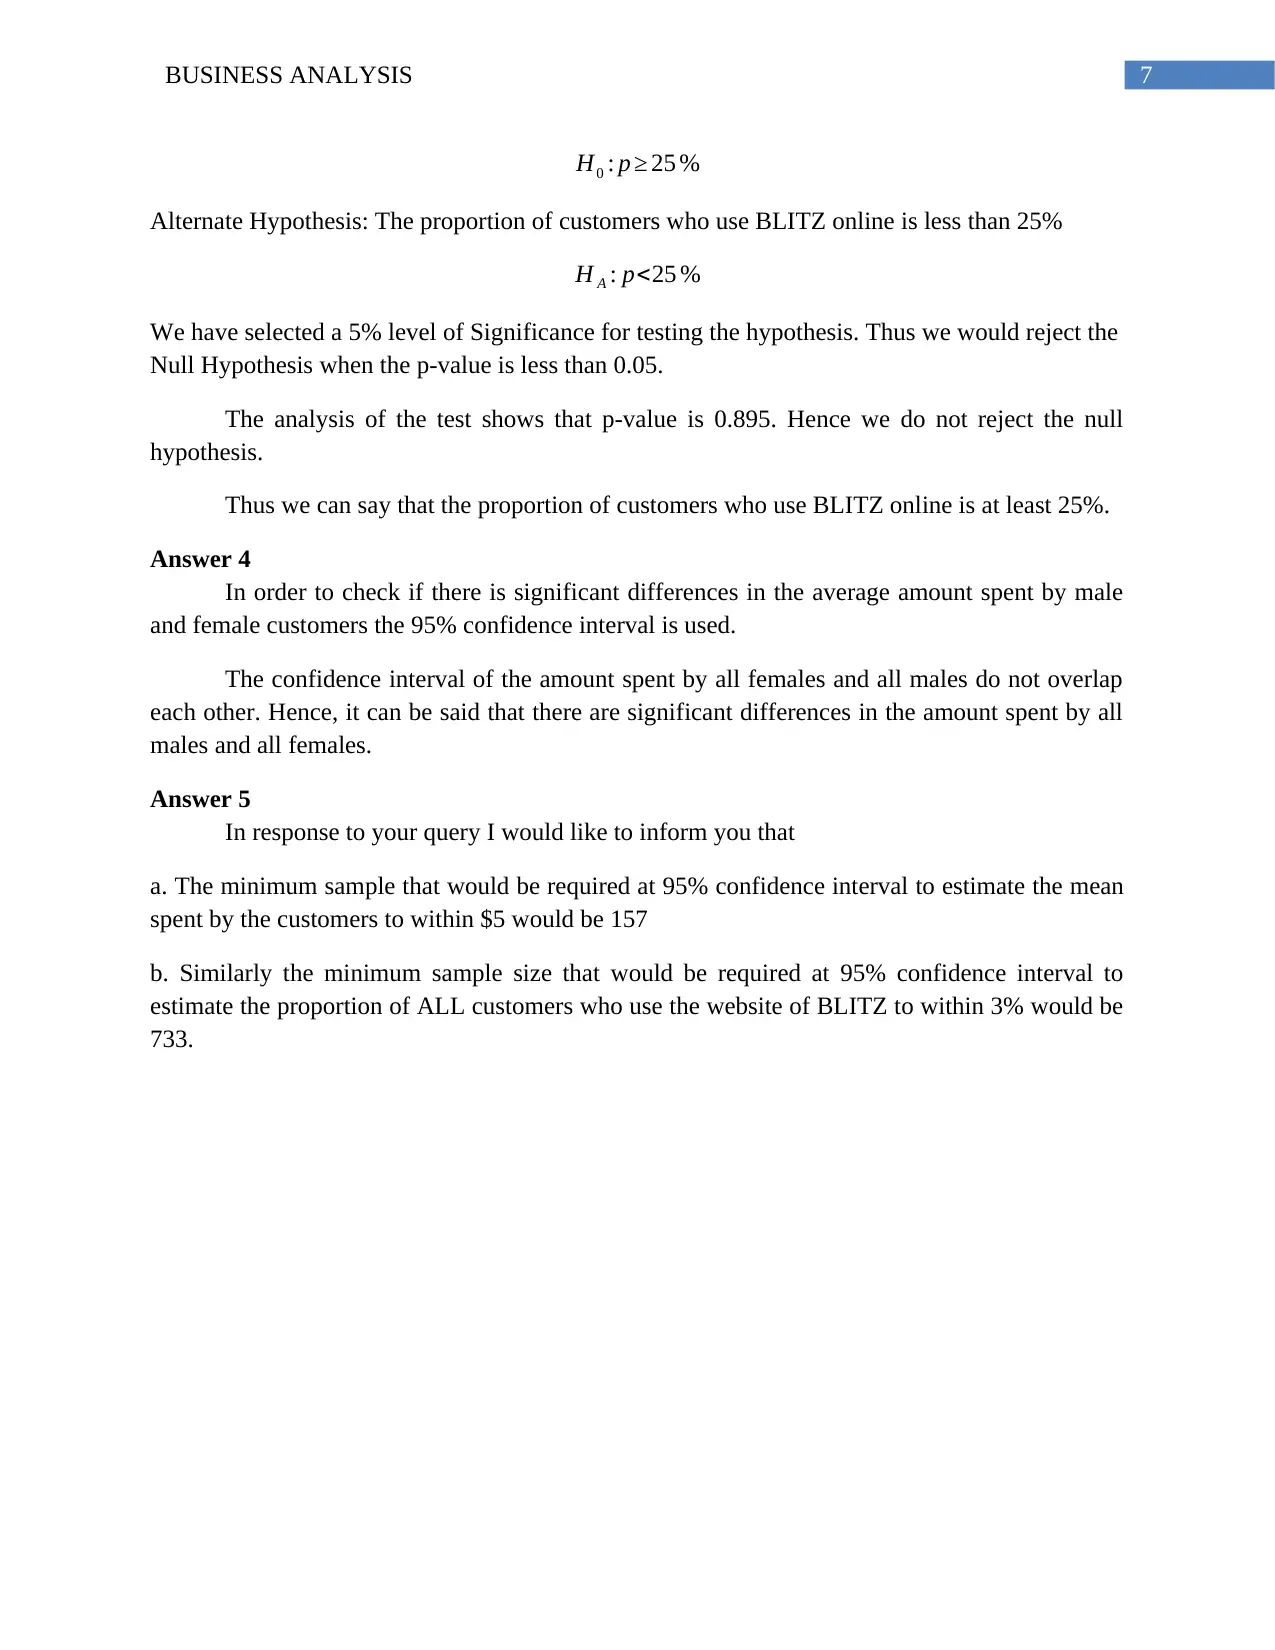
This report presents a comprehensive business analysis of customer data from BLITZ stores. It includes statistical analyses, hypothesis testing, and confidence interval calculations to evaluate customer spending patterns, online usage, and potential differences between male and female customers. The report addresses specific queries regarding customer behavior, the validity of claims about spending habits, and the proportion of online users. Furthermore, it provides recommendations on the required sample sizes for future studies. The analysis covers key metrics such as average spending, proportion of online users, and margin of error, offering valuable insights into customer behavior and business performance. The report concludes with a summary of findings and recommendations for the general manager, Jacinta Jones.

Running head: BUSINESS ANALYSIS
Business Analysis
Name of the student
Name of the university
Author’s note
Business Analysis
Name of the student
Name of the university
Author’s note
Paraphrase This Document
Need a fresh take? Get an instant paraphrase of this document with our AI Paraphraser

1BUSINESS ANALYSIS
Table of Contents
Part 1................................................................................................................................................2
Answer 1......................................................................................................................................2
Answer 2......................................................................................................................................2
Answer 3......................................................................................................................................3
Answer 4......................................................................................................................................3
Answer 5......................................................................................................................................4
Part 2................................................................................................................................................6
Answer 1......................................................................................................................................6
Answer 2......................................................................................................................................6
Answer 3......................................................................................................................................6
Answer 4......................................................................................................................................7
Answer 5......................................................................................................................................7

2BUSINESS ANALYSIS
Part 1
Answer 1
The total average amount spent by the 300 customers = 25873
Thus the mean average amount spent by the customers = 25873
300 =86.24
The number of customers using BLITZ online = 66
Thus the proportion of customers using BLITZ online = 66
300 =0.22
Answer 2
In order to check the validity of the claim a hypothesis was developed.
Null Hypothesis: The mean average spent by the customers is more than or equal to 100
H0 : μ≥ 100
Alternate Hypothesis: The mean average spent by the customers is less than 100
H1 : μ< 100
The test is a lower tail test.
Since df = 299 at 0.05 level of significance
CV for t = -1.650
Hence, if t-statistics < -1.650 we will reject Null Hypothesis
n = 300
Sample Mean x=86.24
Sample SD s = 31.90
Hence Standard Error sx= s
√n = 31.90
√300 =1.84
t-statistics t= x−μ
sx
= 100−86.24
1.84 =−7.470
The tests statistics of -7.470 is less than the CV of t of -1.650.
⊘ This is a preview!⊘
Do you want full access?
Subscribe today to unlock all pages.

Trusted by 1+ million students worldwide

3BUSINESS ANALYSIS
Hence we reject the null hypothesis.
Hence, there is sufficient evidence to conclude, at 5% level of significance that the customers of
BLITZ are spending less than the national average.
Answer 3
In order to check the validity of the claim a hypothesis was developed.
Null Hypothesis: The proportion of customers using BLITZ online is at least 25%
H0 : p ≥ 25 %
Alternate Hypothesis: The proportion of customers using BLITZ online is less than 25%
H1 : p< 100
The test is a lower tail test.
The level of significance = 0.05
CV for Z = -1.965
Hence, if Z-statistics > 1.965 we will reject Null Hypothesis
n = 300
Number of customers using BLITZ online = 66
Hence, ^p= 66
300 =0.22∨22 %
σ ^p= √ pq
n = √ 0.22∗0.78
300 =0.024=2.4 %
Hence z-statistics z= ^p− p
σ ^p
= 0.22−0.25
0.024 =−0.03
0.024 =−1.25
Since, z-statistics < CV hence do not reject the null hypothesis.
Thus, the proportion of BLITZ online users is at least 25%.
Paraphrase This Document
Need a fresh take? Get an instant paraphrase of this document with our AI Paraphraser

4BUSINESS ANALYSIS
Answer 4
The mean amount spent by All Females = 104.70.
The standard deviation of the amount spent by all females = 24.77
The number of female customers surveyed = 178
Hence, Margin of error (All females) = 1.96∗
( 24.77
√178 )=1.96∗( 24.77
13.34 )=3.64
Thus the lower limit of the confidence interval for females = 104.70 – 3.64 = 101.06
The upper limit of the confidence interval for females = 104.70+3.64 = 108.34
The mean amount spent by All Male = 59.31.
The standard deviation of the amount spent by all males = 19.59
The number of male customers surveyed = 122
Hence, Margin of error (All males) = 1.96∗( 19.59
√ 122 ) =1.96∗( 19.59
11.05 )=3.47
Thus the lower limit of the confidence interval for males = 59.31– 3.47 = 55.84
The upper limit of the confidence interval for males = 59.31+3.47= 62.78
So, 95% confidence interval = 59.31 ±3.47 = 55.84 to 62.78
Since the confidence intervals do not overlap each other hence, there are significant differences
in the amount spent by all males and all female customers.
Answer 5
Part a
To calculate the minimum sample size required the formula = n= z2 σ 2
M E2
At 95% confidence interval z=1.96
The standard deviation of the amount spent by all the customers = 31.90
The margin of error = 5

5BUSINESS ANALYSIS
Hence, n=1.962∗31.902
52 =157
Part b
To calculate the minimum sample size required the formula = n= z2 p (1− p)
M E2
At 95% confidence interval z=1.96
The proportion of customers who use online website = 0.22
The margin of error = 3% = 0.003
Hence, n=1.962∗0.22∗(1−0.22)
0.032 =732.47 ≈ 733
Hence, n=1.962∗31.902
52 =157
Part b
To calculate the minimum sample size required the formula = n= z2 p (1− p)
M E2
At 95% confidence interval z=1.96
The proportion of customers who use online website = 0.22
The margin of error = 3% = 0.003
Hence, n=1.962∗0.22∗(1−0.22)
0.032 =732.47 ≈ 733
⊘ This is a preview!⊘
Do you want full access?
Subscribe today to unlock all pages.

Trusted by 1+ million students worldwide

6BUSINESS ANALYSIS
Part 2
For Attention: Jacinta Jones, General Manager
From: Alex Cassidy, Senior Analyst
Regarding: Analysis of the Blitz Store Data
This is in response to your queries regarding the use of internet by the customers of Blitz
Stores. In order to obtain a sizable data on Blitz stores 300 customers from 3 different locations
were interviewed. The customers were asked questions on a range of topics. From the analysis of
the interview the response to your queries are being given.
Answer 1
From the analysis of the average spending of the BLITZ customers it is seen that the
mean average amount spent by the customers = 86.24
In addition, it is found that 22% of the customers use BLITZ online store to shop.
Answer 2
In order to check the validity of the claim a hypothesis was developed.
Null Hypothesis: The mean average spent by the customers is more than or equal to 100
H0 : μ≥ 100
Alternate Hypothesis: The mean average spent by the customers is less than 100
H1 : μ< 100
We have selected a 5% level of Significance for testing the hypothesis. Thus we would reject the
Null Hypothesis when the p-value is less than 0.05.
The analysis of the test shows that p-value is 0.000. Hence we reject the null hypothesis.
Thus we can say that average mean amount spent by BLITZ customers is less than the
national average of $100.
Answer 3
In order to check if the proportion of customers who use BLITZ online is at least 25% the
hypothesis used is
Null Hypothesis: The proportion of customers who use BLITZ online more than or equal to 25%
Paraphrase This Document
Need a fresh take? Get an instant paraphrase of this document with our AI Paraphraser

7BUSINESS ANALYSIS
H0 : p ≥ 25 %
Alternate Hypothesis: The proportion of customers who use BLITZ online is less than 25%
H A : p<25 %
We have selected a 5% level of Significance for testing the hypothesis. Thus we would reject the
Null Hypothesis when the p-value is less than 0.05.
The analysis of the test shows that p-value is 0.895. Hence we do not reject the null
hypothesis.
Thus we can say that the proportion of customers who use BLITZ online is at least 25%.
Answer 4
In order to check if there is significant differences in the average amount spent by male
and female customers the 95% confidence interval is used.
The confidence interval of the amount spent by all females and all males do not overlap
each other. Hence, it can be said that there are significant differences in the amount spent by all
males and all females.
Answer 5
In response to your query I would like to inform you that
a. The minimum sample that would be required at 95% confidence interval to estimate the mean
spent by the customers to within $5 would be 157
b. Similarly the minimum sample size that would be required at 95% confidence interval to
estimate the proportion of ALL customers who use the website of BLITZ to within 3% would be
733.
1 out of 8
Related Documents

Your All-in-One AI-Powered Toolkit for Academic Success.
+13062052269
info@desklib.com
Available 24*7 on WhatsApp / Email
Unlock your academic potential
Copyright © 2020–2025 A2Z Services. All Rights Reserved. Developed and managed by ZUCOL.