Detailed Business Analysis Report: Murano Restaurant Performance

Verified

Added on  2023/04/12

|11
|551
|439
Report
AI Summary
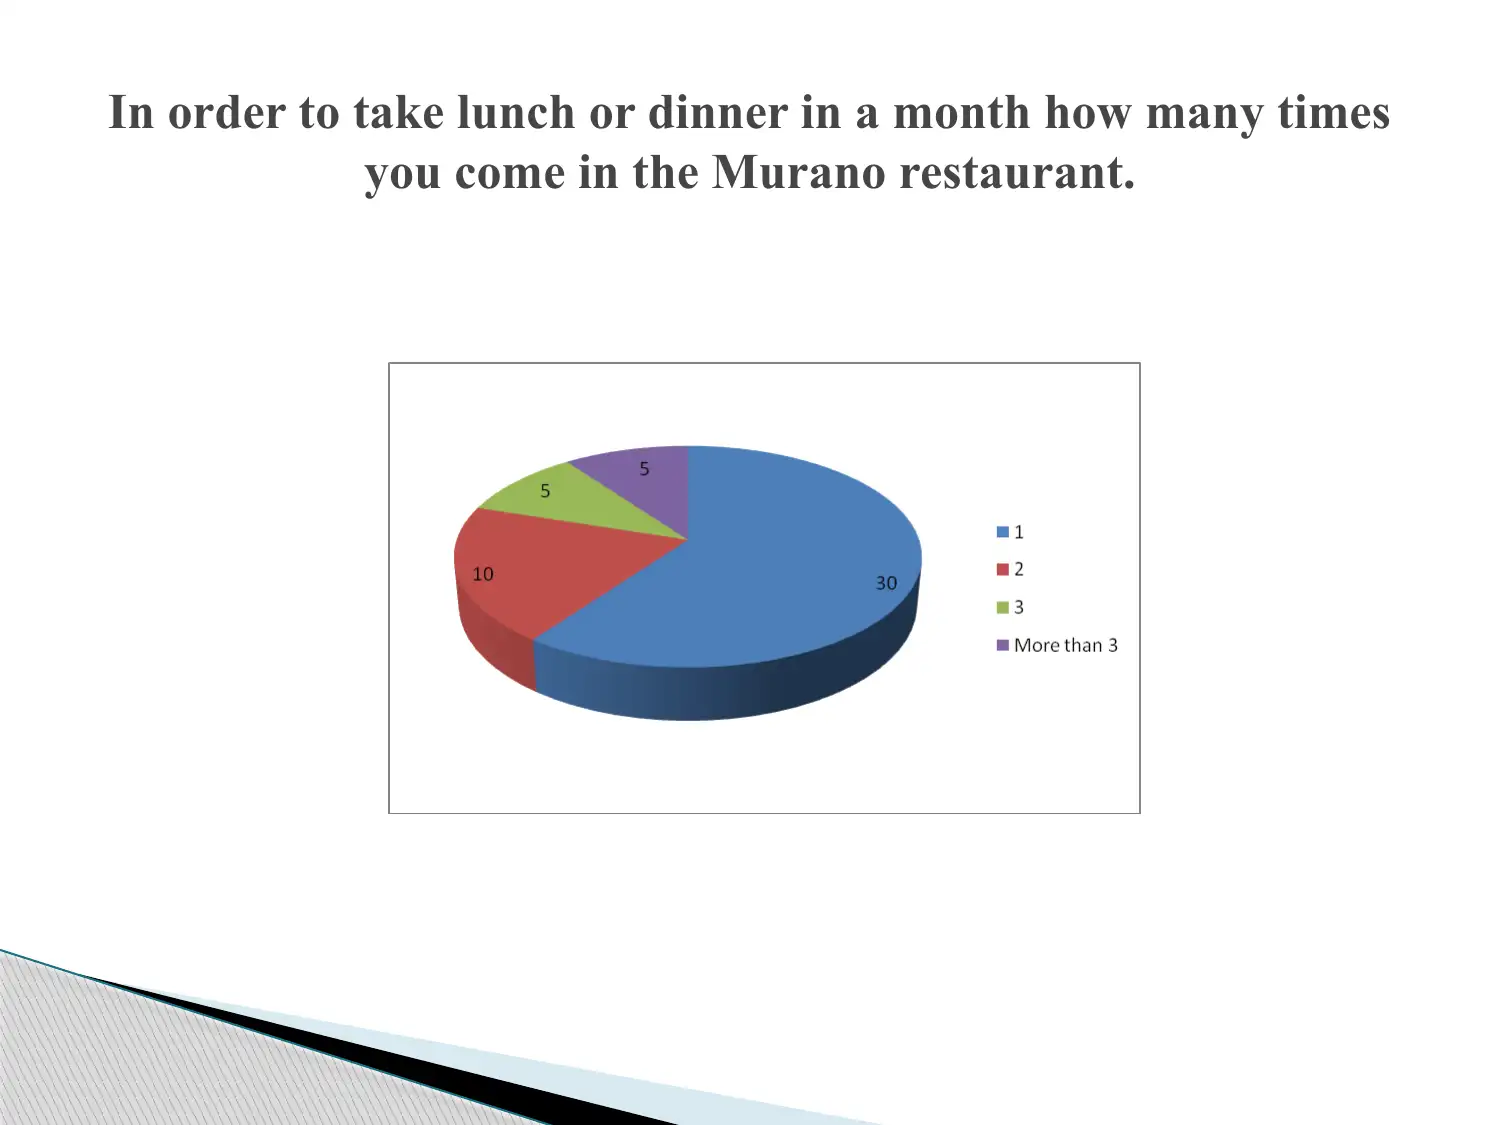
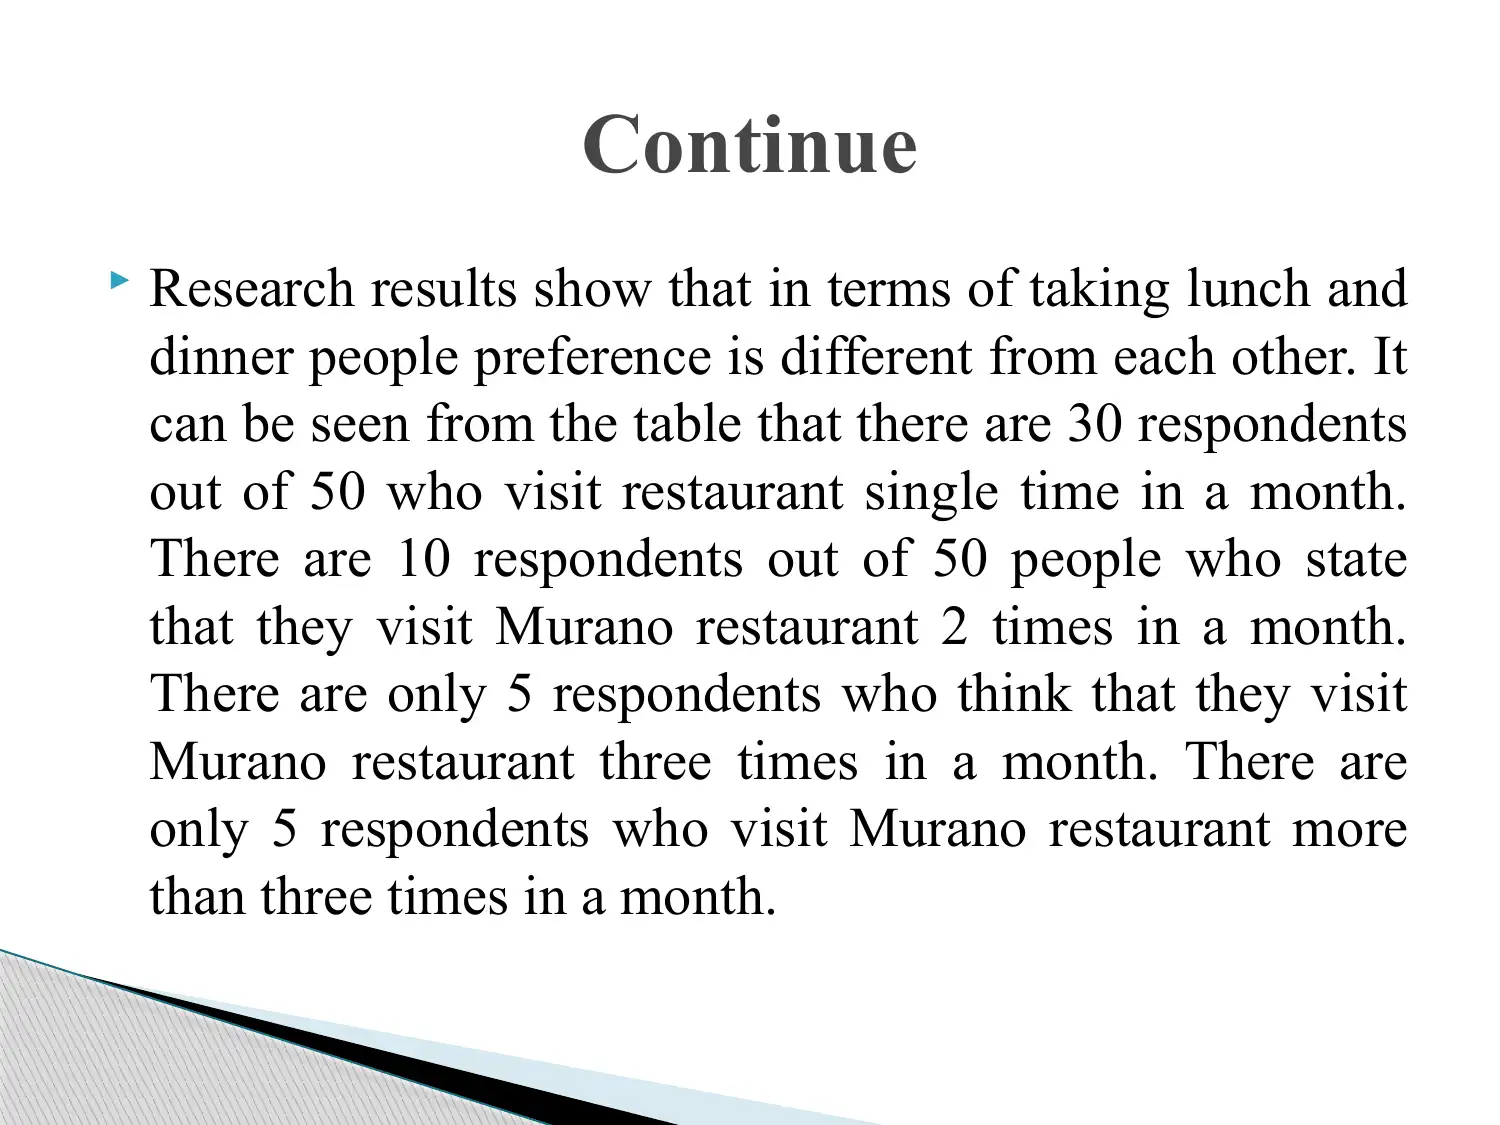
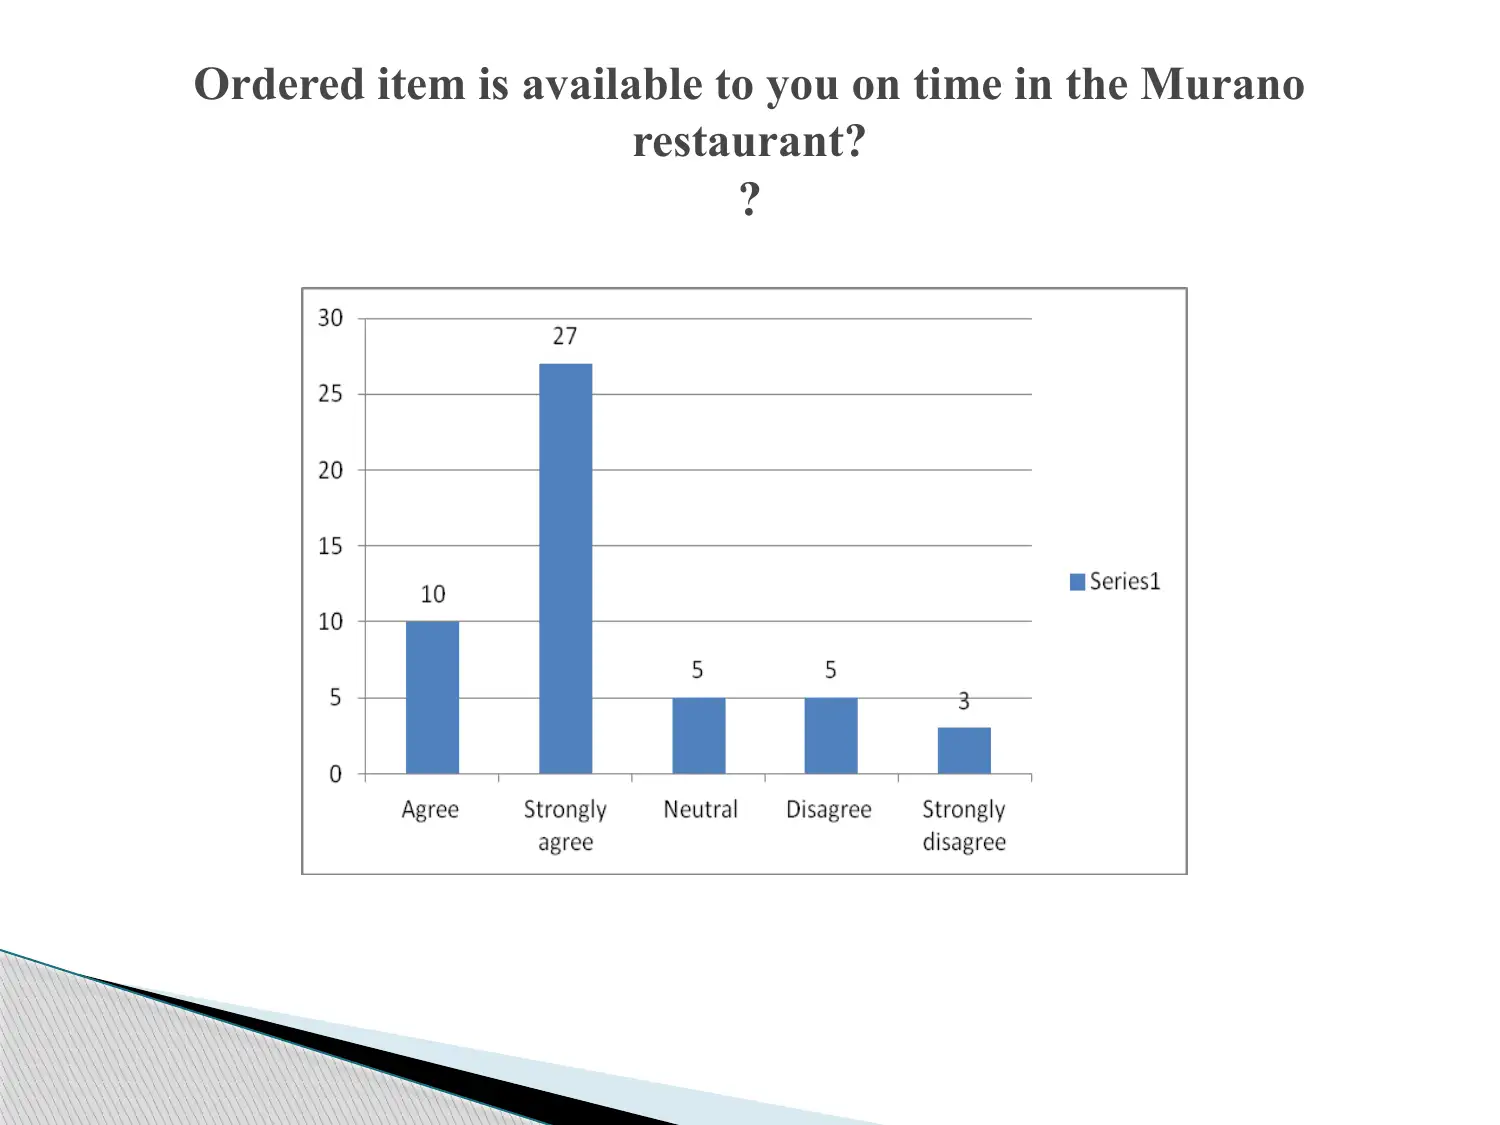
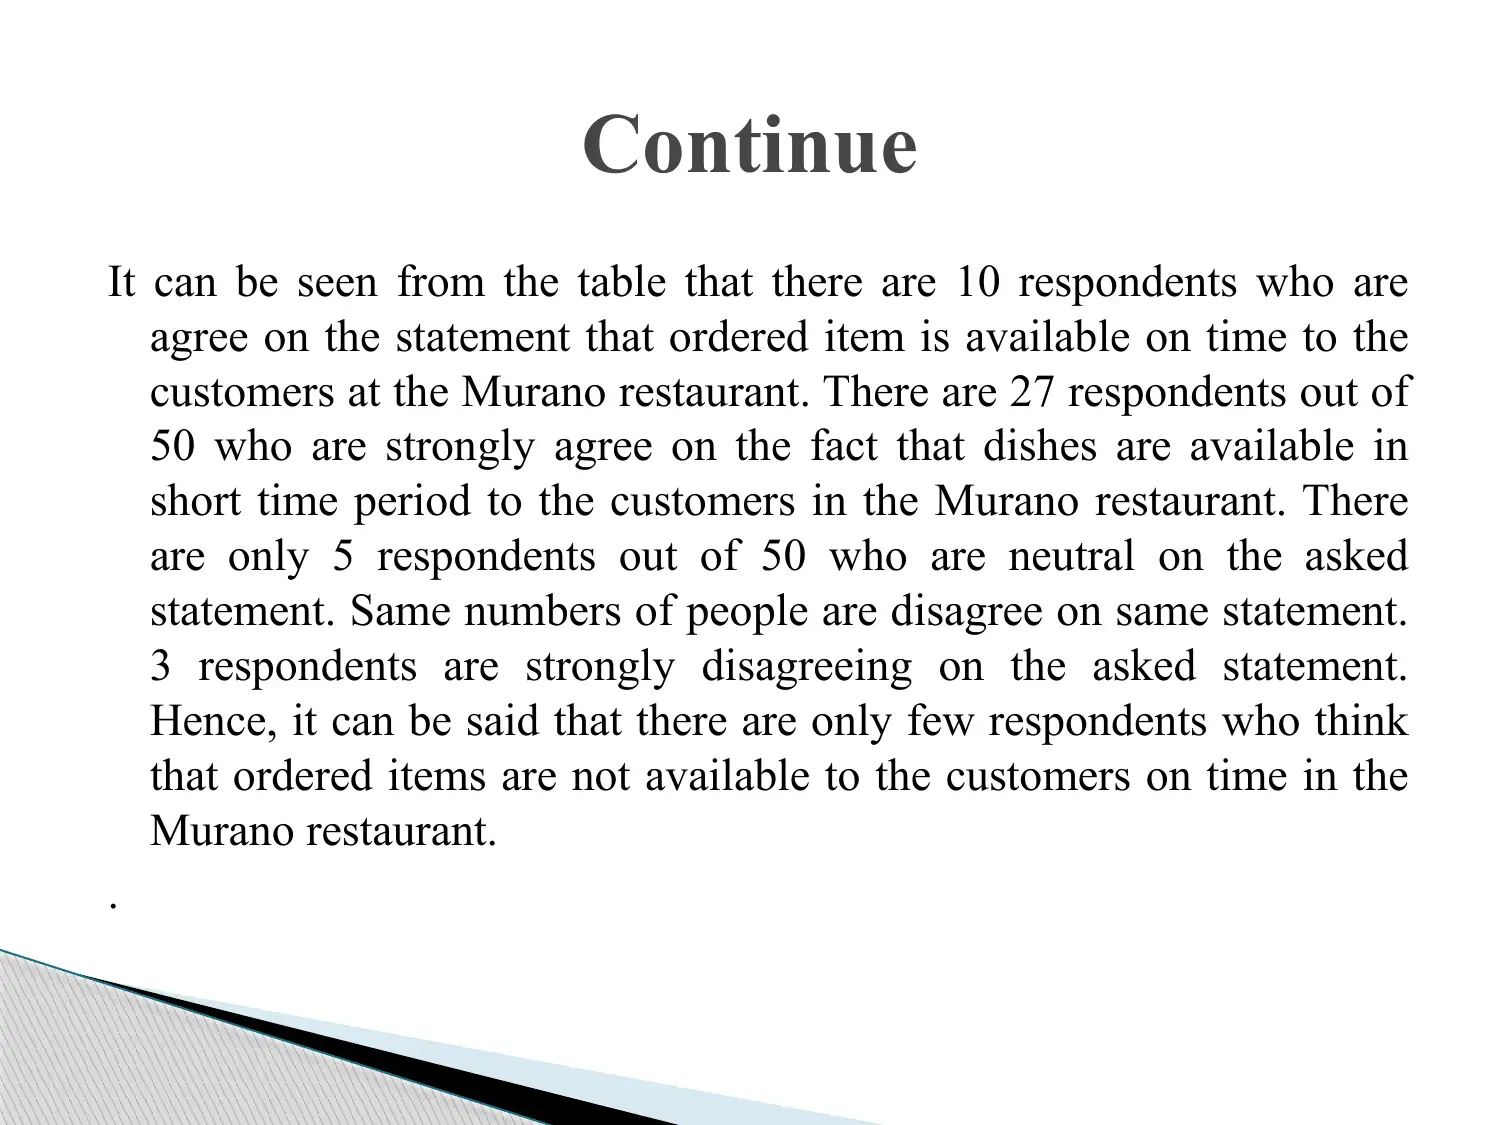
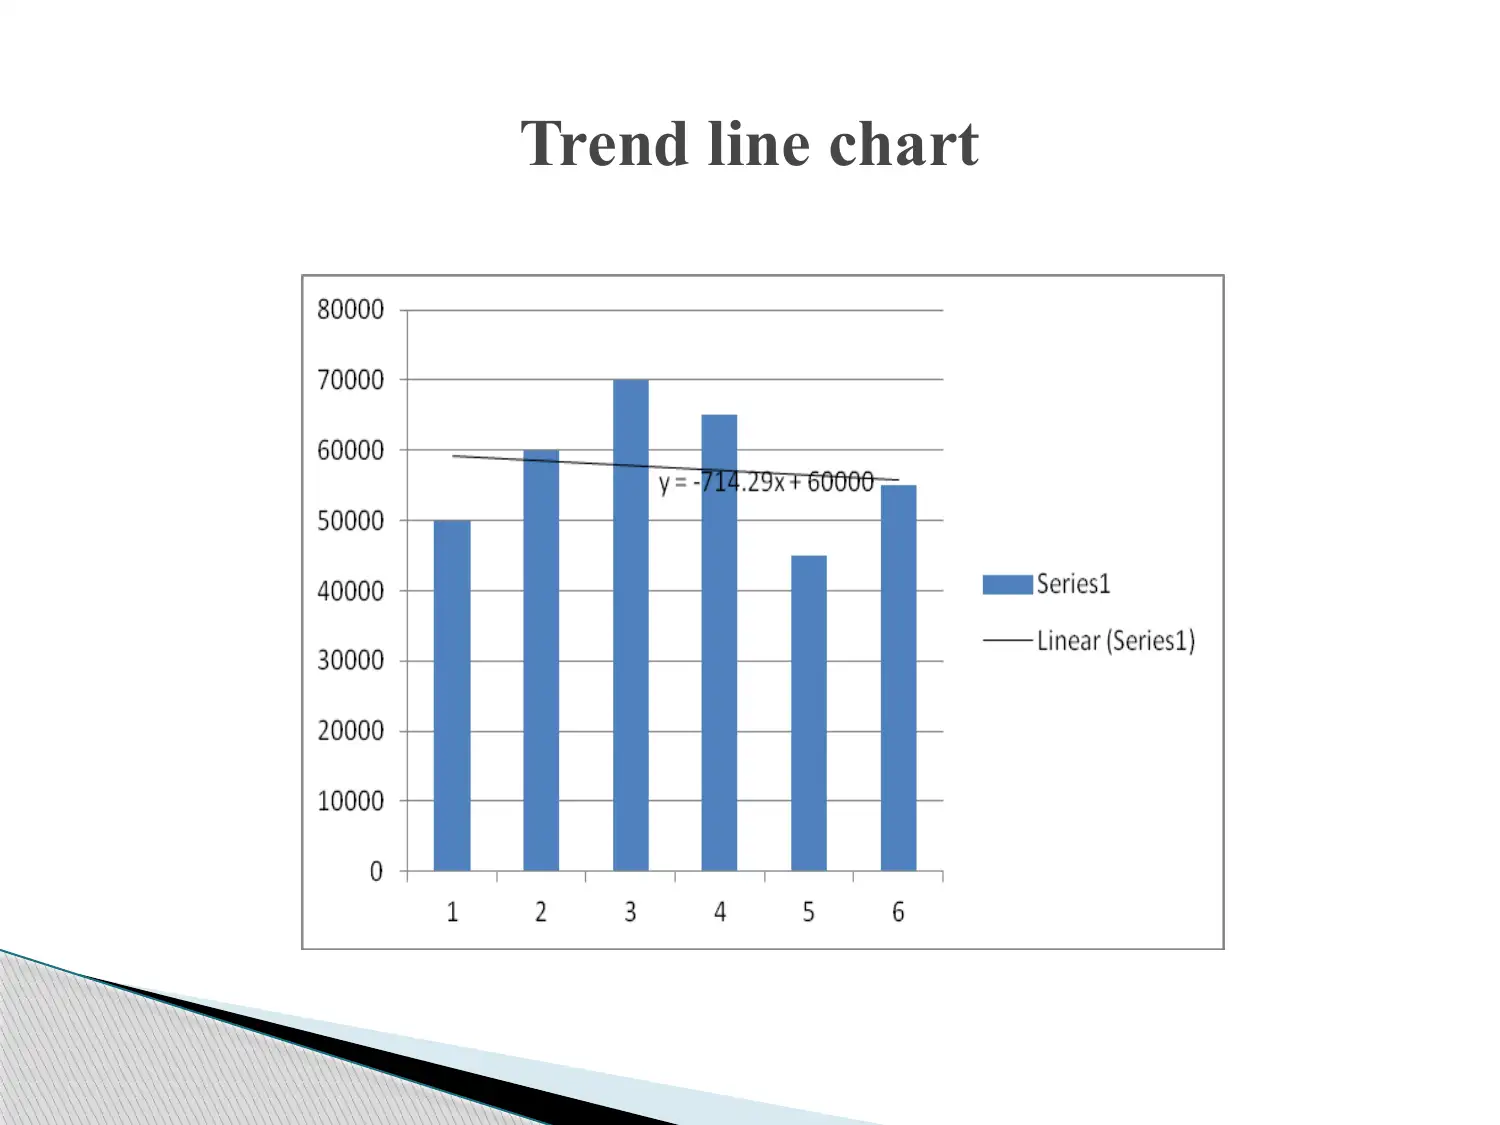
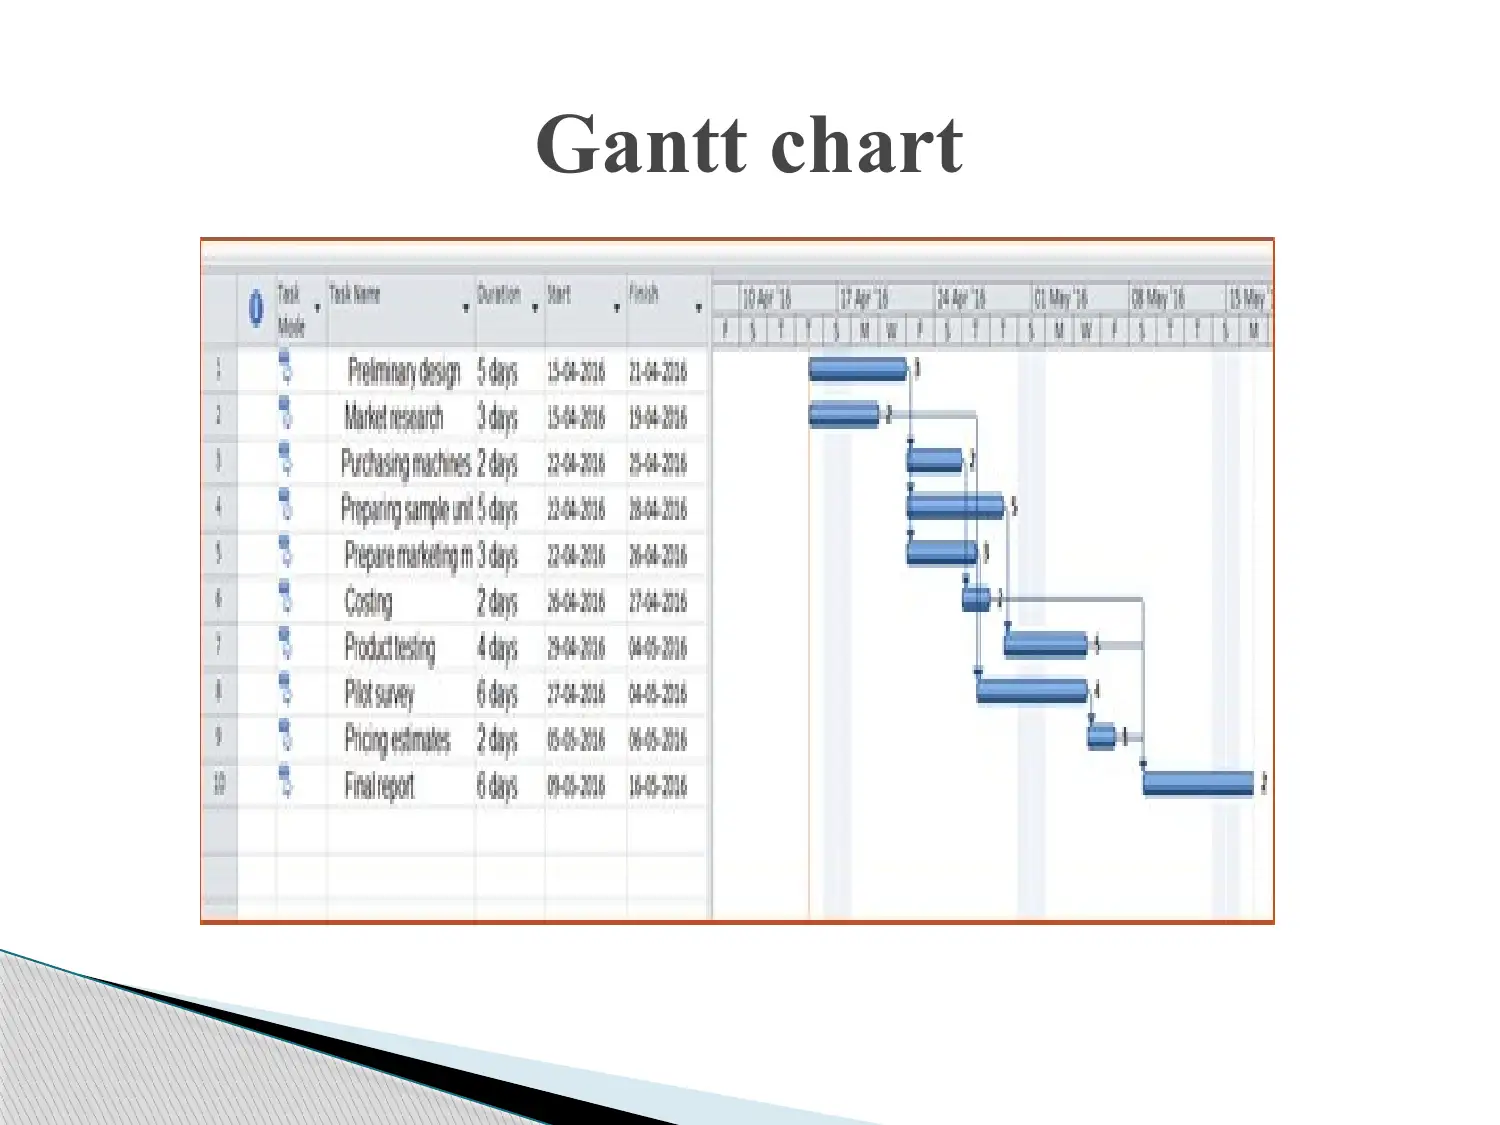
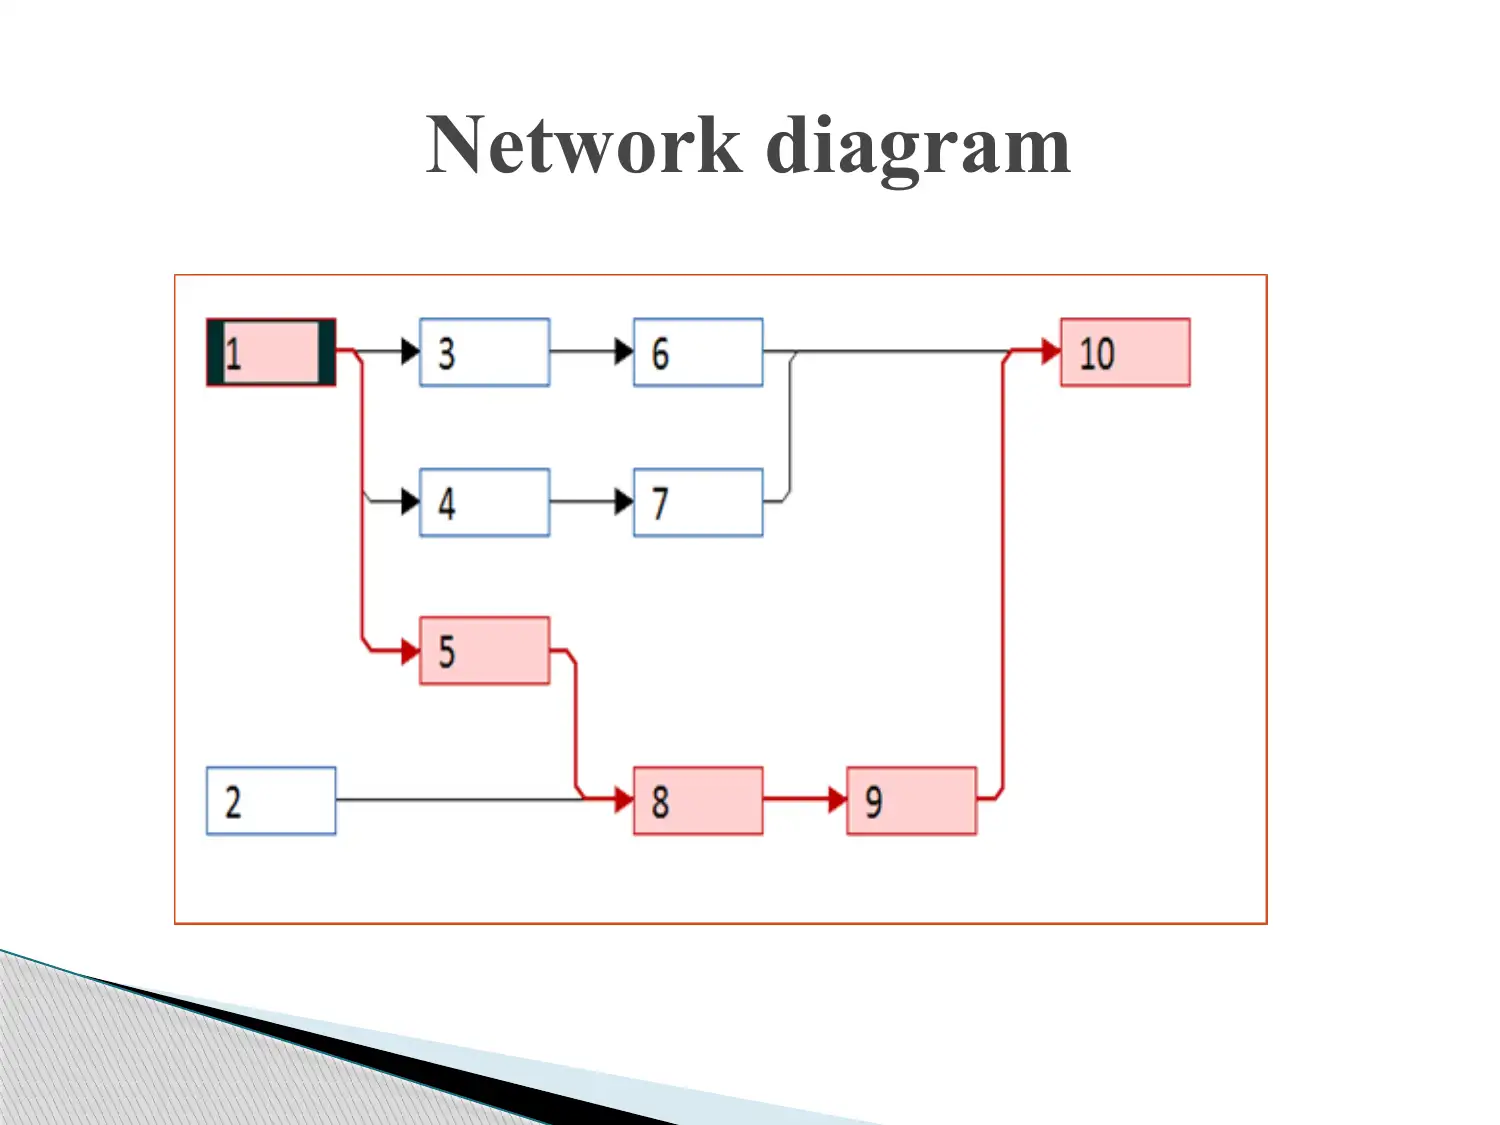
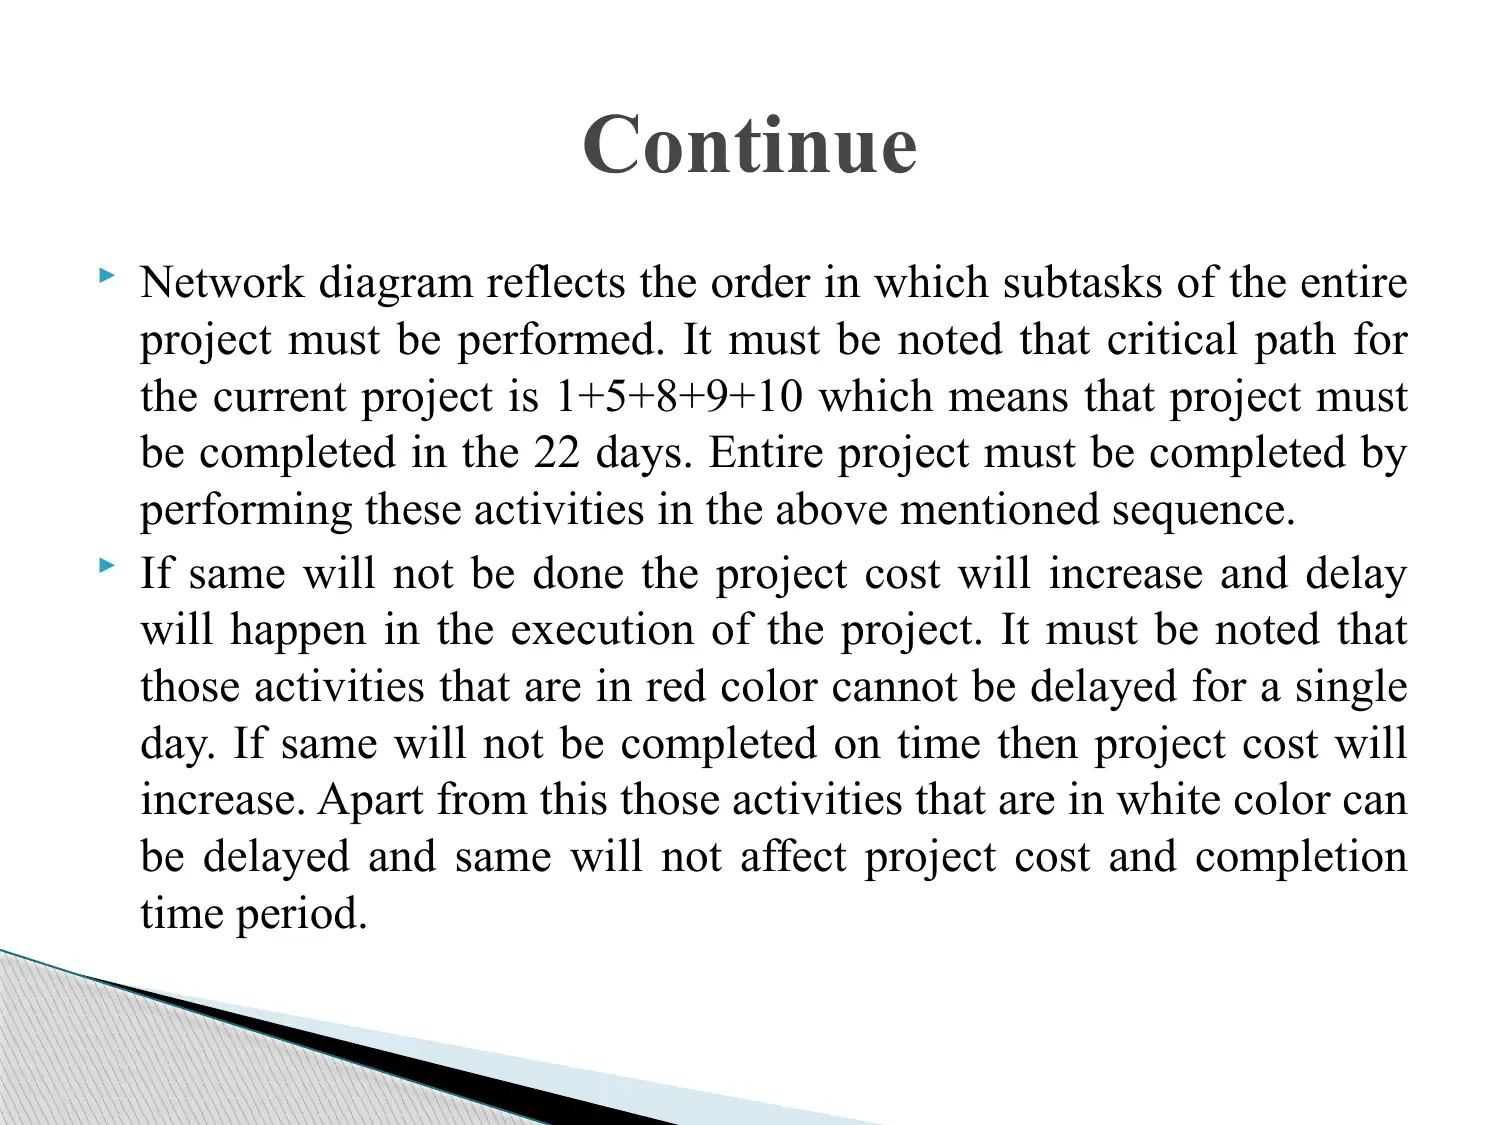
This report presents a business analysis of a restaurant, focusing on various aspects of its performance. The analysis begins with an examination of customer preferences, specifically regarding the frequency of visits for lunch and dinner, revealing that the majority of customers visit the restaurant only once a month. The report then assesses customer satisfaction, highlighting that most respondents believe that ordered items are available on time. Furthermore, it includes a trend line chart indicating a decline in sales, suggesting a need for strategic business adjustments. A Gantt chart and a network diagram are also provided to illustrate project management and task dependencies, emphasizing the critical path for project completion. The report concludes by emphasizing the need for the restaurant to develop a suitable business strategy to improve its overall performance, supported by references to relevant research.
Document Page
BUSINESS DECISION
MAKING
tabler-icon-diamond-filled.svg

Paraphrase This Document

Need a fresh take? Get an instant paraphrase of this document with our AI Paraphraser
Document Page
In order to take lunch or dinner in a month how many times
you come in the Murano restaurant.
Document Page
Research results show that in terms of taking lunch and
dinner people preference is different from each other. It
can be seen from the table that there are 30 respondents
out of 50 who visit restaurant single time in a month.
There are 10 respondents out of 50 people who state
that they visit Murano restaurant 2 times in a month.
There are only 5 respondents who think that they visit
Murano restaurant three times in a month. There are
only 5 respondents who visit Murano restaurant more
than three times in a month.
Continue
Document Page
Ordered item is available to you on time in the Murano
restaurant?
?
tabler-icon-diamond-filled.svg

Paraphrase This Document

Need a fresh take? Get an instant paraphrase of this document with our AI Paraphraser
Document Page
It can be seen from the table that there are 10 respondents who are
agree on the statement that ordered item is available on time to the
customers at the Murano restaurant. There are 27 respondents out of
50 who are strongly agree on the fact that dishes are available in
short time period to the customers in the Murano restaurant. There
are only 5 respondents out of 50 who are neutral on the asked
statement. Same numbers of people are disagree on same statement.
3 respondents are strongly disagreeing on the asked statement.
Hence, it can be said that there are only few respondents who think
that ordered items are not available to the customers on time in the
Murano restaurant.
.
Continue
Document Page
Trend line chart
Document Page
It can be seen from the chart that trend line of sales is
declining and this means that in upcoming time period
also sales of the firm will decline. This is predicted
because in past time period sales were declined.
However, there is a possibility that sales in the
upcoming time period will remain slightly above the
current sales value. Hence, it is clear that in future good
improvements will not be observed in sales of the
restaurant. Firm needs to prepare suitable business
strategy in order to improve its business performance.
Continue
tabler-icon-diamond-filled.svg

Paraphrase This Document

Need a fresh take? Get an instant paraphrase of this document with our AI Paraphraser
Document Page
Gantt chart
Document Page
Network diagram
Document Page
Network diagram reflects the order in which subtasks of the entire
project must be performed. It must be noted that critical path for
the current project is 1+5+8+9+10 which means that project must
be completed in the 22 days. Entire project must be completed by
performing these activities in the above mentioned sequence.
If same will not be done the project cost will increase and delay
will happen in the execution of the project. It must be noted that
those activities that are in red color cannot be delayed for a single
day. If same will not be completed on time then project cost will
increase. Apart from this those activities that are in white color can
be delayed and same will not affect project cost and completion
time period.
Continue
tabler-icon-diamond-filled.svg

Paraphrase This Document

Need a fresh take? Get an instant paraphrase of this document with our AI Paraphraser
Document Page
Jung, K.W. and et.al., 2014. Cancer statistics in Korea:
incidence, mortality, survival, and prevalence in 2011.
Cancer Research and Treatment. 46(2). pp.109-123.
Korolyuk, V.S. and Borovskich, Y.V., 2013. Theory of
U-statistics. Springer Science & Business Media.
Ladicky, L. and et.al., 2010, September. Graph cut
based inference with co-occurrence statistics. In
European Conference on Computer Vision. Springer
Berlin Heidelberg.sni
REFERENCES
chevron_up_icon
1 out of 11
circle_padding
hide_on_mobile
zoom_out_icon
[object Object]