BUS501: Business Analysis and Statistics Report on Sales Data
VerifiedAdded on 2020/03/16
|17
|2563
|70
Report
AI Summary
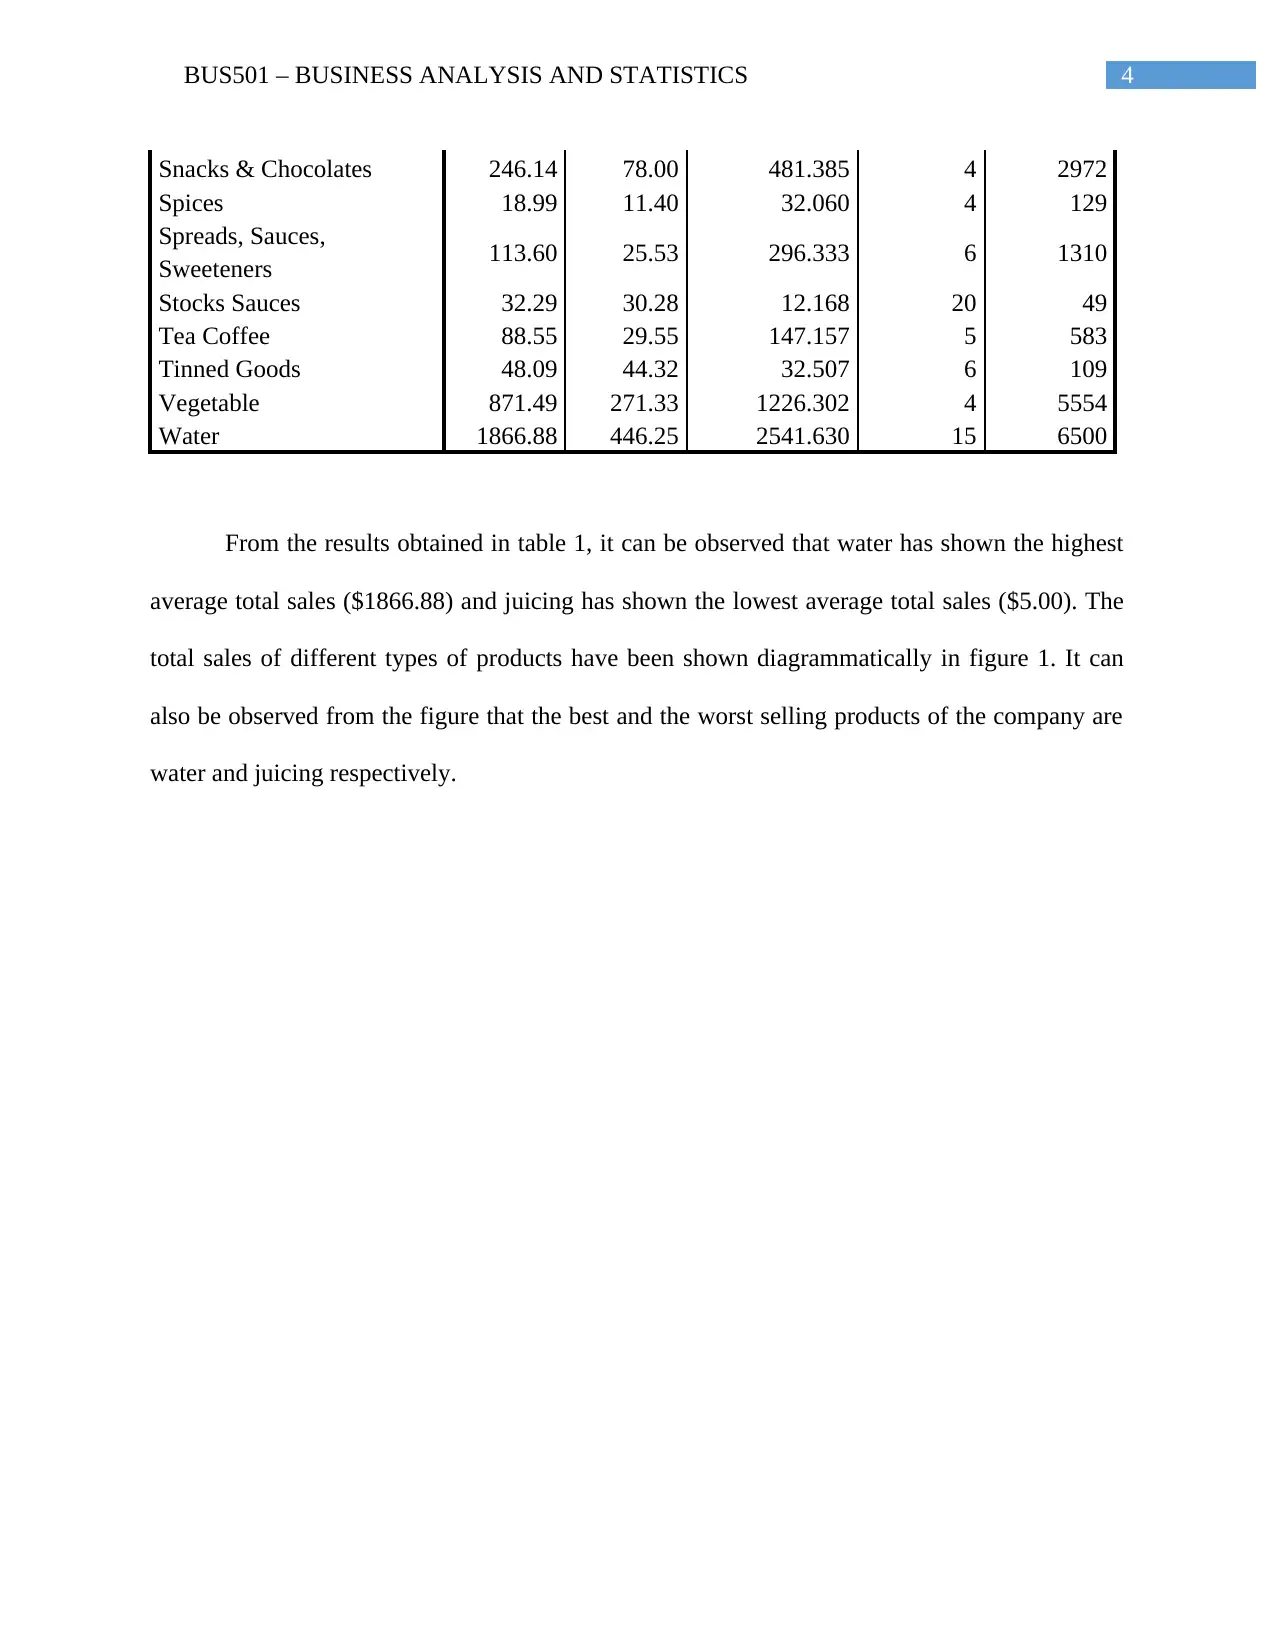
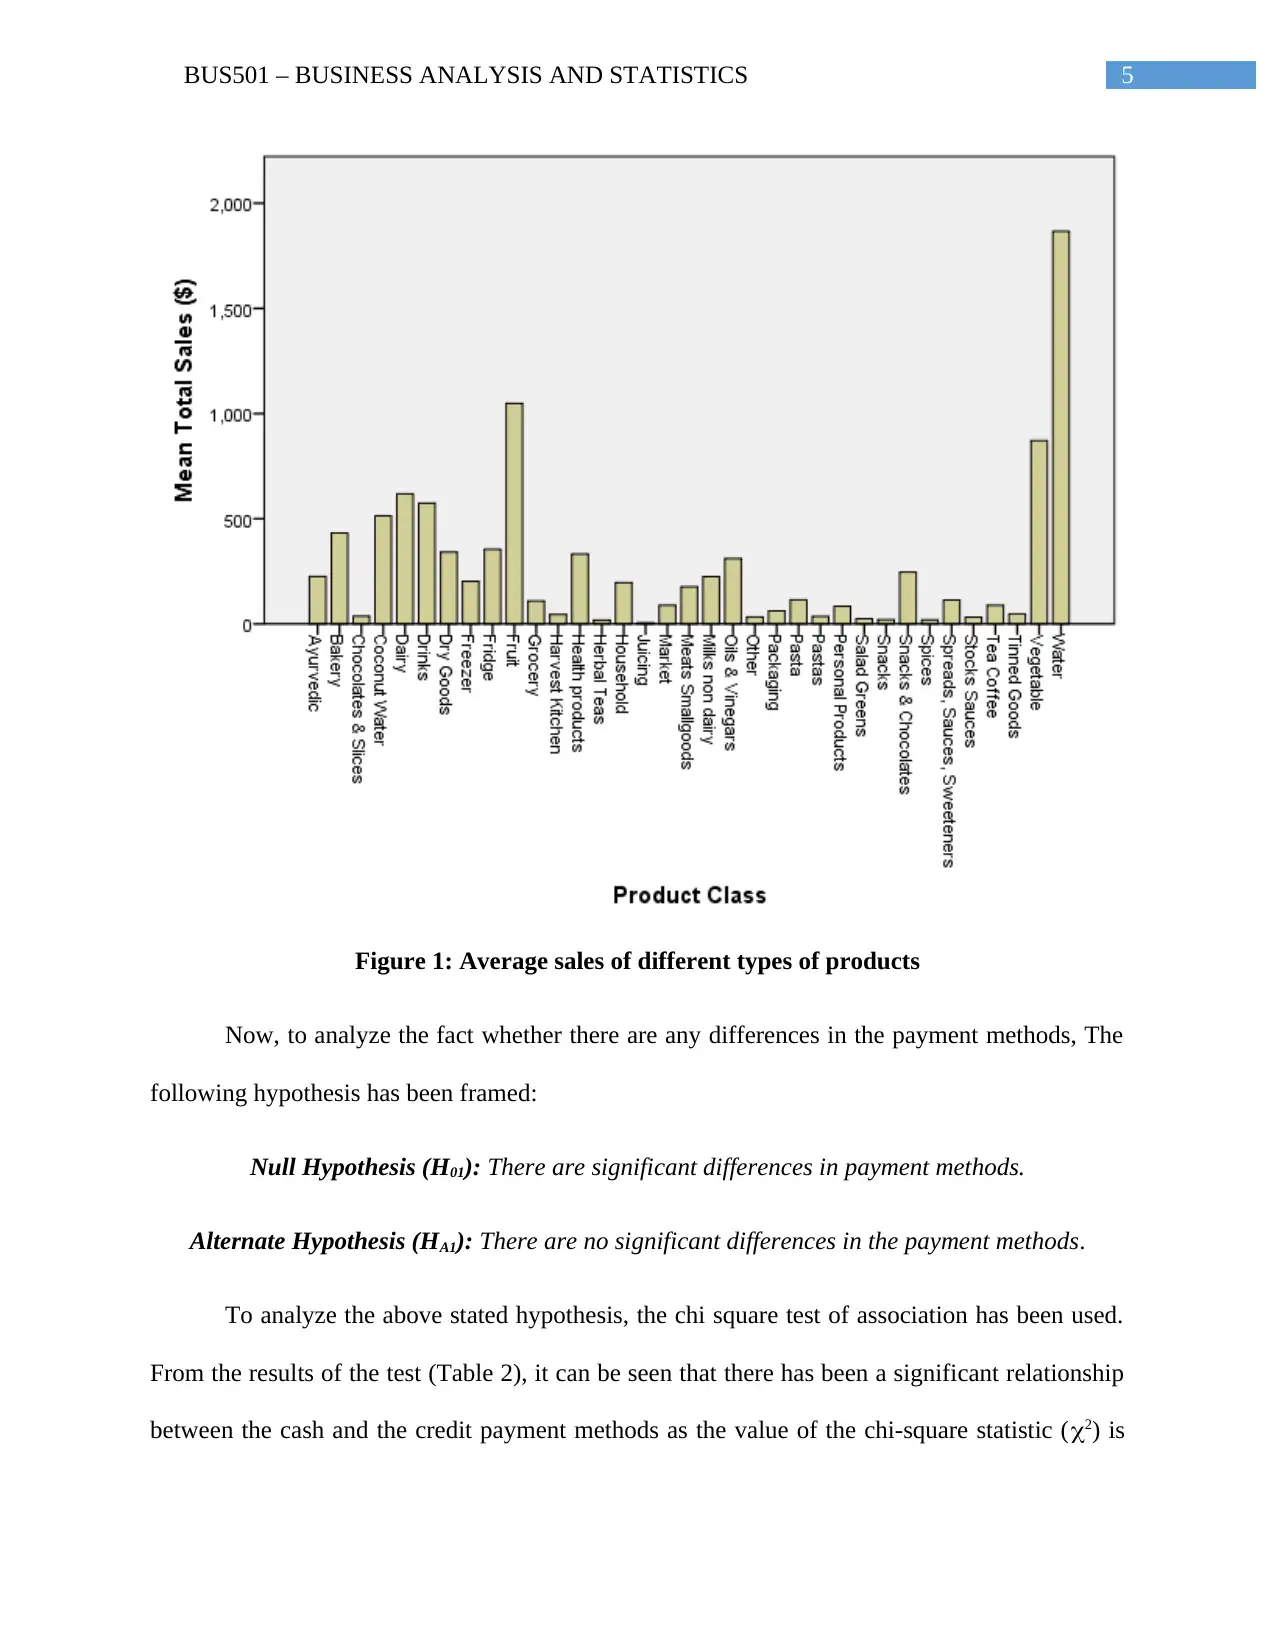
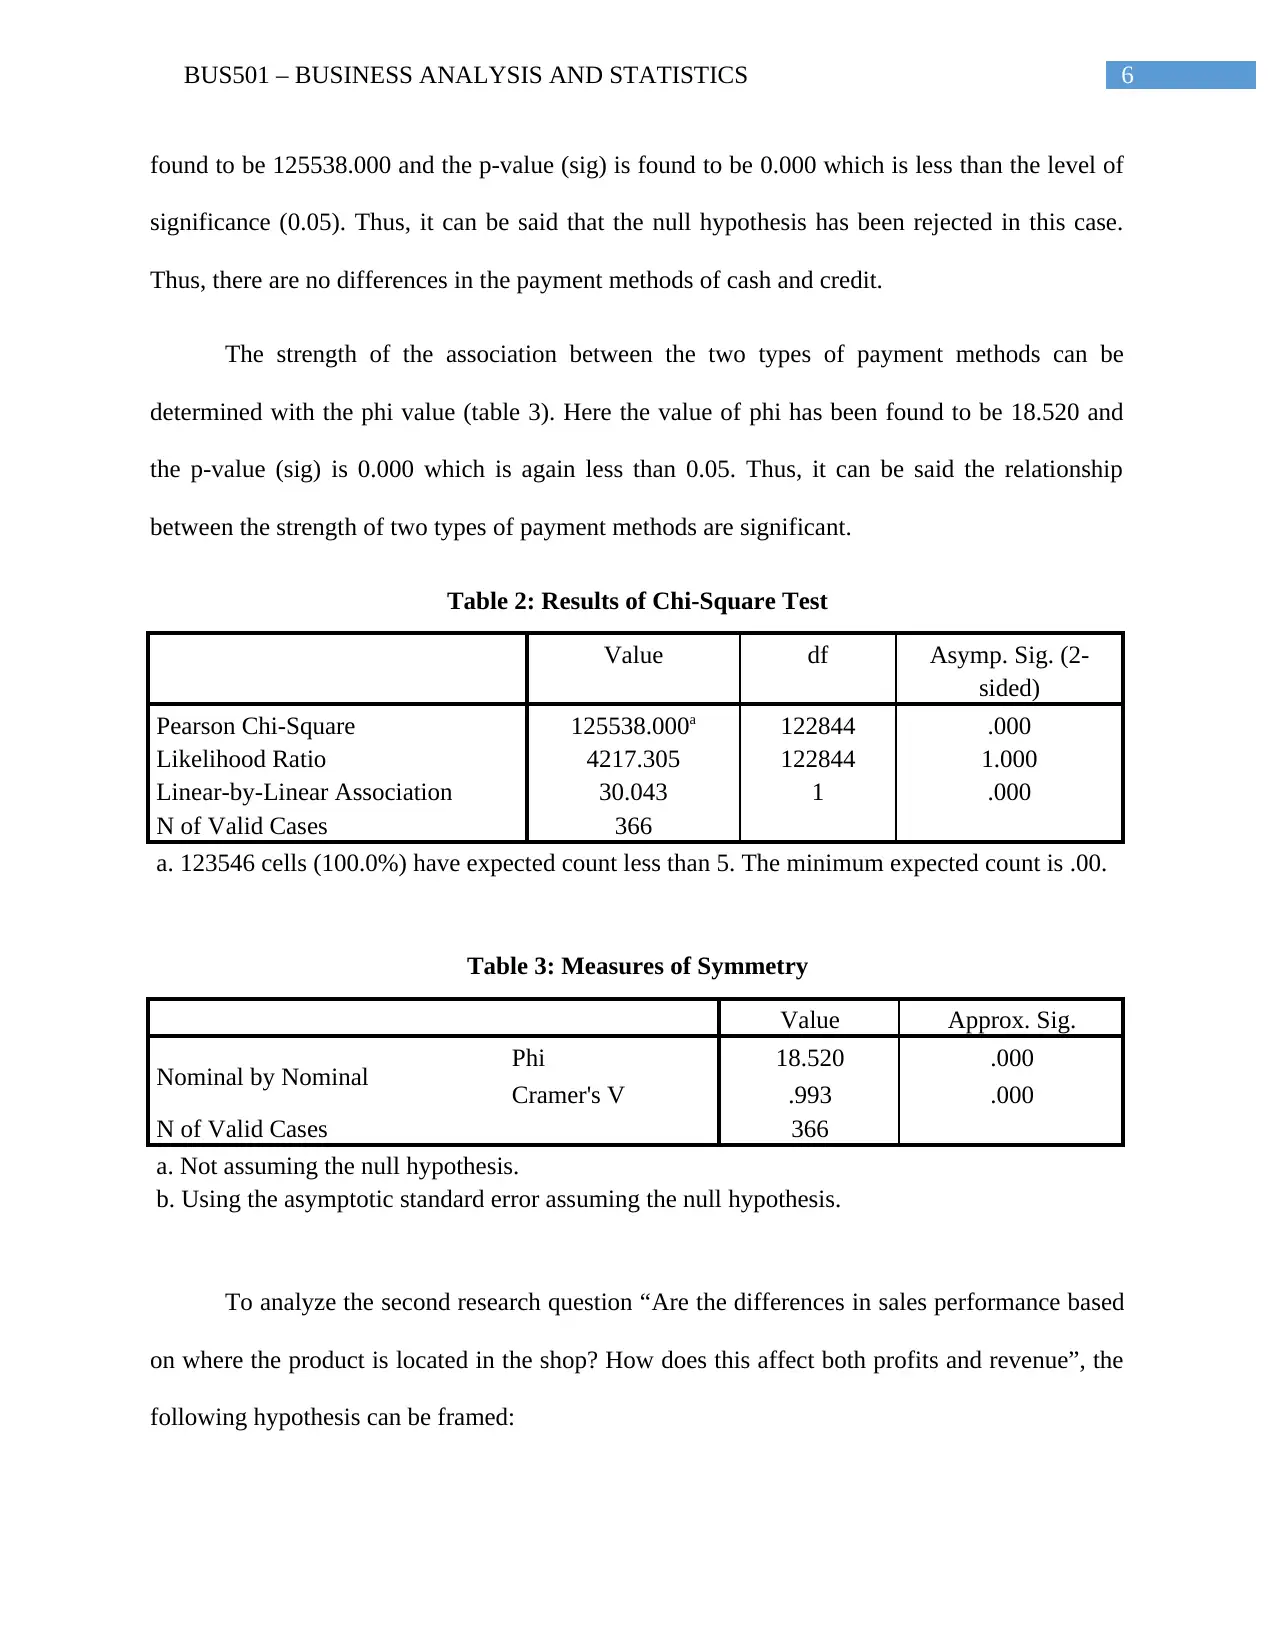
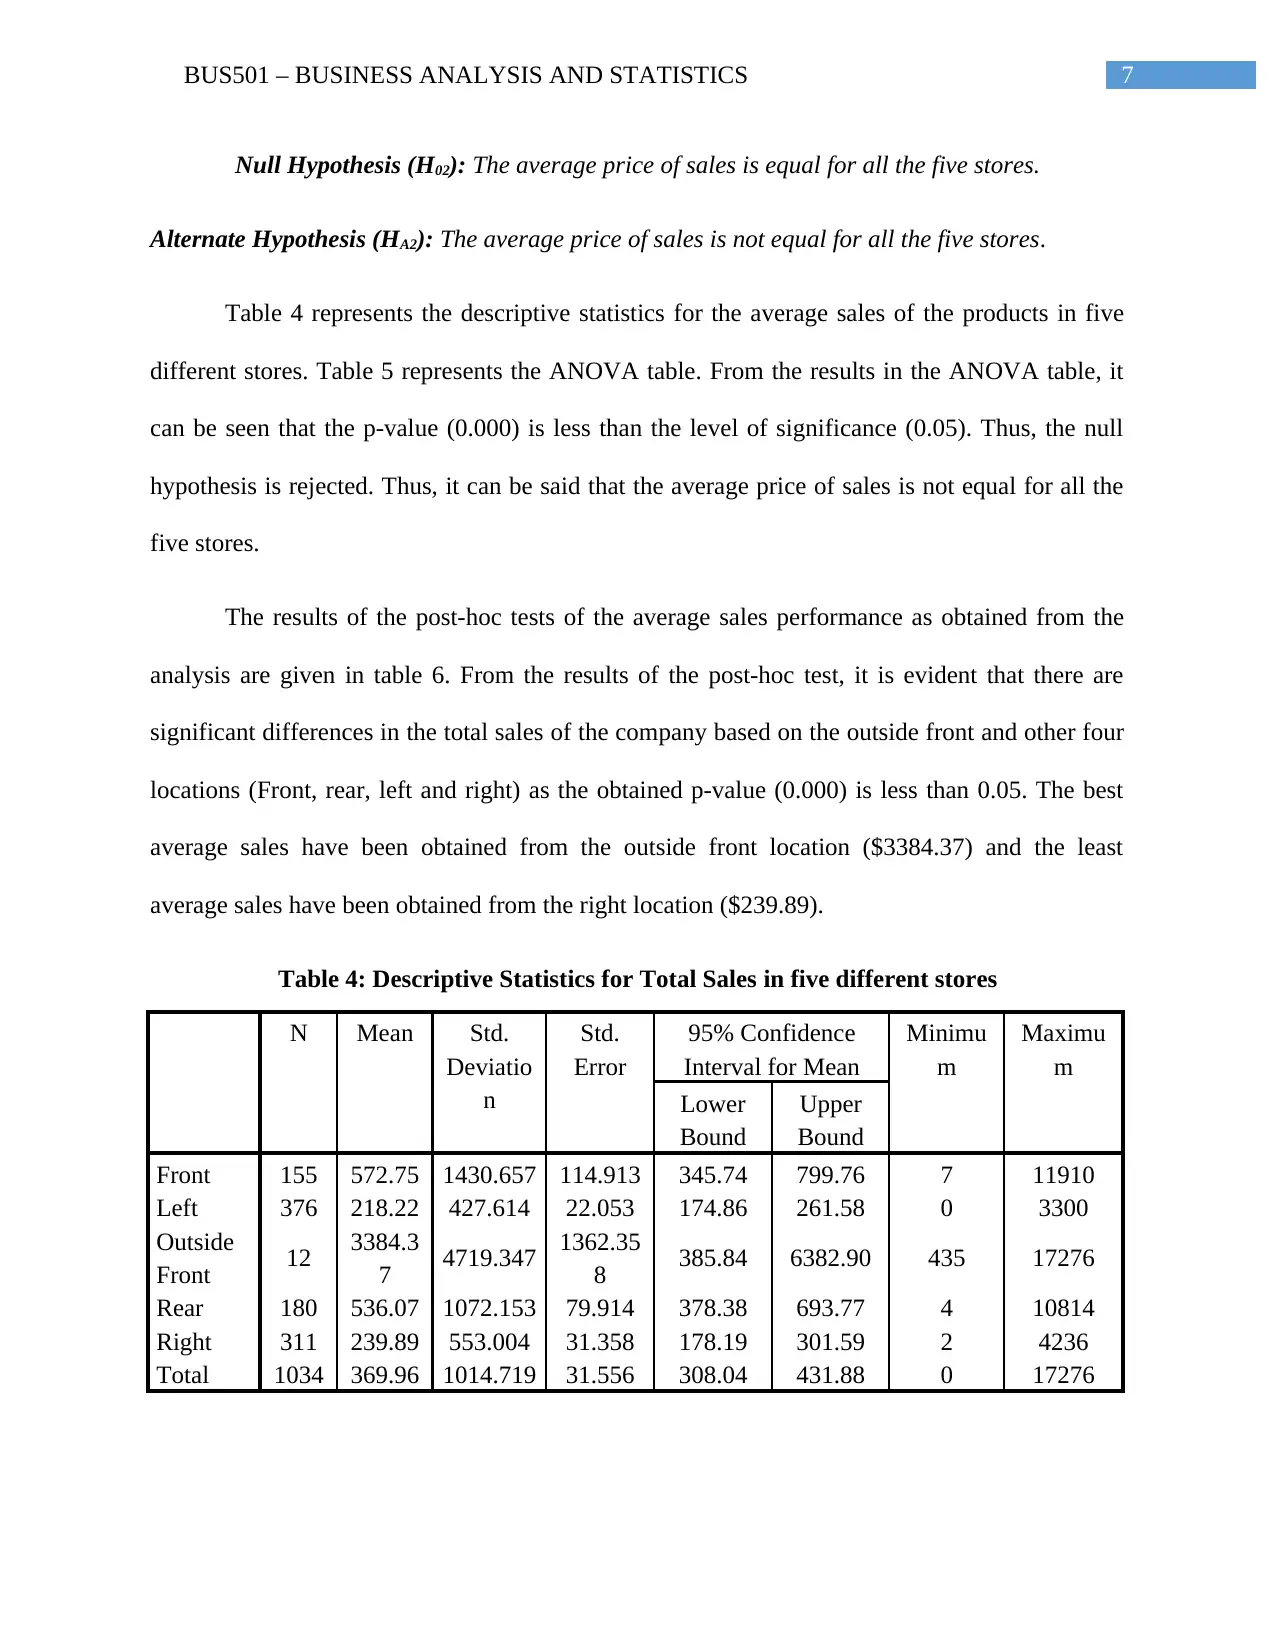
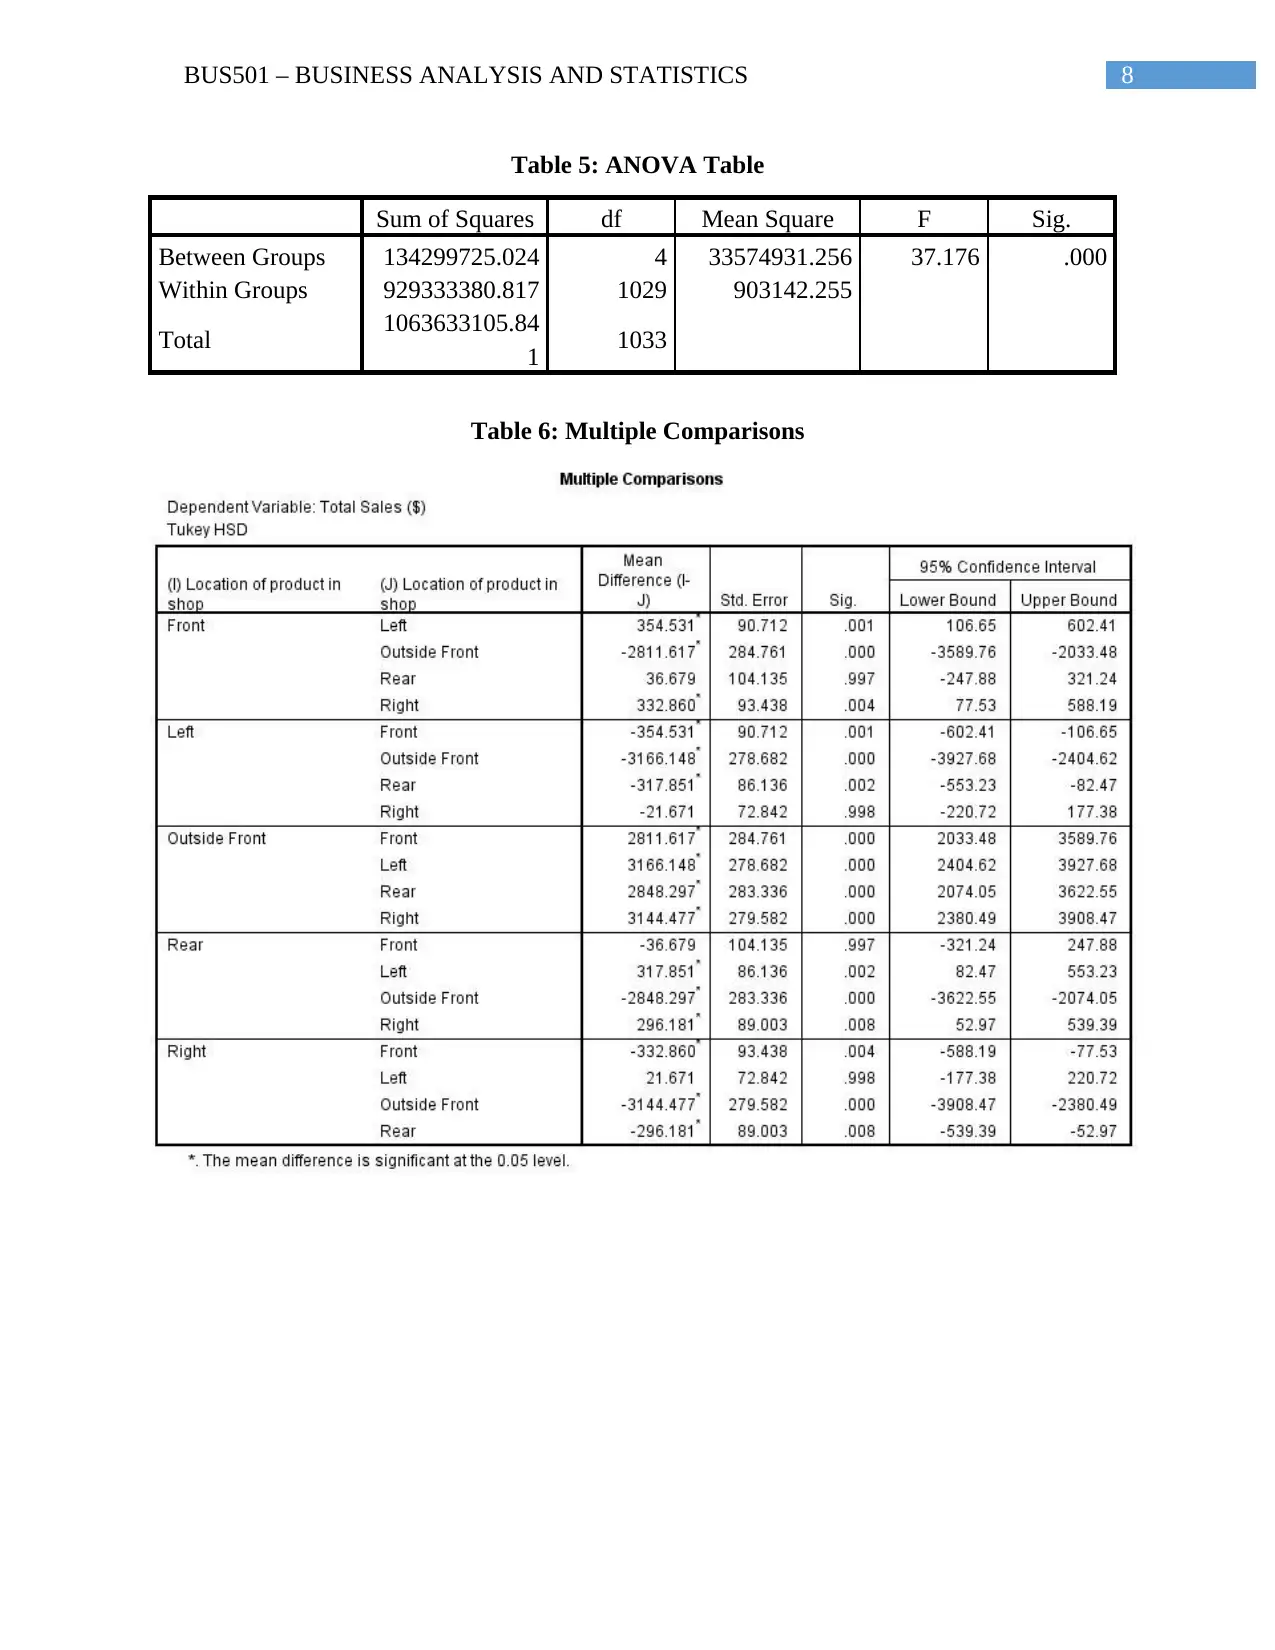
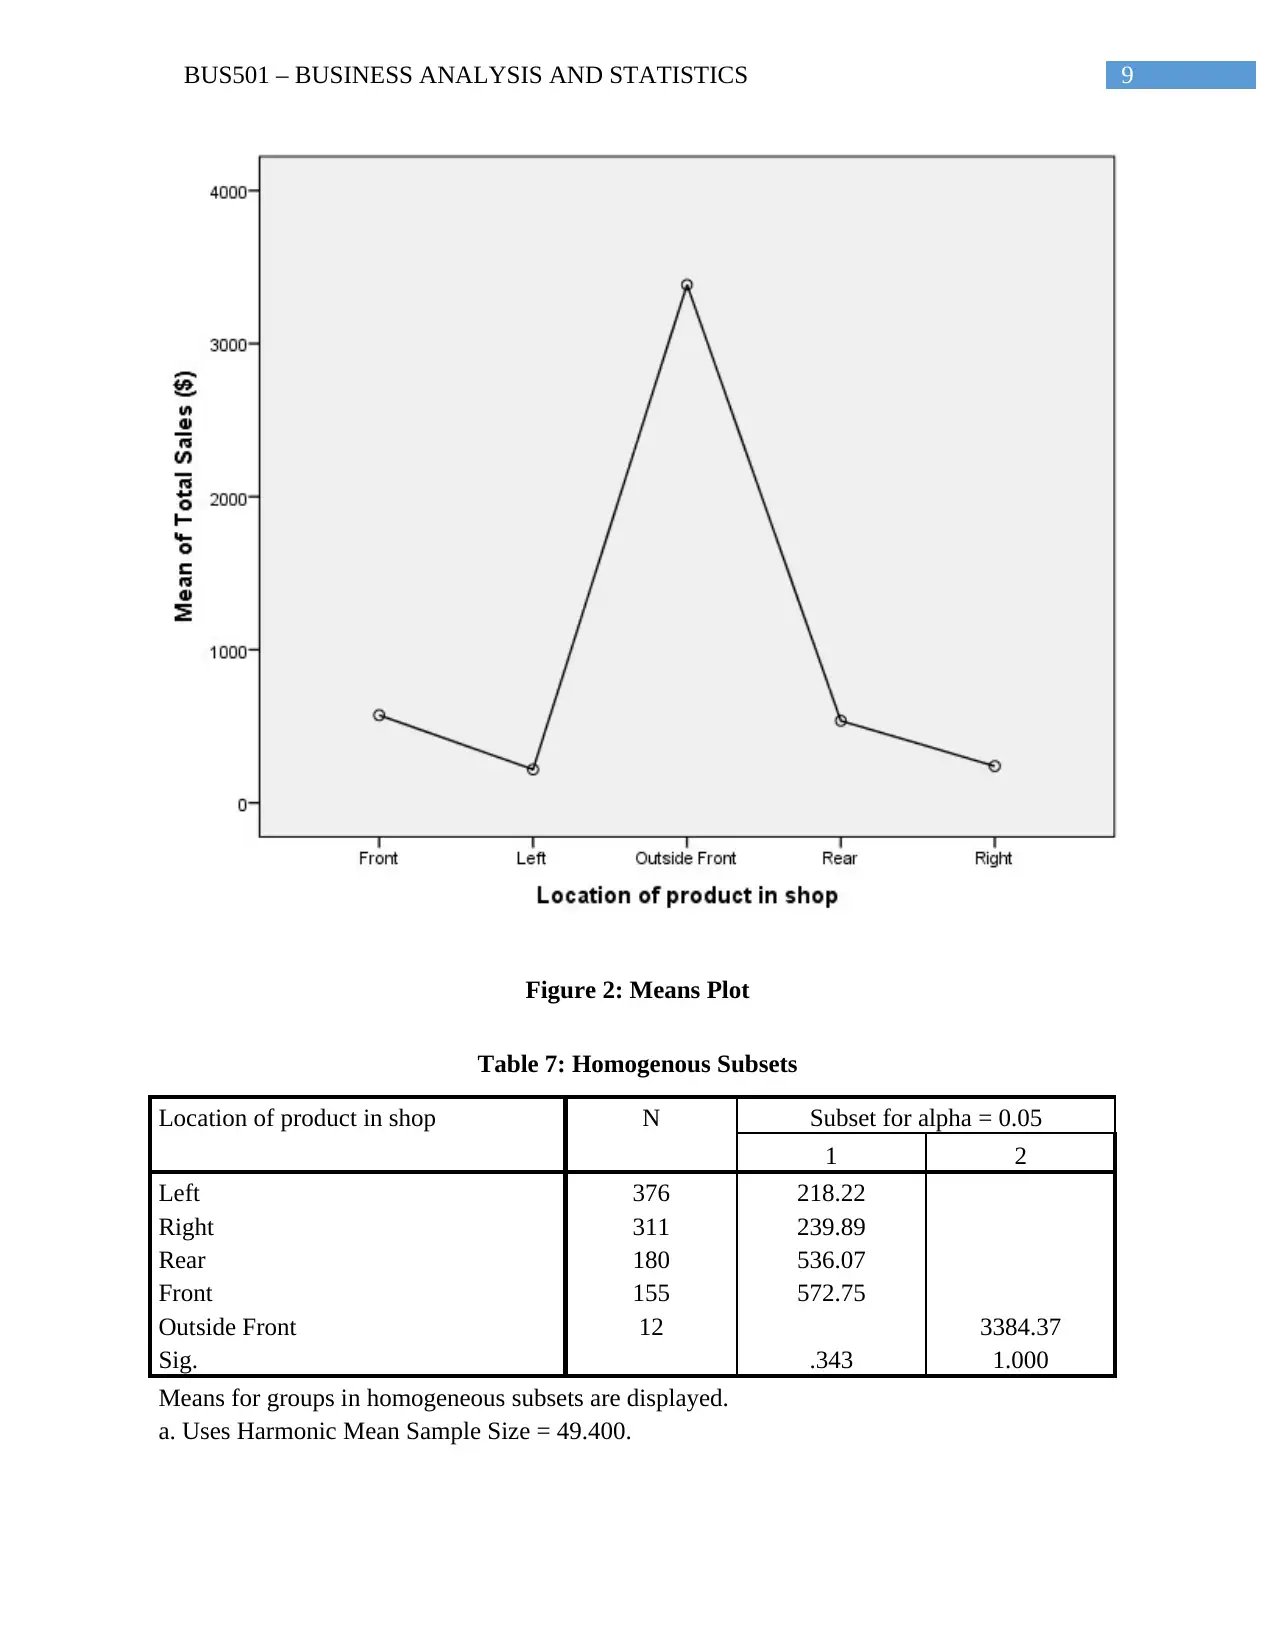
This report presents a business analysis of Good Harvest Organic Farm, focusing on its retail market performance. The analysis utilizes descriptive and predictive statistical methods to address key research questions, including identifying top and worst-selling products, assessing the impact of product location on sales and revenue, and determining sales and profit variations across different months and seasons. The study employs techniques like descriptive statistics, chi-square tests, ANOVA, and regression analysis to derive meaningful insights from the provided sales data. Key findings reveal the best and worst-performing products, significant differences in sales based on product location within the store, and a notable difference in sales and gross profits across different months. However, no significant difference was found in sales performance between seasons. The report concludes with recommendations for the company to improve its average sales, average revenue, and address concerns related to high COGS.

Running Head: BUS501 – BUSINESS ANALYSIS AND STATISTICS
BUS501 – Business Analysis and Statistics
Name of the Student
Name of the University
Author Note
BUS501 – Business Analysis and Statistics
Name of the Student
Name of the University
Author Note
Paraphrase This Document
Need a fresh take? Get an instant paraphrase of this document with our AI Paraphraser

1BUS501 – BUSINESS ANALYSIS AND STATISTICS
Table of Contents
1.0 Introduction................................................................................................................................2
2.0 Definition of the problem and requirement of business intelligence.........................................2
3.0 Results of the selected analytics methods and technical analysis..............................................3
4.0 Conclusions and Recommendations........................................................................................14
References......................................................................................................................................16

2BUS501 – BUSINESS ANALYSIS AND STATISTICS
1.0 Introduction
A huge range of products are produced by the company Good Harvest Organic Farm and
Market. Most of the products produced by the company are organic (Good Harvest Organics,
2017). The main aim of this organization is to produce good quality of organic foods and deliver
them to its customers. The company also provides its customers with a facility of home delivery.
The company is also engaged in providing education to the people about their seasonal products
and its nutritional values.
The business of this company is now running for only two years. The company is
interested to analyze its retail market business. The company wants to improve its average sales,
average revenue and also wants to investigate on the high COGS. Though the company considers
the fact that the organic products do come at a price higher than the price of the usual products,
improving the average sales of the company is a matter of concern.
2.0 Definition of the problem and requirement of business intelligence
The company, Good Harvest has collected some data from one of its outlets and that has
been provided to run this analysis. The data has been collected from a health Food Shop in the
Sunshine Coast. Descriptive analysis and predictive analysis will be used to run the analysis of
the data provided. The analysis will be conducted keeping in mind the following research
questions:
What are the top and the worst selling products in terms of sales?
Are the differences in sales performance based on where the product is located in the
shop? How does this effect both profits and revenue?
⊘ This is a preview!⊘
Do you want full access?
Subscribe today to unlock all pages.

Trusted by 1+ million students worldwide

3BUS501 – BUSINESS ANALYSIS AND STATISTICS
Is there a difference in sales and gross profits between different months of the year?
Are their differences in sales performance between different seasons?
3.0 Results of the selected analytics methods and technical analysis
The descriptive statistics required to answer the first research question “What are the top
and the worst selling products in terms of sales” re given below in table 1.
Table 1: Necessary descriptive statistic measures for Total Sales
Product Class Mean Median Std. Deviation Minimum Maximum
Ayurvedic 226.25 164.75 252.677 10 504
Bakery 432.67 66.43 884.016 7 3793
Chocolates & Slices 37.01 31.00 16.029 19 61
Coconut Water 514.23 380.55 562.668 21 1794
Dairy 619.05 259.43 1473.793 10 10814
Drinks 574.25 136.77 1729.244 5 11910
Dry Goods 341.26 121.99 604.439 2 3300
Freezer 202.45 91.63 421.301 5 3252
Fridge 354.21 211.95 389.326 9 1535
Fruit 1048.68 356.47 2469.413 3 17276
Grocery 108.74 72.73 108.260 5 597
Harvest Kitchen 44.97 38.15 24.197 24 80
Health products 332.78 79.90 757.809 15 2914
Herbal Teas 17.96 8.13 24.373 2 54
Household 196.23 46.50 255.520 7 987
Juicing 5.00 5.00 5 5
Market 88.75 88.75 97.227 20 158
Meats Smallgoods 176.72 97.98 259.025 5 1423
Milks non dairy 224.55 120.75 297.149 12 968
Oils & Vinegars 310.81 97.30 421.687 9 1815
Other 33.53 33.90 25.949 0 88
Packaging 62.27 28.41 105.620 2 320
Pasta 114.22 59.50 138.521 8 488
Pastas 35.80 35.80 36 36
Personal Products 84.38 46.71 114.318 2 676
Salad Greens 24.50 24.50 25 25
Snacks 20.33 20.33 .742 20 21
Paraphrase This Document
Need a fresh take? Get an instant paraphrase of this document with our AI Paraphraser

4BUS501 – BUSINESS ANALYSIS AND STATISTICS
Snacks & Chocolates 246.14 78.00 481.385 4 2972
Spices 18.99 11.40 32.060 4 129
Spreads, Sauces,
Sweeteners 113.60 25.53 296.333 6 1310
Stocks Sauces 32.29 30.28 12.168 20 49
Tea Coffee 88.55 29.55 147.157 5 583
Tinned Goods 48.09 44.32 32.507 6 109
Vegetable 871.49 271.33 1226.302 4 5554
Water 1866.88 446.25 2541.630 15 6500
From the results obtained in table 1, it can be observed that water has shown the highest
average total sales ($1866.88) and juicing has shown the lowest average total sales ($5.00). The
total sales of different types of products have been shown diagrammatically in figure 1. It can
also be observed from the figure that the best and the worst selling products of the company are
water and juicing respectively.

5BUS501 – BUSINESS ANALYSIS AND STATISTICS
Figure 1: Average sales of different types of products
Now, to analyze the fact whether there are any differences in the payment methods, The
following hypothesis has been framed:
Null Hypothesis (H01): There are significant differences in payment methods.
Alternate Hypothesis (HA1): There are no significant differences in the payment methods.
To analyze the above stated hypothesis, the chi square test of association has been used.
From the results of the test (Table 2), it can be seen that there has been a significant relationship
between the cash and the credit payment methods as the value of the chi-square statistic (2) is
⊘ This is a preview!⊘
Do you want full access?
Subscribe today to unlock all pages.

Trusted by 1+ million students worldwide

6BUS501 – BUSINESS ANALYSIS AND STATISTICS
found to be 125538.000 and the p-value (sig) is found to be 0.000 which is less than the level of
significance (0.05). Thus, it can be said that the null hypothesis has been rejected in this case.
Thus, there are no differences in the payment methods of cash and credit.
The strength of the association between the two types of payment methods can be
determined with the phi value (table 3). Here the value of phi has been found to be 18.520 and
the p-value (sig) is 0.000 which is again less than 0.05. Thus, it can be said the relationship
between the strength of two types of payment methods are significant.
Table 2: Results of Chi-Square Test
Value df Asymp. Sig. (2-
sided)
Pearson Chi-Square 125538.000a 122844 .000
Likelihood Ratio 4217.305 122844 1.000
Linear-by-Linear Association 30.043 1 .000
N of Valid Cases 366
a. 123546 cells (100.0%) have expected count less than 5. The minimum expected count is .00.
Table 3: Measures of Symmetry
Value Approx. Sig.
Nominal by Nominal Phi 18.520 .000
Cramer's V .993 .000
N of Valid Cases 366
a. Not assuming the null hypothesis.
b. Using the asymptotic standard error assuming the null hypothesis.
To analyze the second research question “Are the differences in sales performance based
on where the product is located in the shop? How does this affect both profits and revenue”, the
following hypothesis can be framed:
Paraphrase This Document
Need a fresh take? Get an instant paraphrase of this document with our AI Paraphraser

7BUS501 – BUSINESS ANALYSIS AND STATISTICS
Null Hypothesis (H02): The average price of sales is equal for all the five stores.
Alternate Hypothesis (HA2): The average price of sales is not equal for all the five stores.
Table 4 represents the descriptive statistics for the average sales of the products in five
different stores. Table 5 represents the ANOVA table. From the results in the ANOVA table, it
can be seen that the p-value (0.000) is less than the level of significance (0.05). Thus, the null
hypothesis is rejected. Thus, it can be said that the average price of sales is not equal for all the
five stores.
The results of the post-hoc tests of the average sales performance as obtained from the
analysis are given in table 6. From the results of the post-hoc test, it is evident that there are
significant differences in the total sales of the company based on the outside front and other four
locations (Front, rear, left and right) as the obtained p-value (0.000) is less than 0.05. The best
average sales have been obtained from the outside front location ($3384.37) and the least
average sales have been obtained from the right location ($239.89).
Table 4: Descriptive Statistics for Total Sales in five different stores
N Mean Std.
Deviatio
n
Std.
Error
95% Confidence
Interval for Mean
Minimu
m
Maximu
m
Lower
Bound
Upper
Bound
Front 155 572.75 1430.657 114.913 345.74 799.76 7 11910
Left 376 218.22 427.614 22.053 174.86 261.58 0 3300
Outside
Front 12 3384.3
7 4719.347 1362.35
8 385.84 6382.90 435 17276
Rear 180 536.07 1072.153 79.914 378.38 693.77 4 10814
Right 311 239.89 553.004 31.358 178.19 301.59 2 4236
Total 1034 369.96 1014.719 31.556 308.04 431.88 0 17276

8BUS501 – BUSINESS ANALYSIS AND STATISTICS
Table 5: ANOVA Table
Sum of Squares df Mean Square F Sig.
Between Groups 134299725.024 4 33574931.256 37.176 .000
Within Groups 929333380.817 1029 903142.255
Total 1063633105.84
1 1033
Table 6: Multiple Comparisons
Table 5: ANOVA Table
Sum of Squares df Mean Square F Sig.
Between Groups 134299725.024 4 33574931.256 37.176 .000
Within Groups 929333380.817 1029 903142.255
Total 1063633105.84
1 1033
Table 6: Multiple Comparisons
⊘ This is a preview!⊘
Do you want full access?
Subscribe today to unlock all pages.

Trusted by 1+ million students worldwide

9BUS501 – BUSINESS ANALYSIS AND STATISTICS
Figure 2: Means Plot
Table 7: Homogenous Subsets
Location of product in shop N Subset for alpha = 0.05
1 2
Left 376 218.22
Right 311 239.89
Rear 180 536.07
Front 155 572.75
Outside Front 12 3384.37
Sig. .343 1.000
Means for groups in homogeneous subsets are displayed.
a. Uses Harmonic Mean Sample Size = 49.400.
Paraphrase This Document
Need a fresh take? Get an instant paraphrase of this document with our AI Paraphraser

10BUS501 – BUSINESS ANALYSIS AND STATISTICS
b. The group sizes are unequal. The harmonic mean of the group sizes is used. Type I error
levels are not guaranteed.
Table 8: Equality of means
Statistica df1 df2 Sig.
Welch 6.864 4 76.867 .000
Brown-Forsythe 5.365 4 14.217 .008
a. Asymptotically F distributed.
To test the third research question “Is there a difference in sales and gross profits between
different months of the year”, the following hypothesis can be framed.
Null Hypothesis (H03): There is no difference in the sales and gross profits between different
months of the year.
Alternate Hypothesis (HA3): There is a significant difference in the sales and gross profits
between different months of the year.
To analyze the hypothesis stated above, regression analysis has to be performed.
According to the regression analysis (Table 11), the month of the year can be predicted with the
help of the following regression equation:
Month of the Year = 6.079 + 0.000 * Gross Sales + 0.029 * Total Profit
It can be observed from the model summary table (Table 9) that only 5.6 percent of the
monthly variability can be explained by the independent variables gross sales and total profit.
From the ANOVA table (table 10), it can also be seen that the p-value (0.000) is less than the
level of significance (0.05). Thus, the null hypothesis in this case is also rejected. Thus, it can be
said that there is a significant difference in the sales and the gross profits between different
months of the year. Thus, the model can be useful potentially.

11BUS501 – BUSINESS ANALYSIS AND STATISTICS
Table 9: Model Summary
Model R R Square Adjusted R Square Std. Error of the
Estimate
1 .236a .056 .051 3.367
a. Predictors: (Constant), Profit Total, Gross_Sales
b. Dependent Variable: Month of the year
Table 10: ANOVA
Model Sum of Squares df Mean Square F Sig.
1
Regression 243.467 2 121.733 10.736 .000b
Residual 4115.965 363 11.339
Total 4359.432 365
a. Dependent Variable: Month of the year
b. Predictors: (Constant), Profit Total, Gross_Sales
Table 11: Regression Coefficients
Model Unstandardized Coefficients Standardized
Coefficients
t Sig.
B Std. Error Beta
1
(Constant) 6.075 .597 10.179 .000
Gross_Sales .000 .001 -.041 -.713 .476
Profit Total .029 .007 .252 4.414 .000
a. Dependent Variable: Month of the year
⊘ This is a preview!⊘
Do you want full access?
Subscribe today to unlock all pages.

Trusted by 1+ million students worldwide
1 out of 17
Related Documents
Your All-in-One AI-Powered Toolkit for Academic Success.
+13062052269
info@desklib.com
Available 24*7 on WhatsApp / Email
Unlock your academic potential
Copyright © 2020–2026 A2Z Services. All Rights Reserved. Developed and managed by ZUCOL.


