Comprehensive Business Analysis of Tesco: Sampling, Data, and MIS
VerifiedAdded on 2023/06/07
|20
|5589
|62
Report
AI Summary
This report provides a comprehensive business analysis of Tesco, focusing on the significance of sampling techniques and population in gauging colleague responses to a holiday pay scheme. It contrasts primary and secondary data, highlighting their advantages, disadvantages, and differences. The report includes statistical calculations based on Tesco’s financial performance and discusses the role of Management Information Systems (MIS) in business decision-making. The analysis covers survey methodologies, data collection methods, and the application of statistical tools for effective problem-solving within the organization, emphasizing the importance of data-driven strategies for Tesco's success in a competitive market. Desklib provides access to similar solved assignments for students.

BUSINESS ANALYSIS
Paraphrase This Document
Need a fresh take? Get an instant paraphrase of this document with our AI Paraphraser
Table of Contents
INTRODUCTION...........................................................................................................................3
Introduction to the selected organization – Tesco.......................................................................3
QUESTION 1..................................................................................................................................3
QUESTION 2..................................................................................................................................6
Primary data & Secondary data...................................................................................................6
QUESTION 3................................................................................................................................11
QUESTION 4................................................................................................................................13
CONCLUSION..............................................................................................................................16
REFERENCES..............................................................................................................................17
Books and Journals....................................................................................................................17
INTRODUCTION
This report is all about how and why business analysis is done. The reason for doing
business analysis commonly revolves around the identification of need to introduce change with
respect to the working of the organization along with how this change could be facilitated
effectively (Palepu and et.al., 2020). Therefore, business analysis always aims to determine the
solution through which maximum value could be delivered by an organization. In this report, the
discussion would be done with respect to four different questions. The first one will be the
explanation of significance of sampling techniques and population while gauging the possible
responses of fellow colleagues in introducing holiday pay scheme. In second question, the
contrasting & comparison would be done between secondary & primary data by stating its
advantages, disadvantages and difference among the two. Through the quantitative measures
showing Tesco’s financial performance, the statistical calculations would be done for analysis.
At last, the discussion pertaining to the role of MIS while making business decisions will be
done. Tesco would be the organization selected for this report.
Introduction to the selected organization – Tesco
Tesco is a leading multinational organization dealing in groceries products in England,
UK. It is also regarded as a general merchandise retailer with a ranking as third largest retailer
across the globe in terms of its gross revenues while the ranking of ninth largest across the globe
in terms of its net revenues. The company having more than 5000 retail outlets and 350000
employees as reported in 2021.
QUESTION 1
While conducting survey, information is gathered by asking questions from a group of
people to answer a particular research question. The responses resulting from survey initiated
through interview and questionnaire are then analyzed with the help of different statistical tools
and methods in order to determine effective solution to the problem facing the business. Survey
is usually suitable where the requirement of identification of opinions, preferences,
characteristics and beliefs involved from concerned target group (Rahman, and et.al., 2022).
For Tesco, survey would be a flexible method to be used for gauging their fellow
colleague’s responses with respect to the holiday pay scheme. For conducting a survey
⊘ This is a preview!⊘
Do you want full access?
Subscribe today to unlock all pages.
Trusted by 1+ million students worldwide
successfully, researcher is required to go through with six steps to make sure that they have
accomplished their objective underpinning the research of what would be the reaction of fellow
colleagues with respect to the implementation of holiday pay scheme (Lee and Spratling, 2019).
These steps involve identification of potential survey participants, determination of the mode of
survey that is, online or offline, setting questions to be requested from the participants, getting
participant’s response either through questionnaire or interview, conducting analysis and
drawing results from the responses. All these steps must be followed consciously by Tesco in
order to effectively gauge their colleague’s responses prior to the implementation of changes in
policies related to work culture. This is because such policies & schemes like holiday pay
scheme pay great effect the employee’s productivity and accordingly, the overall organizational
performance gets affected.
Therefore, it must be kept in mind that for effective survey, enough focus should be given
with respect to the sampling technique and population.
Population
Population of the survey means that particular group of people about whom the
researcher wants to determine something or solve any of their issue or problem (Pedigo, 2020).
In other words, they are regarded as potential survey participants from whom the information
meant for addressing the stated research issue can be obtained. It must be kept in mind while
conducting a survey that population includes all those individuals about whom the surveyor is
going to draw some conclusion. As population involves a very large group of people, sampling is
done for selecting limited number of individuals who participate in the survey and give their
responses. This is because of the constraints related to time & budget which do not allow
surveyor to get responses from each and every individual who are part of the entire population.
Accordingly, the size of population is always larger than the size of sample. With respect to
Tesco, all the fellow colleagues would be regarded as the population of the survey as
implementation of holiday pay scheme would be going to affect all of them. In statistics,
population is defined as the pool of individual out of which the statistical sample is formed for
conducting research. Commonly, too many individuals are studied for drawing conclusions
reliably and conveniently.
Paraphrase This Document
Need a fresh take? Get an instant paraphrase of this document with our AI Paraphraser
Surveyor not always go for creating a sample out of the population and instead of that,
they also gather information from every individual forming the population. It is straightforward
to collect data from the whole group of people who are associated with the research issue when
the population is small, cooperative and easily accessible.
Determination of right population is very important in research, as in the absence of that
survey cannot be initiated. Further, the end results of the research are meant for the population
only because the aim of the researches always revolves around the demand, need or problem of
the population (Dhondt and et.al., 2021). It can be better explained through the case of Tesco,
where the management is going to conduct the survey for getting understood of what would be
the possible reaction of their fellow colleagues if the policy of stretched working day and
working hours would be implemented, where the population or colleagues would require to
commit more time towards the company. Through this survey, management will get responses
from their colleagues which in turn would aid in determining whether the underpinning objective
of the policy is possible to be attained or not.
Example of population with reference to the Tesco conducting survey on fellow
colleagues involves all the employees of Tesco for whom the holiday pay scheme will be
introduced. Other examples could be employees working in the financial sector, HR manager of
banks, etc.
Sampling techniques
It refers to such techniques through which the individuals from the population who are going to
become the sample of the research is determined. These techniques are adopted in the event
when the researcher found the size of population to be big and accordingly, there is need to form
a sample (Buntin, 2020). Therefore, several methods are available for forming sample
appropriately, so that results could be generalized in a better way which is possible only when
the sample is appropriately depicting the characteristics of the population. These techniques of
obtaining sample are categorized into two categories where there are subgroups as well, such as
the following:
Probability sampling: Samples are obtained on a random basis which assists in minimizing the
biasness risks and accordingly, the validity of the research outcome can be enhanced. The
following techniques are available under this group.
Simple random sampling: All units of the population have equal chance of getting included in the
sample. Tesco can assign numbers to all their fellow colleagues and then randomly elect
numbers to form a sample (Bhardwaj, 2019).
Systematic sampling: This technique also involves assignment of numbers to the units of
population, however, selection is done on the basis of criteria defined like choosing a number
after some intervals. For example, Tesco forming sample by electing those colleagues who are
given the number which is a multiple of 3.
Non-probability sampling: Non-random criteria is there for sample creation and accordingly,
population units do not have equal opportunity to get into the sample. This method is highly
convenient & cheaper to the researcher. The following techniques are relevant to this:
Convenience sampling: Accessibility to the population units is the core of this technique and
sample is created on this basis only. Like, management of Tesco can choose those colleagues
only who are immediately accessible to them or just after them in the organizational hierarchy
(Dhondt and et.al., 2021).
Purposive sampling: Here the sample creation is done on the basis of population’s characteristics
as required by objectives of the research. Management at Tesco can go for collecting the
responses of those employees only for whom the holiday pay scheme is available.
Sampling techniques are of great significance in surveys and researches because it makes
the task of data collection easier as well as efficient. It is required from the surveyor to apply
required level of skills and competency while forming sample, so that the results outcome could
be generalized to a larger population effectively.
Examples of sampling involves employees of Tesco who are selected by adopting any of
the sampling technique discussed above for collecting data or opinions from them. Other
examples of sampling involve choosing students for conducting survey out of the entire
university.
⊘ This is a preview!⊘
Do you want full access?
Subscribe today to unlock all pages.
Trusted by 1+ million students worldwide
QUESTION 2
Primary data & Secondary data
Data includes both facts & statistics that are being collected by the researcher for
attaining or answering the research question. In case of business, data is helpful in making
decisions and resolving problems, so that business operations can be undertaken efficiently and
effectively because crucial aspects associated with the business are reported on the basis of data
only. To be successful in a contemporary competitive market, it is required from the
management to gather standard data depicting the trends and facts of the market while making
decisions for the business. In this way, a question arises pertaining to the type of data that would
be useful for the business (Bakashbayev and et.al., 2020). Therefore, data collected by businesses
like Tesco are majorly categorized into two that is, primary & secondary data.
The bifurcation of data is done based on the source of obtaining it. Accordingly, data
gathered by the researcher for the first time with the help of field research is referred to as a
primary data. This is also called by many as a first hand data. Several sources through which the
primary data can be obtained includes filling questionnaire from the research participants (i.e.,
customers, employees, etc.) through conducting survey or personal interview and undertaking
experiments & observations.
Alternatively, when data gathered previously by someone else are obtained by the
researcher from published sources to be used in their study, such type of data is known as the
second hand or secondary data. The data used may be gathered earlier for similar & even for a
different purpose and by using secondary data, researcher do not actively interact with the
research participants. Sources that provides secondary data involves internet, books, government
publications, websites, journals, etc.
In case of Tesco, which a leading supermarket of UK operating in a highly competitive
retail market of UK would necessarily be required to obtain their target audience’s responses
from time to time, so that the knowledge and idea of emerging trends along with changing tastes
or preferences can be developed (Kalu, Unachukwu and Ibiam, 2019). This is because of being
able to meet their final objective of enhancing profitability and brand image. Accordingly,
marketers of Tesco frequently interact with their target audiences by mailing questionnaire or
conducting their interviews personally when they are present in their stores to get necessary
Paraphrase This Document
Need a fresh take? Get an instant paraphrase of this document with our AI Paraphraser
insights of customer preferences & tastes emerging in the contemporary market. In this way,
primary data are always helpful in determining the current scenario or updated information
pertaining to the market.
Likewise, the secondary data is also very significant for the businesses where the
marketers by using it can determine several aspects of their target audience such as their
attitudes, buying behavior and preferences while making purchases at the retail outlets of Tesco.
Data that can be used by the marketers of Tesco could involve the sales & marketing records
maintained by the company, personal information of customers’ existing in their respective
accounts, quantity of product sold in earlier years, data related to product usage, etc. Such type of
data forms the basis of the marketing research. Secondary data also includes the marketing
research reports created previously or by close competitors in getting insights for resolving
related as well as the new problem that the business might be facing.
1. Differences in the primary data & secondary data
Basis Primary data Secondary data
Definition Information from the
participants are gathered by
the researcher for the first
time (Olabode, Olateju and
Bakare, 2019).
It involves such information
that is gathered by someone
else for the first time earlier
and is readily available to be
used in the study conducted
by the researcher.
Example Government collects primary
data through fieldwork while
obtaining data for the national
census.
Statistical information
collected through internet
such as health records,
electoral statistics, etc.
Nature of data Recent or updated
information can be obtained
when primary research is
conducted by the researcher.
This type of data depends
upon the accuracy and
reliability of the researcher
who have gathered data
previously and is not much
effective in meeting the
purpose of researcher (Scott
and Kline, 2019).
Nature of participation by
researcher
In case of primary data
collection, research took part
actively in the process of
collecting data to get the data
of required quality standard.
For examples, getting
responses of target audience
with respect to the
competitor’s products &
services involves researcher’s
direct interaction.
For getting done with the
secondary data, researchers
are not required to get
involved actively in the data
collection process because of
the data being available
readily. This makes the data
collection quick as well as
easier.
For example, the competitive
firm’s data can be gathered
through customer’s
comments and reviews posted
on the company’s websites
and several social networking
platforms which facilitates
quality information for the
management and accordingly,
no need of getting customer
responses realised at this
point.
Availability Primary data when gathered
are is always in the crude
form which needs further
simplification to make it
understandable for a layman
(Siddiqui, 2019).
Secondary data are always
available in a refined form
and accordingly, is available
in such a form that a layman
could develop useful insights
out of it.
For example, the market
reports made available by
⊘ This is a preview!⊘
Do you want full access?
Subscribe today to unlock all pages.
Trusted by 1+ million students worldwide
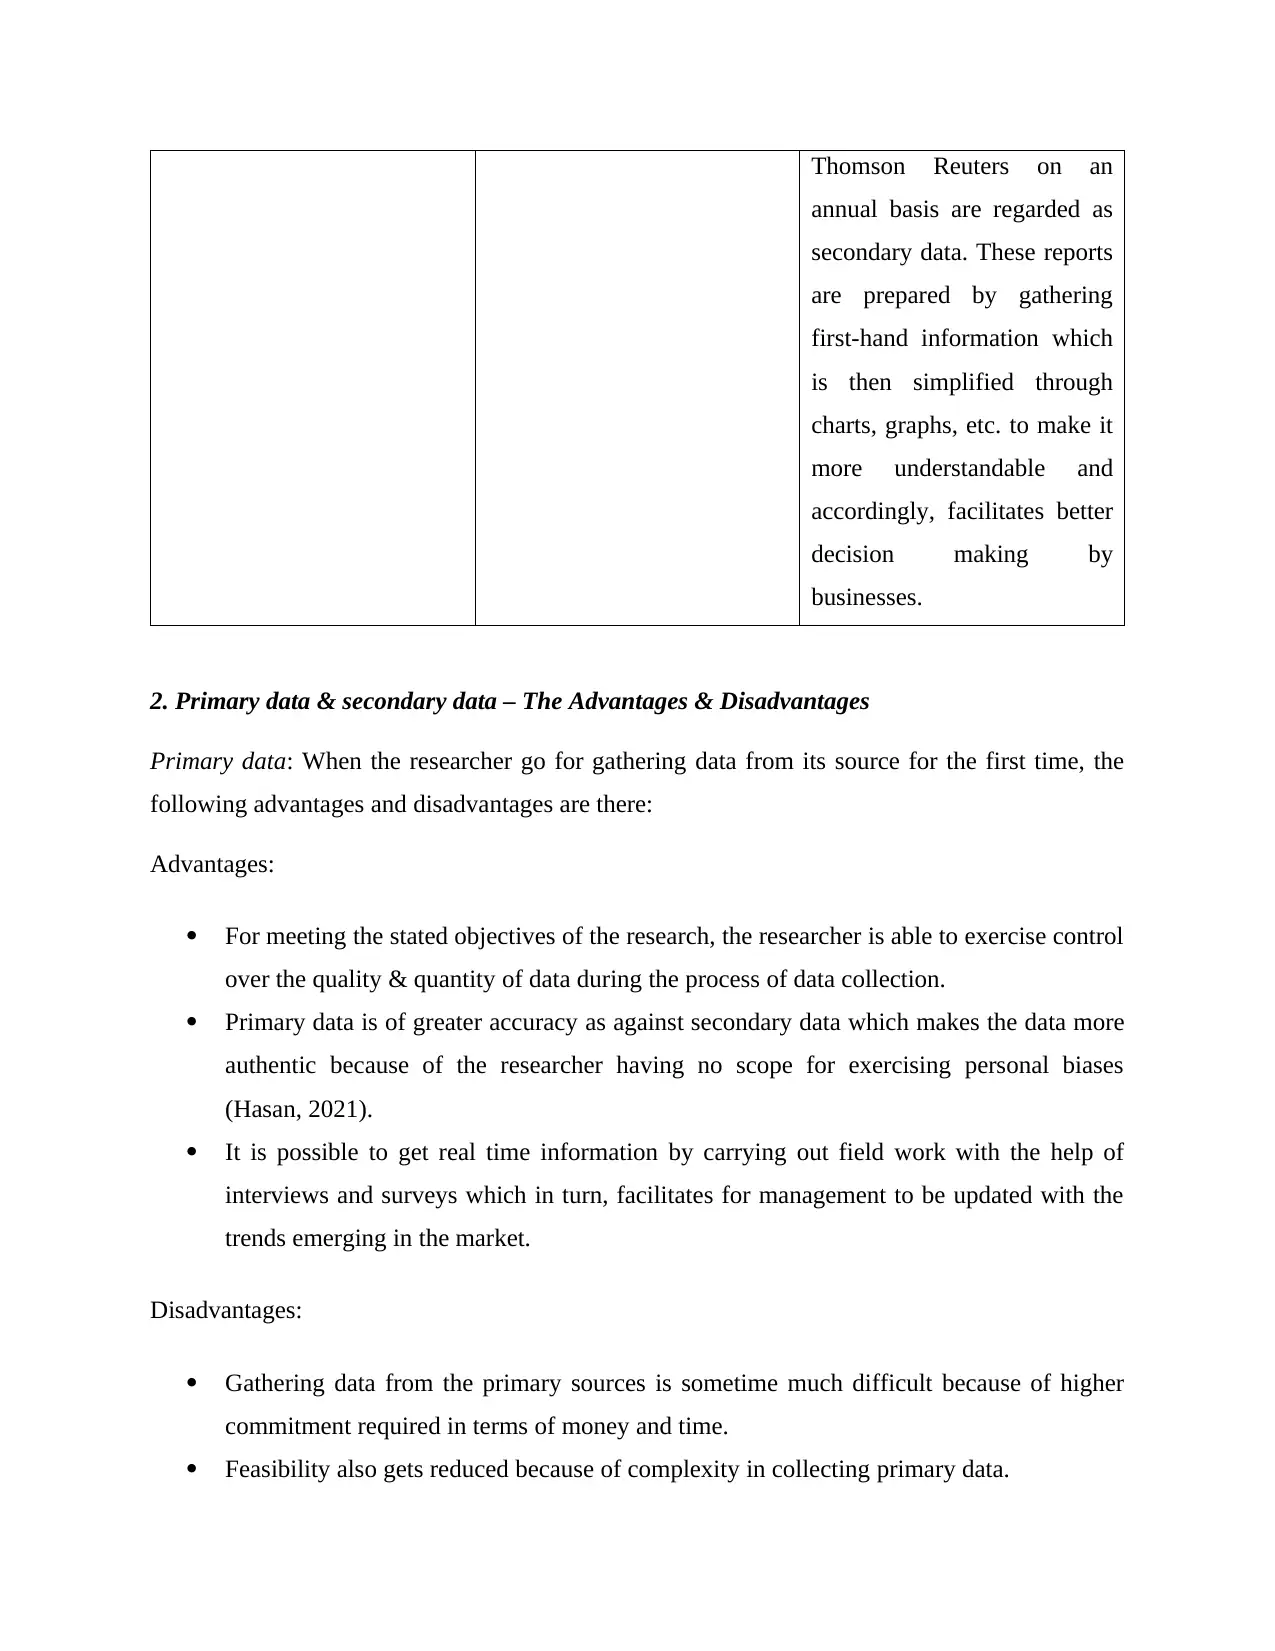
Thomson Reuters on an
annual basis are regarded as
secondary data. These reports
are prepared by gathering
first-hand information which
is then simplified through
charts, graphs, etc. to make it
more understandable and
accordingly, facilitates better
decision making by
businesses.
2. Primary data & secondary data – The Advantages & Disadvantages
Primary data: When the researcher go for gathering data from its source for the first time, the
following advantages and disadvantages are there:
Advantages:
For meeting the stated objectives of the research, the researcher is able to exercise control
over the quality & quantity of data during the process of data collection.
Primary data is of greater accuracy as against secondary data which makes the data more
authentic because of the researcher having no scope for exercising personal biases
(Hasan, 2021).
It is possible to get real time information by carrying out field work with the help of
interviews and surveys which in turn, facilitates for management to be updated with the
trends emerging in the market.
Disadvantages:
Gathering data from the primary sources is sometime much difficult because of higher
commitment required in terms of money and time.
Feasibility also gets reduced because of complexity in collecting primary data.
Paraphrase This Document
Need a fresh take? Get an instant paraphrase of this document with our AI Paraphraser
Secondary data: Second hand information which is previously collected by other researcher have
the following pros and cons to the researcher.
Advantages:
Secondary data are published on number of platforms which makes it possible for the
researcher to easily access the same.
The financial commitments are also very less in case of secondary data while sometime it
can also be obtained for free (Siddiqui, 2019).
No need of spending large amount of time in collecting data because it is ready available
to be used for developing knowledge about the market or any other research issue.
Disadvantages:
Accurate verification of secondary data is necessarily required from the researcher prior
to making decisions on the basis of it because authenticity & reliability of this data type is
highly questionable.
Data exaggeration is possible because of the presence of personal biases of the researcher
during data collection.
When a lot of irrelevant data is available over the published sources regarding the
research issue, then it definitely results in wastage of efforts as well as the time of
researcher finding needful information for their own research.
Secondary sources many times also provides outdated information where researcher
could not get the required information in its updated form which leads to data losing its
validity to be used for subsequent researches.
Data can be identified as primary & secondary data on the basis of the source from which they
are obtained. Example of primary data could be the information that has been collected through
surveys, questionnaire, interviews, observations, experiments, etc. while the secondary data
could be the information gathered from books, articles, blogs, journals, websites, etc.
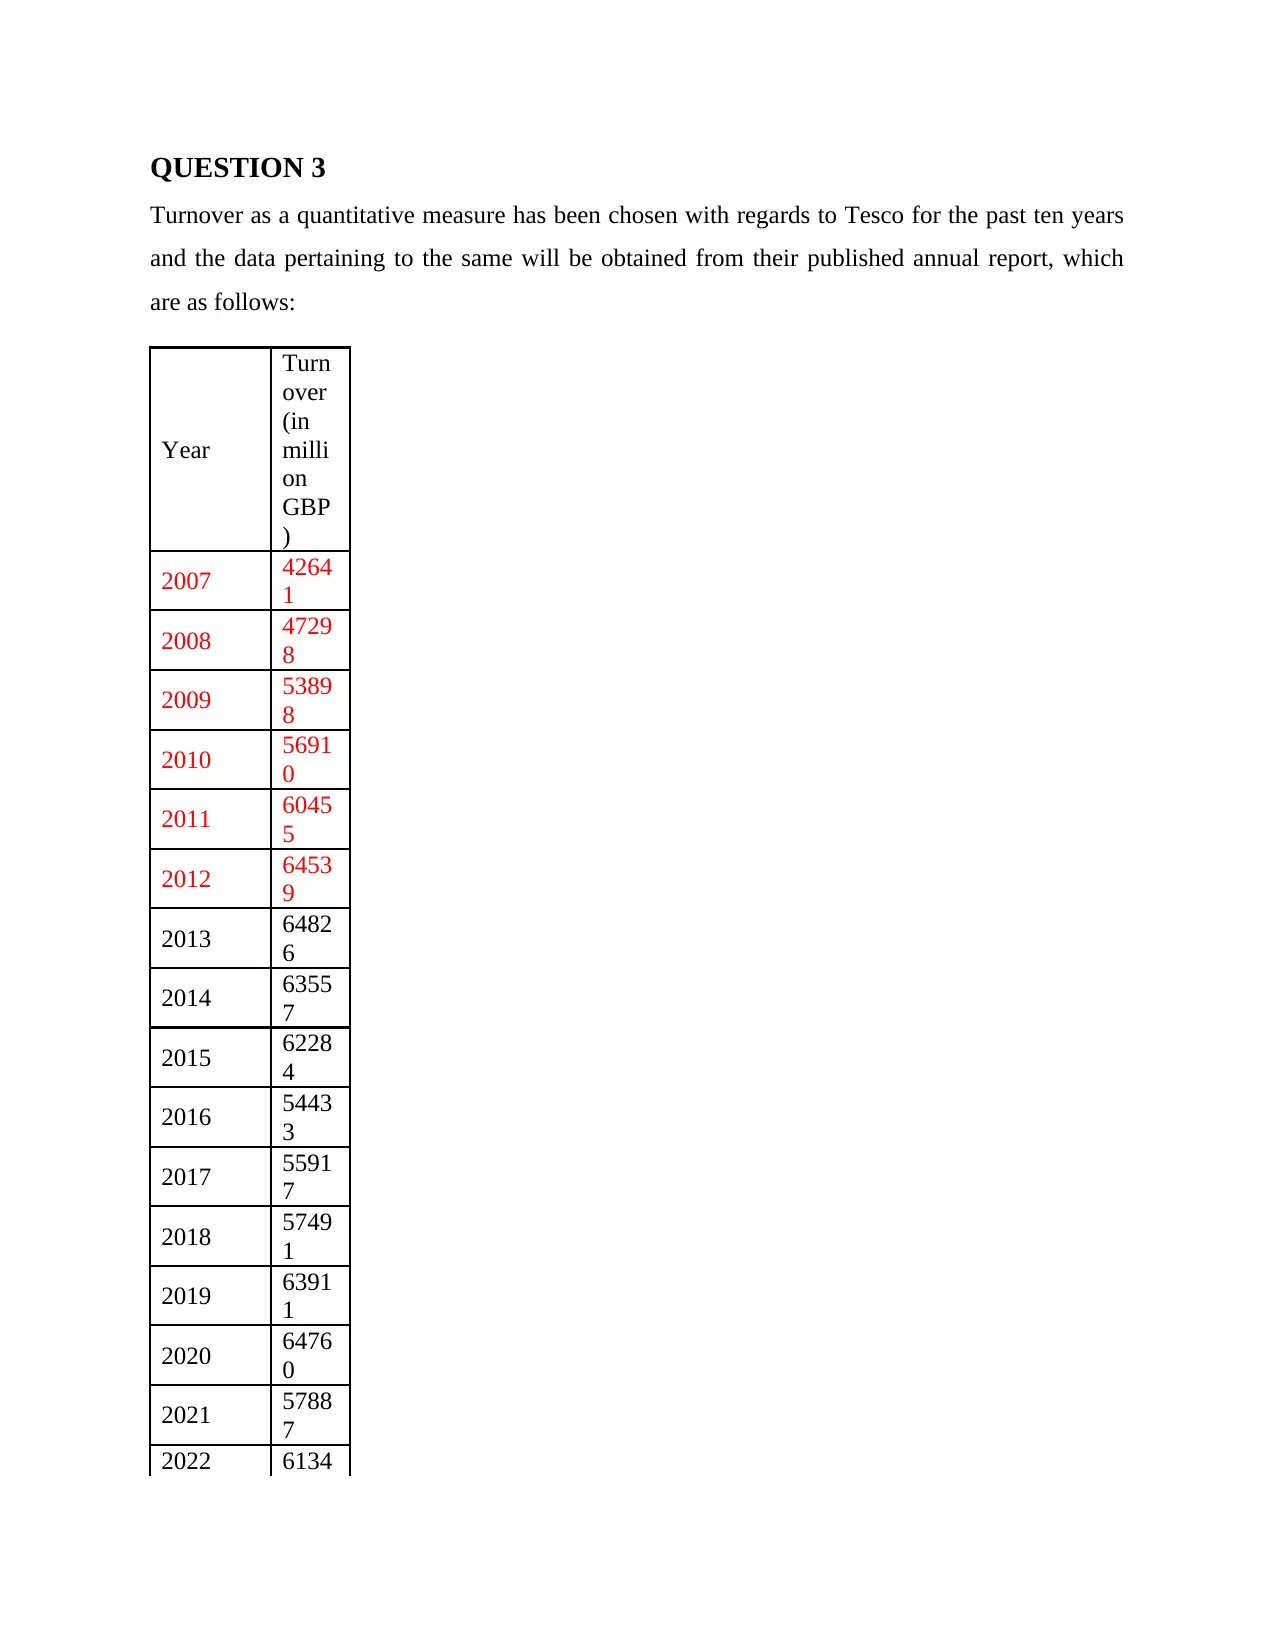
QUESTION 3
Turnover as a quantitative measure has been chosen with regards to Tesco for the past ten years
and the data pertaining to the same will be obtained from their published annual report, which
are as follows:
Year
Turn
over
(in
milli
on
GBP
)
2007 4264
1
2008 4729
8
2009 5389
8
2010 5691
0
2011 6045
5
2012 6453
9
2013 6482
6
2014 6355
7
2015 6228
4
2016 5443
3
2017 5591
7
2018 5749
1
2019 6391
1
2020 6476
0
2021 5788
7
2022 6134
⊘ This is a preview!⊘
Do you want full access?
Subscribe today to unlock all pages.
Trusted by 1+ million students worldwide
1 out of 20
Related Documents


Your All-in-One AI-Powered Toolkit for Academic Success.
+13062052269
info@desklib.com
Available 24*7 on WhatsApp / Email
![[object Object]](/_next/static/media/star-bottom.7253800d.svg)
Unlock your academic potential
Copyright © 2020–2026 A2Z Services. All Rights Reserved. Developed and managed by ZUCOL.