Understanding and Managing: A Comprehensive Business Analysis Report

Verified

Added on  2023/06/13

|13
|1599
|431
Report
AI Summary
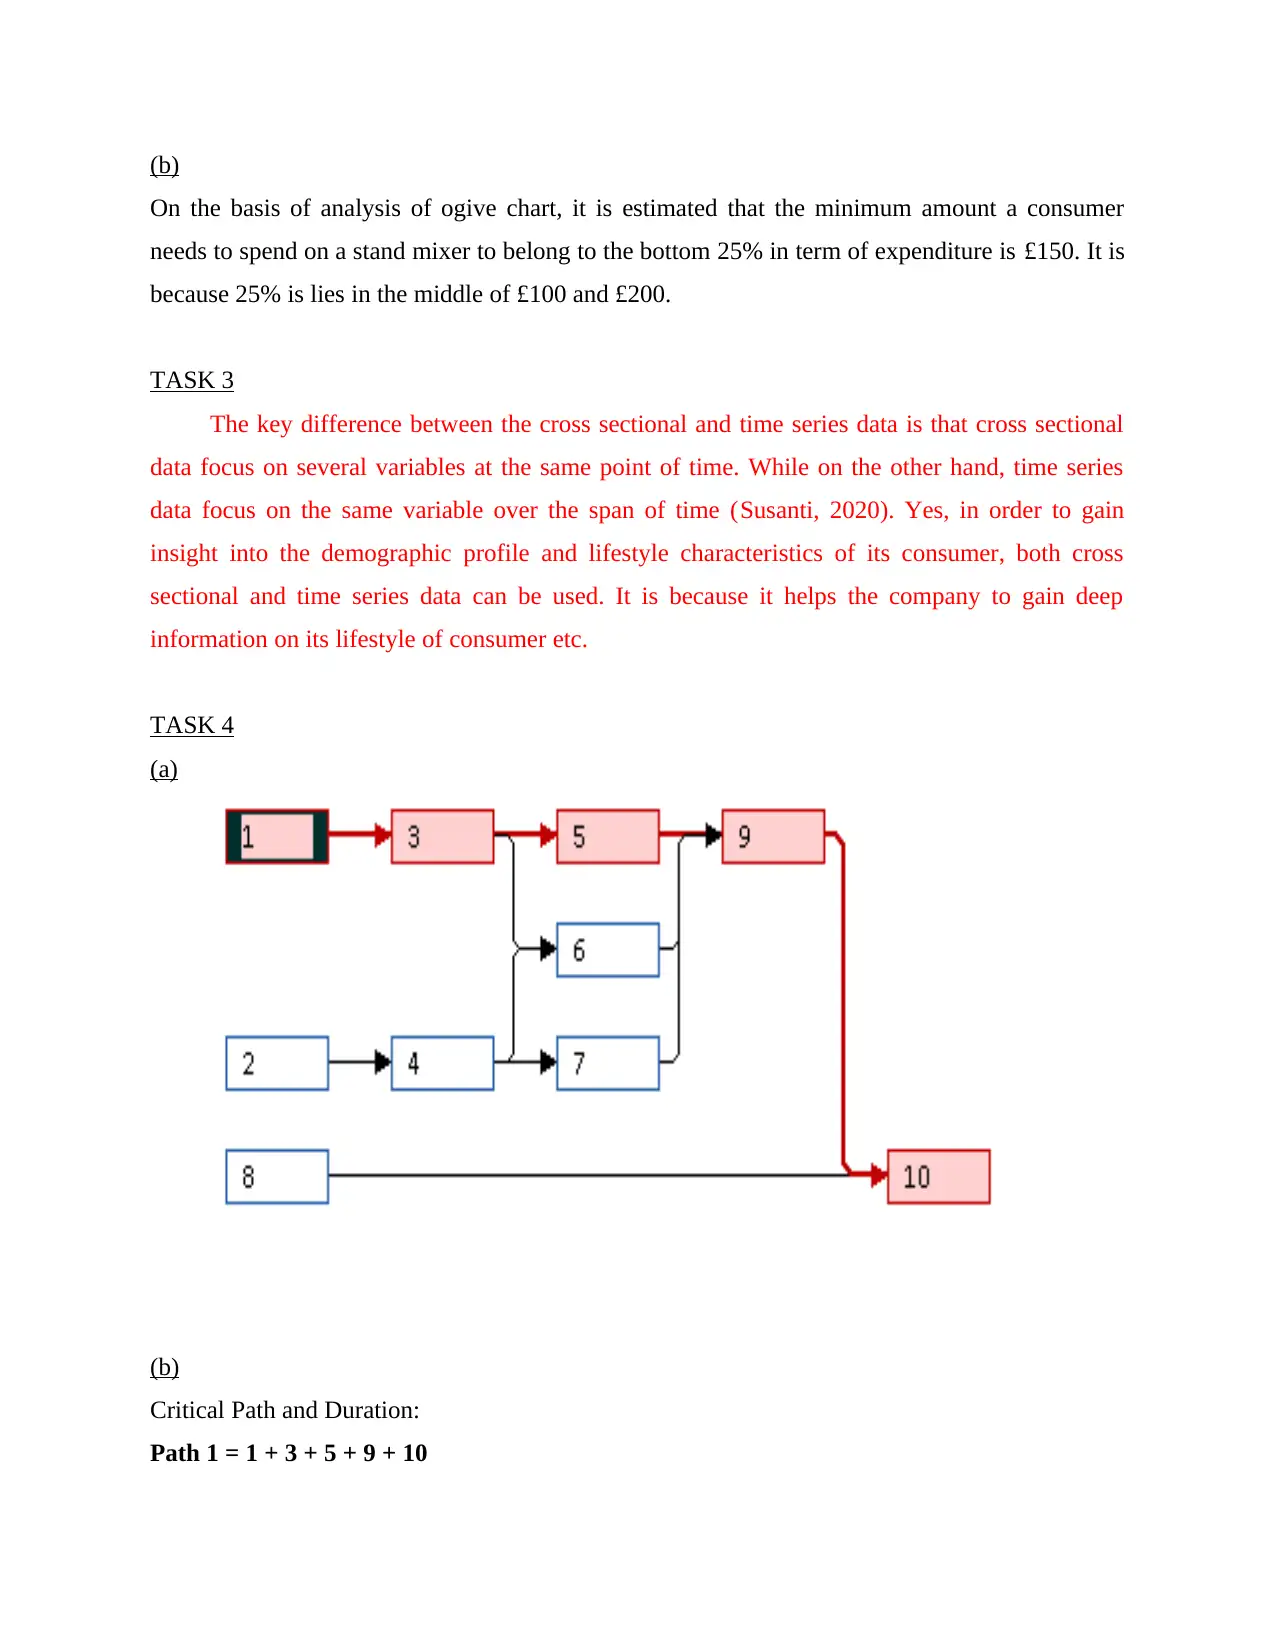
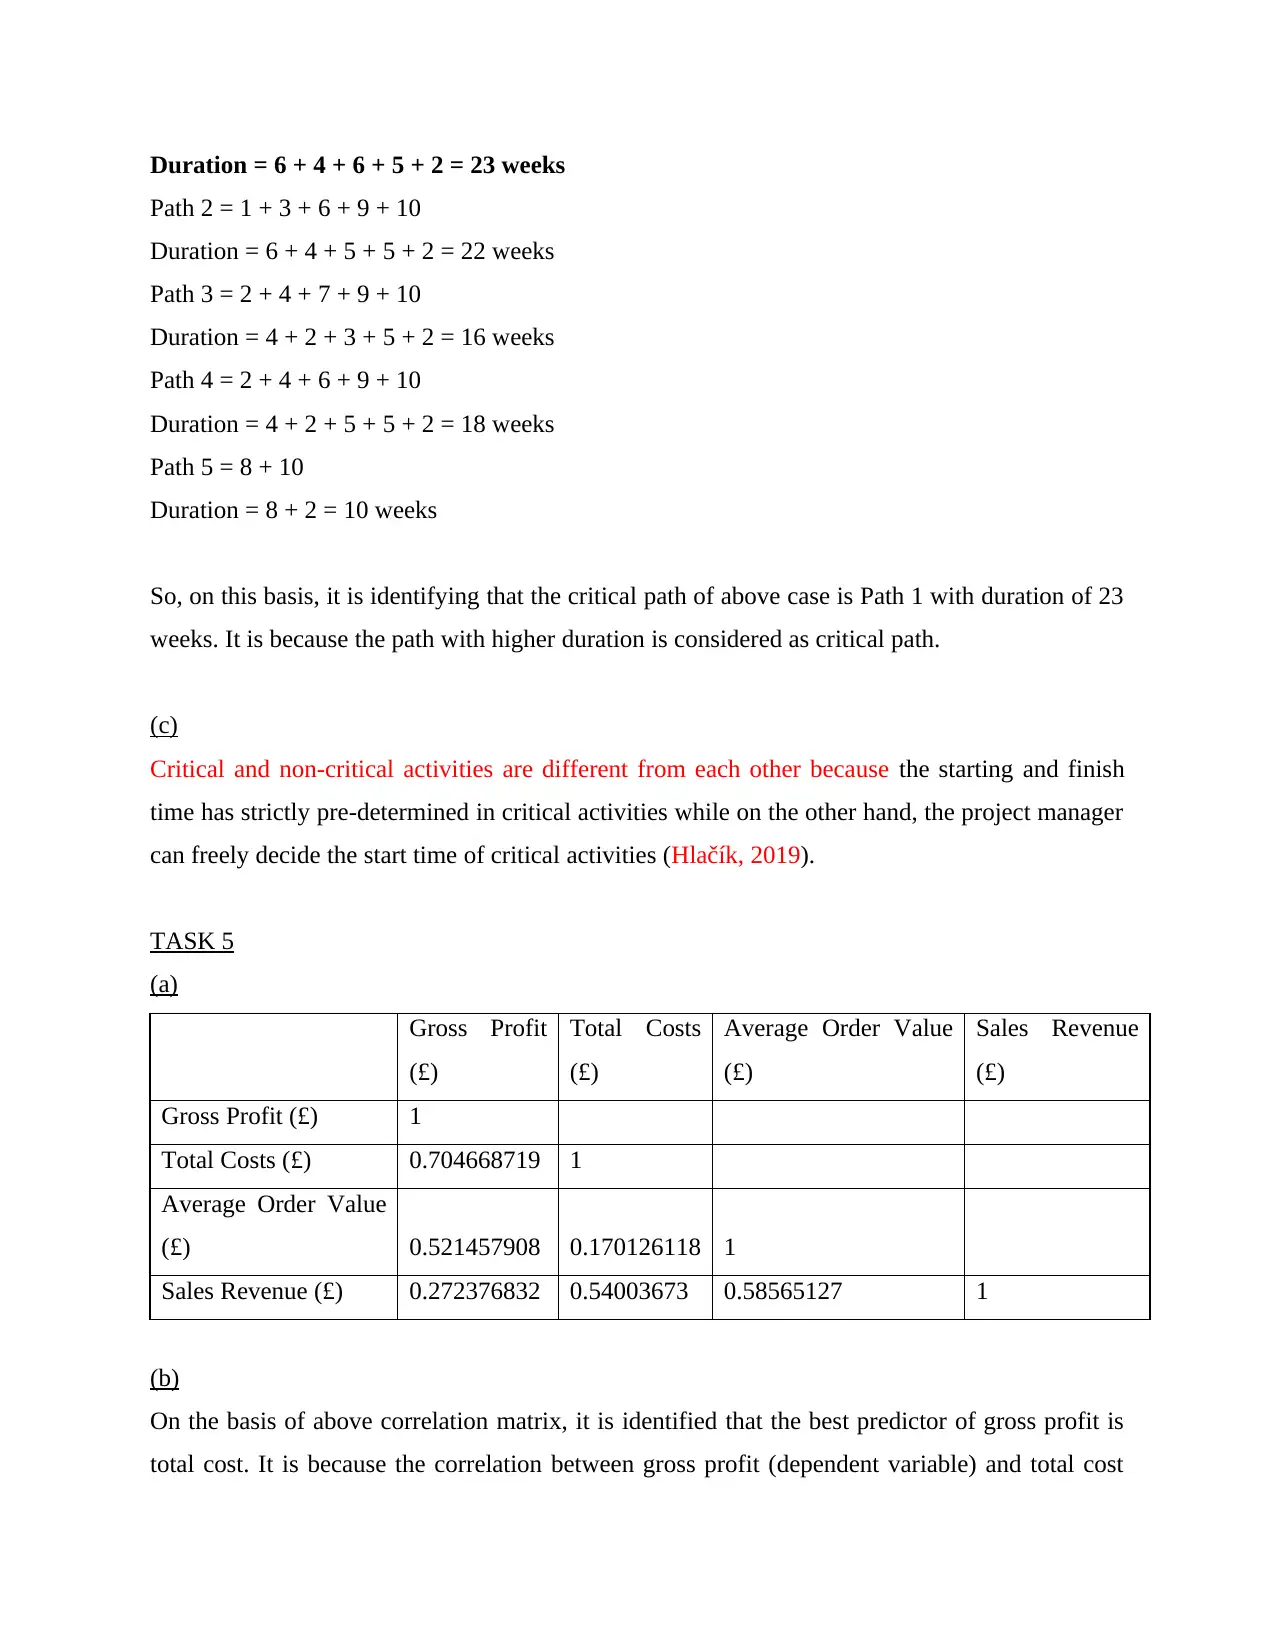
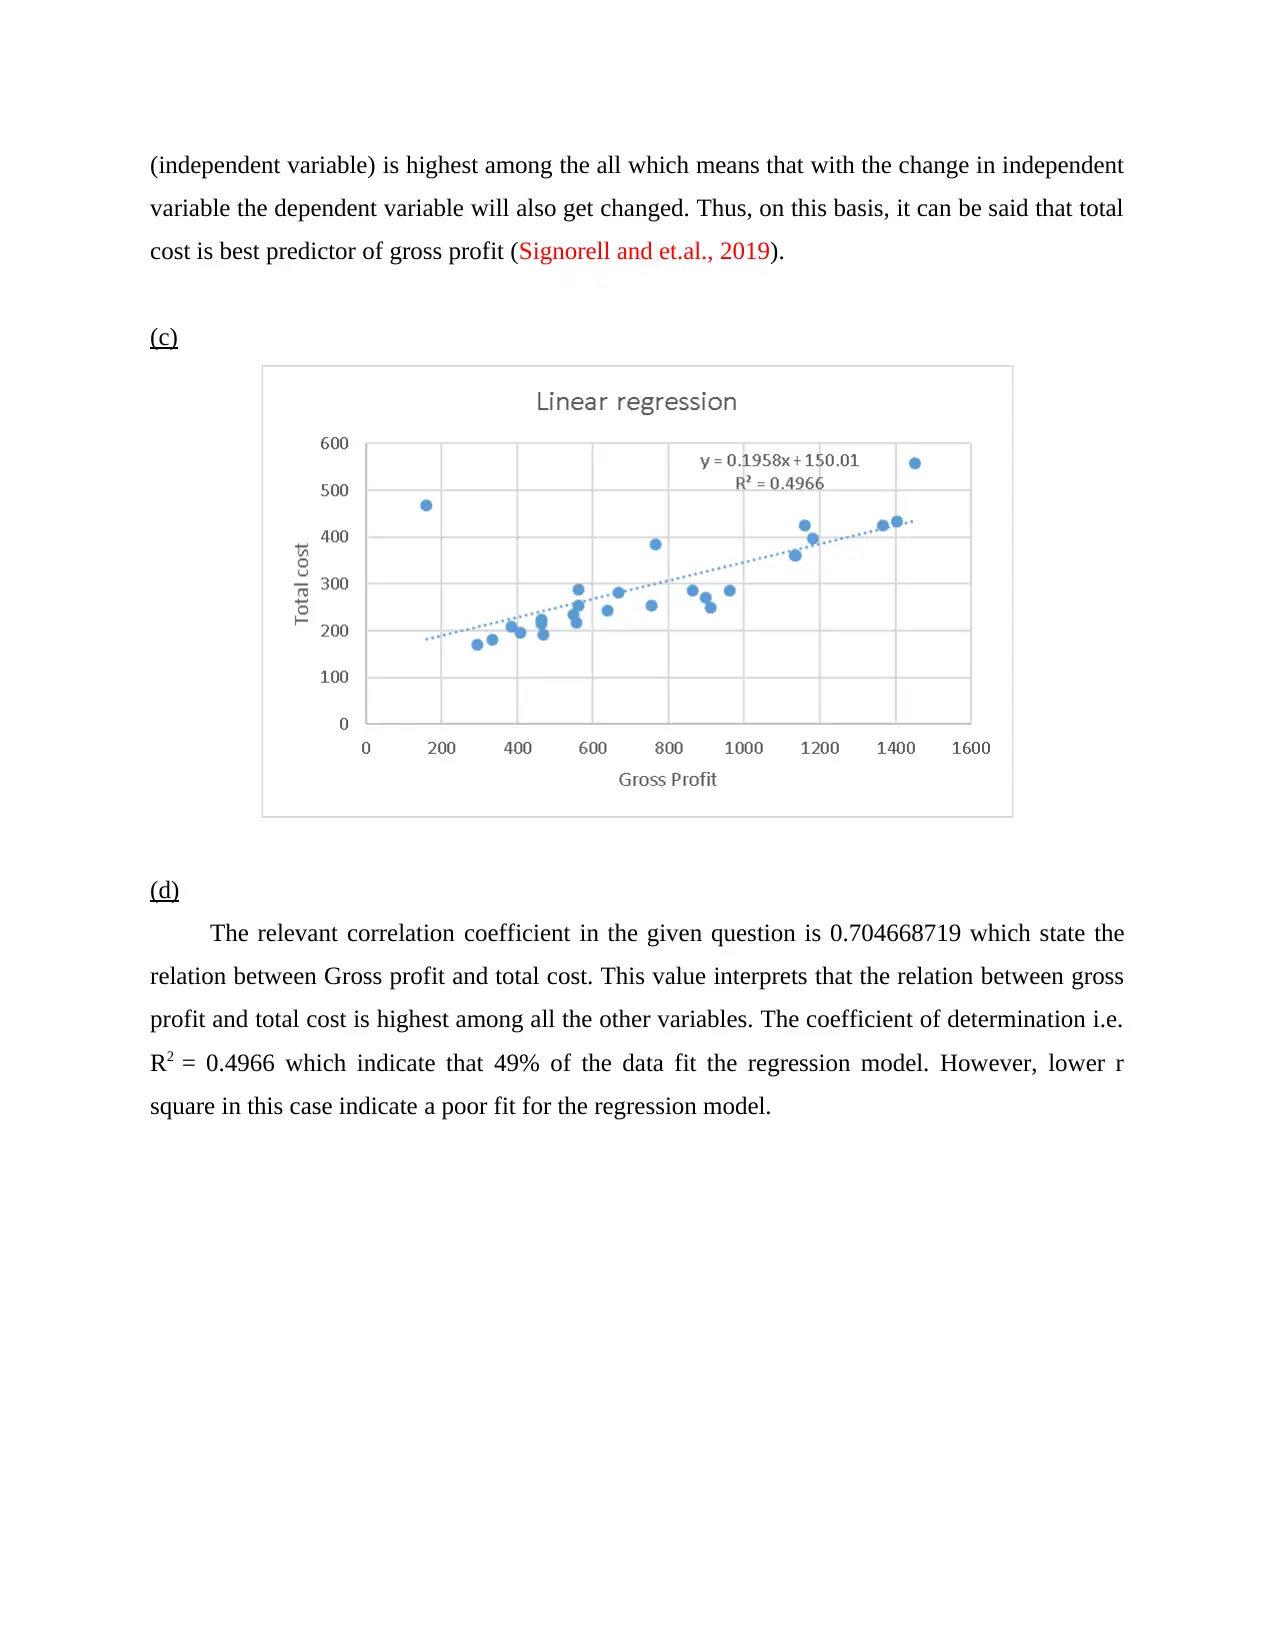
This report provides a comprehensive business analysis, covering various aspects of understanding and managing business performance. It includes statistical analysis such as calculating standard deviation and mean, analyzing expenditure frequencies, and creating cumulative frequency tables. The report also differentiates between cross-sectional and time-series data and applies them to understand consumer demographics. Furthermore, it uses the critical path method to analyze project timelines and identifies critical and non-critical activities. Correlation analysis is performed to determine the best predictors of gross profit, and break-even analysis is conducted to assess profitability and sales targets. The report concludes with reflections on the analysis process and provides insights into areas of improvement. Desklib offers a wide array of similar reports and solved assignments for students.
Document Page
UNDERSTANDING AND
MANAGING
tabler-icon-diamond-filled.svg

Secure Best Marks with AI Grader

Need help grading? Try our AI Grader for instant feedback on your assignments.
Document Page
Table of Contents
PART A...........................................................................................................................................4
TASK 1........................................................................................................................................4
(a).................................................................................................................................................4
(b).................................................................................................................................................4
TASK 2........................................................................................................................................4
(a).................................................................................................................................................4
(b).................................................................................................................................................6
TASK 3........................................................................................................................................6
TASK 4........................................................................................................................................7
(a).................................................................................................................................................7
(b).................................................................................................................................................7
(c).................................................................................................................................................8
TASK 5........................................................................................................................................8
(a).................................................................................................................................................8
(b).................................................................................................................................................8
(c).................................................................................................................................................9
(d).................................................................................................................................................9
(e).................................................................................................................................................9
TASK 6......................................................................................................................................10
(a)...............................................................................................................................................10
(b)...............................................................................................................................................10
TASK 7......................................................................................................................................10
PART 2..........................................................................................................................................10
(a)...............................................................................................................................................10
(b)...............................................................................................................................................11
(c)...............................................................................................................................................11
(d)...............................................................................................................................................11
(e)...............................................................................................................................................11
REFERENCES................................................................................................................................1
Document Page
Document Page
PART A
TASK 1
(a)
Standard deviation = √5625
= 75
Count = Sum / Mean
= 29120 / 224 = 130
(b)
The mean state the average number consumers has the capacity to pay for stand mixer is 224
while standard deviation means highest dispersion of dataset in relation to its average.
TASK 2
(a)
Table 1
Expenditure
(£) Frequency
Frequency
%
0-100 14 11%
100-200 35 27%
tabler-icon-diamond-filled.svg

Secure Best Marks with AI Grader

Need help grading? Try our AI Grader for instant feedback on your assignments.
Document Page
200-300 65 50%
300-400 16 12%
Total 130 100%
Table 2
Expenditure
(£) Frequency
Cumulative
frequency
(less than)
Cumulative
frequency
percentage
0-100 14 14 11%
100-200 35 49 38%
200-300 65 114 88%
300-400 16 130 100%
Total 130
Table 3
Expenditure
(£)
Frequency
(f)
Mid-
point
(x) fx
(x-
mean)
(x-
mean)2
f(x-
mean)2
0-100 14 50 700 -163.846 26845.56 375837.9
100-200 35 150 5250 -63.8462 4076.331 142671.6
200-300 65 250 16250 36.15385 1307.101 84961.54
300-400 16 350 5600 136.1538 18537.87 296605.9
Total 130 27800 900076.9
Mean 213.8461538
Variance 6977.340489
Standard
Deviation 83.53047641
Document Page
(b)
On the basis of analysis of ogive chart, it is estimated that the minimum amount a consumer
needs to spend on a stand mixer to belong to the bottom 25% in term of expenditure is £150. It is
because 25% is lies in the middle of £100 and £200.
TASK 3
The key difference between the cross sectional and time series data is that cross sectional
data focus on several variables at the same point of time. While on the other hand, time series
data focus on the same variable over the span of time (Susanti, 2020). Yes, in order to gain
insight into the demographic profile and lifestyle characteristics of its consumer, both cross
sectional and time series data can be used. It is because it helps the company to gain deep
information on its lifestyle of consumer etc.
TASK 4
(a)
(b)
Critical Path and Duration:
Path 1 = 1 + 3 + 5 + 9 + 10
Document Page
Duration = 6 + 4 + 6 + 5 + 2 = 23 weeks
Path 2 = 1 + 3 + 6 + 9 + 10
Duration = 6 + 4 + 5 + 5 + 2 = 22 weeks
Path 3 = 2 + 4 + 7 + 9 + 10
Duration = 4 + 2 + 3 + 5 + 2 = 16 weeks
Path 4 = 2 + 4 + 6 + 9 + 10
Duration = 4 + 2 + 5 + 5 + 2 = 18 weeks
Path 5 = 8 + 10
Duration = 8 + 2 = 10 weeks
So, on this basis, it is identifying that the critical path of above case is Path 1 with duration of 23
weeks. It is because the path with higher duration is considered as critical path.
(c)
Critical and non-critical activities are different from each other because the starting and finish
time has strictly pre-determined in critical activities while on the other hand, the project manager
can freely decide the start time of critical activities (Hlačík, 2019).
TASK 5
(a)
Gross Profit
(£)
Total Costs
(£)
Average Order Value
(£)
Sales Revenue
(£)
Gross Profit (£) 1
Total Costs (£) 0.704668719 1
Average Order Value
(£) 0.521457908 0.170126118 1
Sales Revenue (£) 0.272376832 0.54003673 0.58565127 1
(b)
On the basis of above correlation matrix, it is identified that the best predictor of gross profit is
total cost. It is because the correlation between gross profit (dependent variable) and total cost
tabler-icon-diamond-filled.svg

Paraphrase This Document

Need a fresh take? Get an instant paraphrase of this document with our AI Paraphraser
Document Page
(independent variable) is highest among the all which means that with the change in independent
variable the dependent variable will also get changed. Thus, on this basis, it can be said that total
cost is best predictor of gross profit (Signorell and et.al., 2019).
(c)
(d)
The relevant correlation coefficient in the given question is 0.704668719 which state the
relation between Gross profit and total cost. This value interprets that the relation between gross
profit and total cost is highest among all the other variables. The coefficient of determination i.e.
R2 = 0.4966 which indicate that 49% of the data fit the regression model. However, lower r
square in this case indicate a poor fit for the regression model.
Document Page
(e)
The regression equation of current situation is Y = 0.1958x + 150.01. This indicate that with
the change in total cost of the company, the gross profit will also change in same direction.
Further, 150.01 value indicate that this amount of gross profit will remain constant.
TASK 6
(a)
Coefficient of variation = Standard deviation / mean
Venture A = 30.8 / 700 * 100 = 4%
Venture B = 13.32/ 400 * 100 = 3%
(b)
With the assumption of risk averse of retailer, it is advisable to the retailer than they should
adopt for Venture B because the lower the coefficient of variation means the lower level of
dispersion around the mean. The CV less than 5% is good for thus the project with 3% CV is
good for retailer.
TASK 7
I have done ungrouped and grouped data analysis and computation well in this report.
I have faced difficulty in preparing network diagram using excel or word. Thus, I have
used project software.
I will learn the manual creation of network diagram and do it when I get the same project
in future.
Document Page
PART 2
(a)
= 400000 – 200000 / 34000 – 14000
= 200000 / 20000
= 10 per unit
= 400000 – (10 * 34000)
= 400000 – 340000 = 60000
= 200000 – (10 * 14000)
= 200000 – 140000 = 60000
(b)
Breakeven point (in units) in January 2022
= 60000 / (20 – 10)
= 60000 / 10 = 6000 units
(c)
Let the unit of t-shirt the company need to sale in order to achieve profit target of £60000 is as
follow:
= 60000 + 60000 / 10
= 120000 / 10 = 12000 units
tabler-icon-diamond-filled.svg

Secure Best Marks with AI Grader

Need help grading? Try our AI Grader for instant feedback on your assignments.
Document Page
(d)
Margin of Safety = Current sales units – Break even sales unit / current sales units * 100
= (12000 – 6000) / 12000 * 100
= 50%
This means that the 50% of the company sales are profit generation because it has cross the
breakeven point.
(e)
Three advantage of break-even analysis:
Profit and loss at different level are easily get measured with this tool.
Analyse variable and fixed cost relations.
It also predicts the effect of change in price (Brough and et.al., 2019).
Three disadvantage of break-even analysis:
It is quite time consuming for company to prepare.
Assumption of constant sales price at all level of output is not correct.
It also assumes production and sales same (Giraldo, 2020).
Document Page
Document Page
REFERENCES
Books and journals
Susanti, S., 2020. Analisis Break Even Point dan Nilai Tambah Produksi Kripik Pisang Studi
Kasus UKM Qobidh Kelurahan Kampung 4 Di Kota Tarakan.
Hlačík, F., 2019. Návrh na zlepšení ekonomické situace podniku s využitím analýzy bodu zvratu:
Proposition for Improvement of Economic Situation with use of Analysis of Break Even
Point (Doctoral dissertation, Brno University of Technology).
Signorell, A. and et.al., 2019. DescTools: Tools for descriptive statistics. R package version
0.99, 28, p.17.
Brough, C. and et.al., 2019, August. Operational mineralogy: An overview of key practices in
sample analysis, sample preparation and statistics. In Proceedings of the 15th SGA
Biennial Meeting Glasgow, Scotland (pp. 27-30).
Giraldo, M., 2020. Project-Based Learning for Teaching Statistics Using Software. Technology,
Sustainability and Educational Innovation (TSIE), 1110, p.131.
1
chevron_up_icon
1 out of 13
circle_padding
hide_on_mobile
zoom_out_icon
logo.png

Your All-in-One AI-Powered Toolkit for Academic Success.

Available 24*7 on WhatsApp / Email

[object Object]