Analysis and Valuation of US Firms' Share Data in 1996: A Report
VerifiedAdded on 2020/04/07
|13
|2256
|29
Report
AI Summary
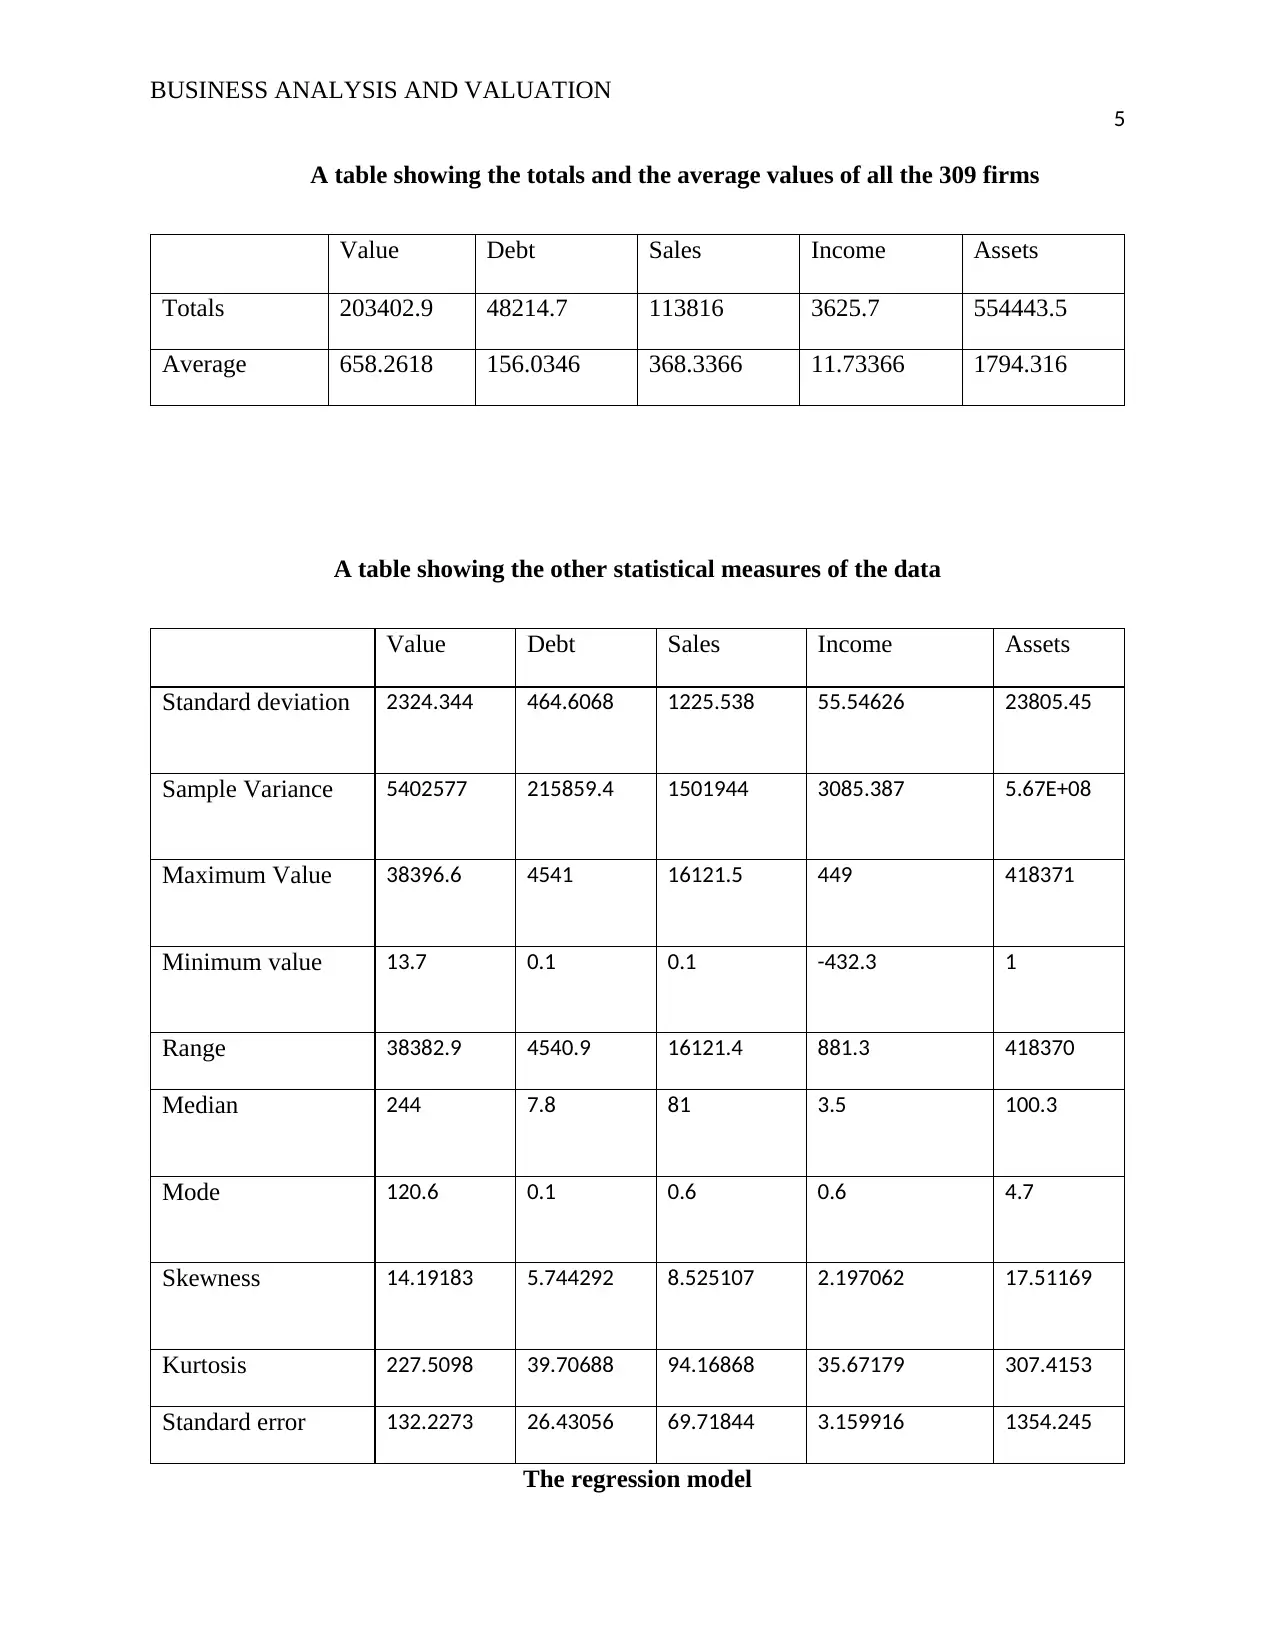
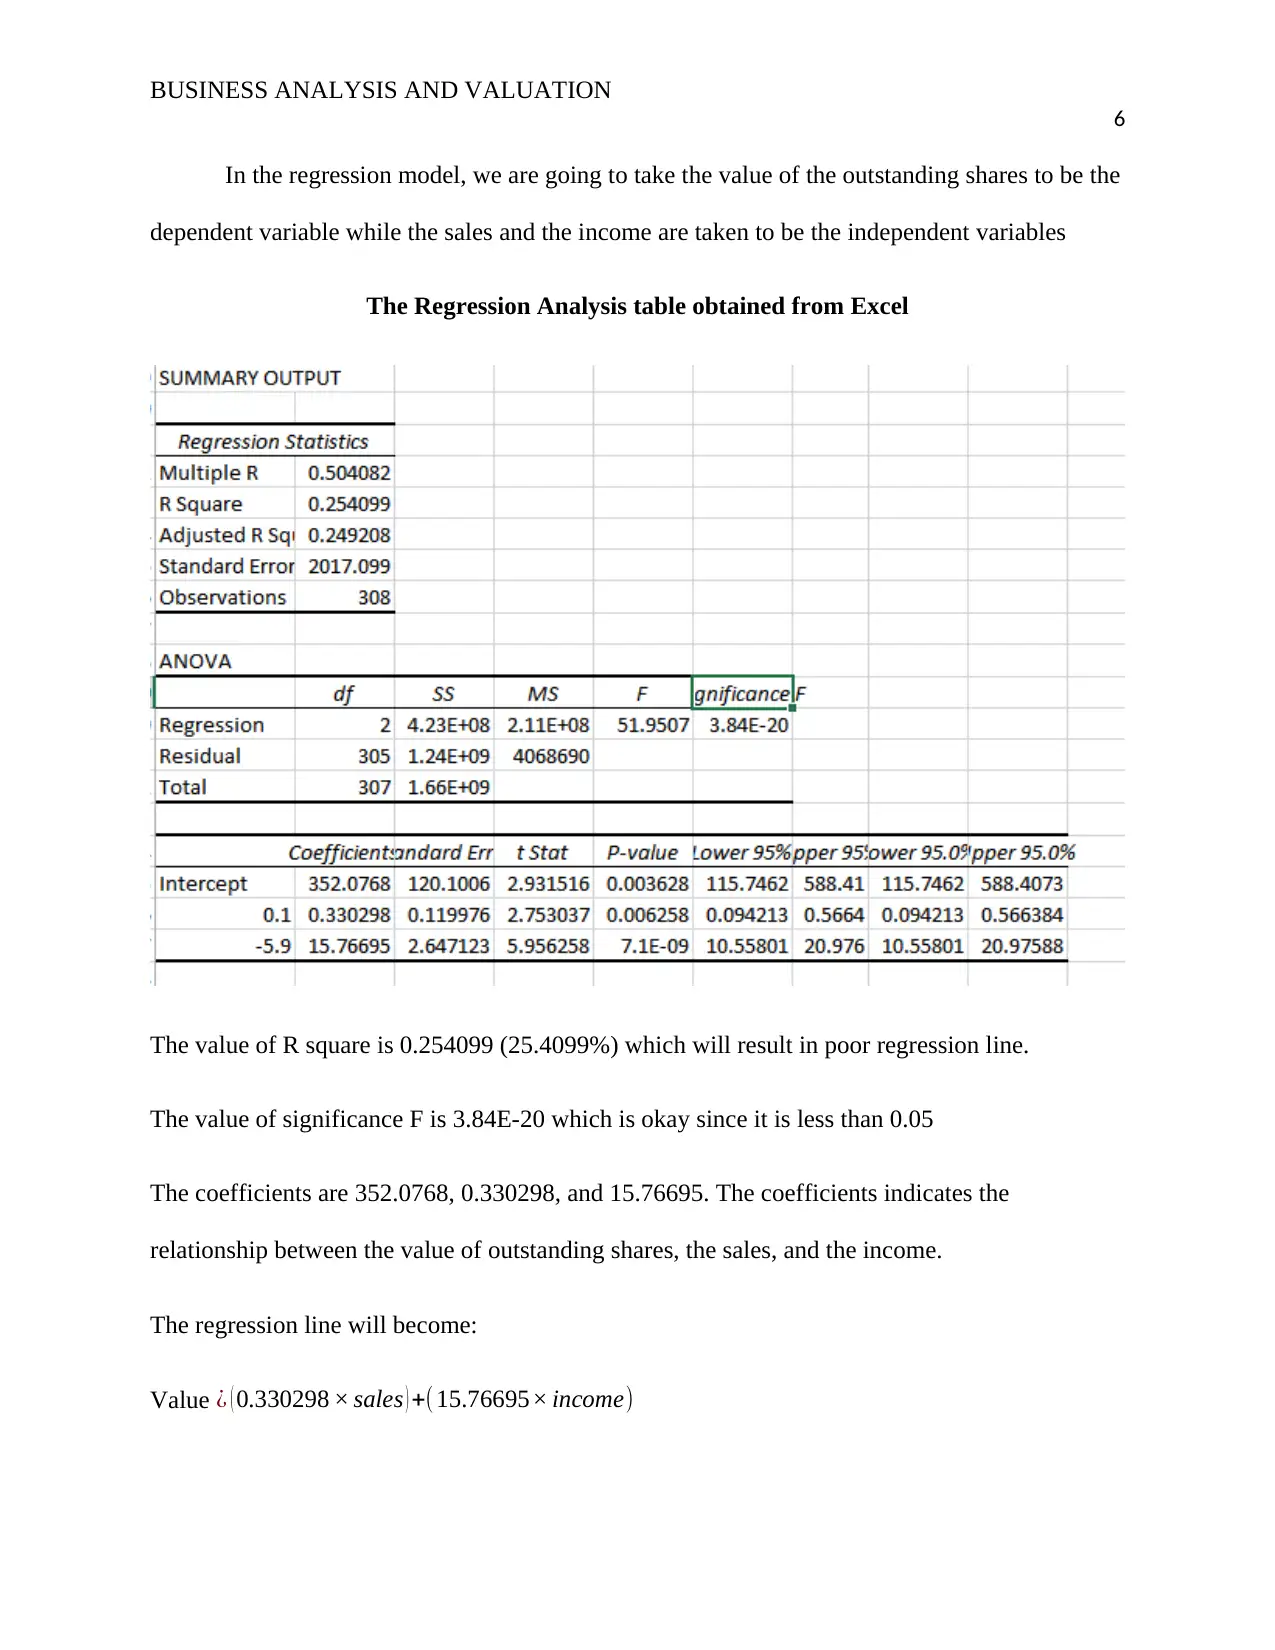
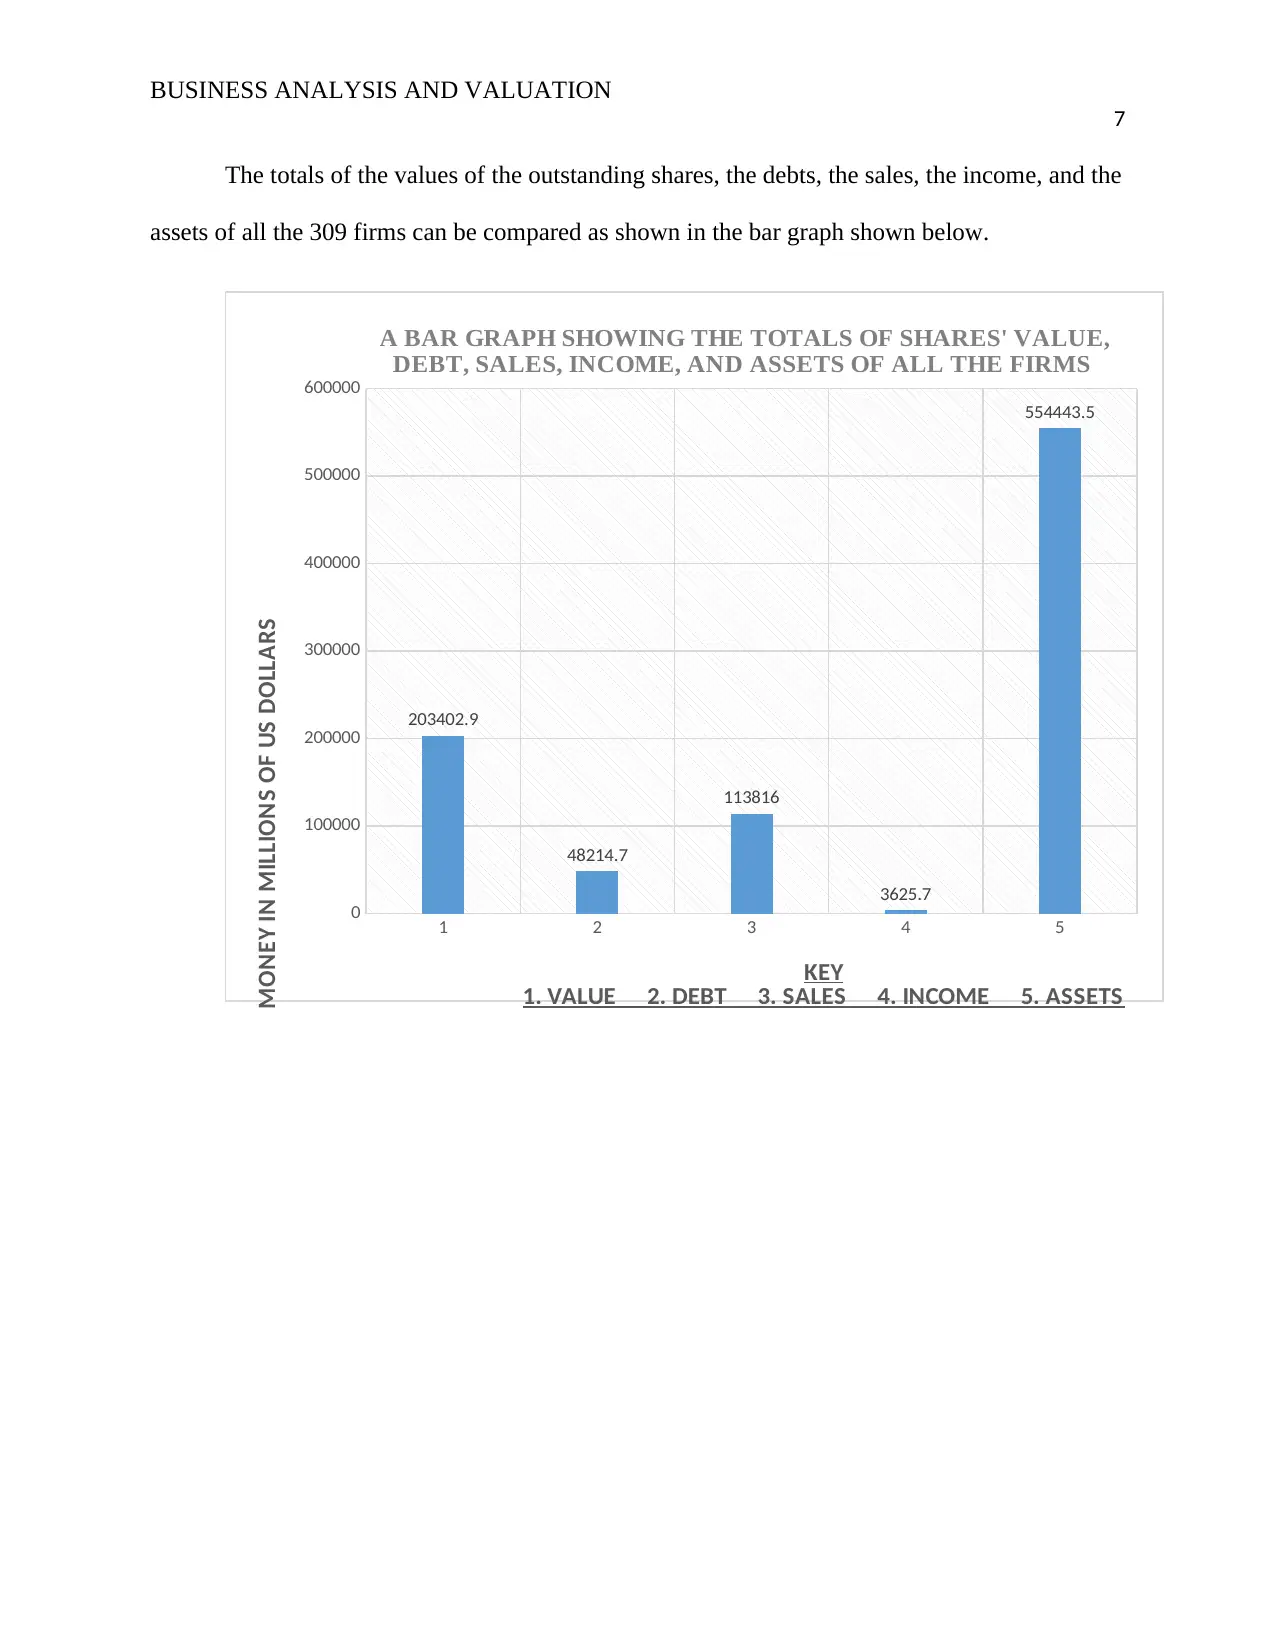
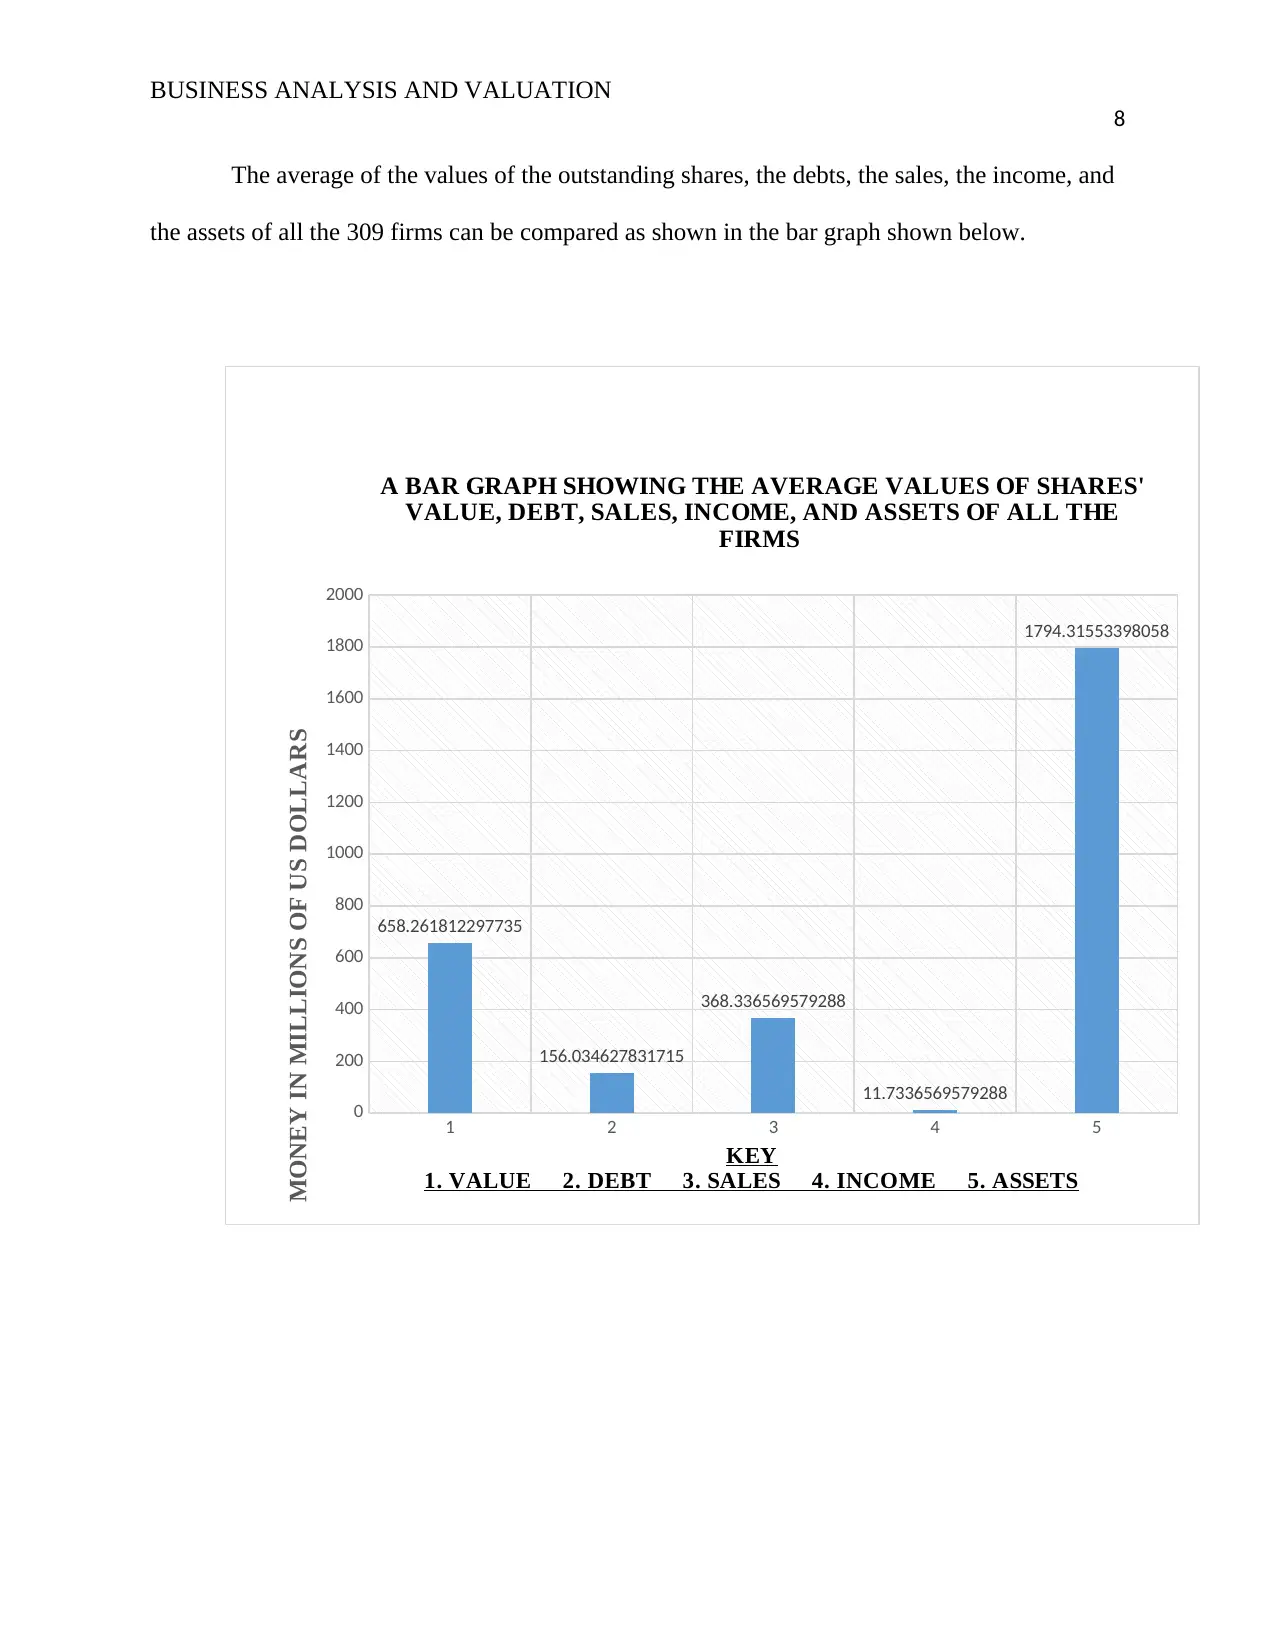
This report presents a comprehensive analysis of the share data from 309 US firms that sold shares in 1996. The study encompasses a detailed literature review on seasoned equity offerings (SEOs) and initial public offerings (IPOs), setting the stage for an investigation into the financial performance of these firms. The research focuses on key financial metrics, including the values of outstanding shares, debts, sales, income, and assets. The objectives are to determine the totals and averages of these values, compare them using bar graphs, and address specific research questions about the relationships between sales, debts, assets, and outstanding shares. The methodology involves using Microsoft Excel to calculate totals, averages, and other statistical measures. The findings reveal key comparisons, such as the total sales exceeding total debts and the average sales surpassing average debts. The analysis also includes a regression model to examine the relationship between the value of outstanding shares and sales/income. The report concludes with a discussion of the findings, limitations of the data (e.g., single-year data, lack of company-specific details), and useful conclusions regarding debt management, sales maximization, and asset utilization. The report is a valuable resource for understanding financial performance and valuation within the context of the US stock market in 1996.

Running head: BUSINESS ANALYSIS AND VALUATION
1
Business analysis and valuation
Name of Student
Institutional Affiliation
Name of Professor
Date
1
Business analysis and valuation
Name of Student
Institutional Affiliation
Name of Professor
Date
Paraphrase This Document
Need a fresh take? Get an instant paraphrase of this document with our AI Paraphraser

BUSINESS ANALYSIS AND VALUATION
2
Research on the shares sold by 309 firms in the United States in 1996.
Literature review
Most companies trade shares on the stock market. Many old firms issue new shares in
addition to those shares which trade on the stock market. These new shares are referred to as the
seasoned equity offerings (SEO). We have some firms which have never traded in the shares on
the stock market before and may be interested in trading on the shares. The shares they issue to
go to the public for sales are referred to as the initial public offerings (IPO). All the companies
invest in shares to raise some money which may be used in the expansion of the company or for
future investment.
The investors and the other financial economists are normally interested in understanding
how the stock market values the shares from any firm. The value of any firm’s shares in the
stock market is a major determinant of the number of investors who invest in the firm. High
values of a firm’s shares in the stock market attract many investors to the firm since the investors
will expect high future profits from the firm.
Objectives of the research
To determine the totals of the values of the outstanding shares, the debts, the sales, the
income, and assets of all the 309 firms who sold their shares in 1996 in the United States.
To determine the average of the values of the outstanding shares, the debts, the sales, the
income, and the assets of the 309 firms who sold their shares in the United States in 1996.

BUSINESS ANALYSIS AND VALUATION
3
To compare the totals of the values of all the outstanding shares, the debts, the sales, the
income, and the assets of all the 309 firms using a bar graph.
To compare the averages of the values of the outstanding shares, the debts, the sales, the
income, and the assets of all the 309 firms using a bar graph.
Research questions
Is the total value of the sales of the firms obtained in 1996 higher than the total value of
the long-term debts held by the firms?
Is the average value of the sales of the firms obtained 1996 higher than the average value
of the long-term debts held by the firms?
Is the total value of the assets higher than the total value of all the outstanding shares?
Is the average value of the assets higher than the average value of all the outstanding
shares?
Hypothesis
The total value of the long-term debts held by the firms is higher than the total value of
the sales obtained by the firms in 1996.
The average value of the long-term debts held by the firms is higher than the average of
sales obtained by the firms in 1996.
⊘ This is a preview!⊘
Do you want full access?
Subscribe today to unlock all pages.

Trusted by 1+ million students worldwide

BUSINESS ANALYSIS AND VALUATION
4
The total value of all the outstanding shares is higher than the total value of the assets of
the firms.
The average value of all the outstanding shares is higher than the average value of the
assets of the firms.
The research design
In this research, we are going to analyze the data set given in the file EQUITY.TXT. This
data contains all the data of the values of all the outstanding shares which were sold by all the
309 firms, the debts, the sales, the income, and the assets of all the 309 firms.
We will use the Excel tools to calculate the totals and the average of the values of the
outstanding shares, the total of the debts, the totals of the sales, the total of the income, and the
total of the assets of all the firms. We will also draw bar graphs to compare the totals and the
average of the values of the outstanding shares, the debts, the sales, the income, and the assets.
Microsoft Excel will also help us to calculate other statistical measures on the provided data. It
will also help us to do a regression analysis on the data. All these analyses of the data will help
us to get the solutions of the research questions and enable us to test and analyze our hypothesis.
The findings and data analysis
From the analysis done on the Excel workbook, we obtain the following tables which
summarize our findings.
Paraphrase This Document
Need a fresh take? Get an instant paraphrase of this document with our AI Paraphraser

BUSINESS ANALYSIS AND VALUATION
5
A table showing the totals and the average values of all the 309 firms
Value Debt Sales Income Assets
Totals 203402.9 48214.7 113816 3625.7 554443.5
Average 658.2618 156.0346 368.3366 11.73366 1794.316
A table showing the other statistical measures of the data
Value Debt Sales Income Assets
Standard deviation 2324.344 464.6068 1225.538 55.54626 23805.45
Sample Variance 5402577 215859.4 1501944 3085.387 5.67E+08
Maximum Value 38396.6 4541 16121.5 449 418371
Minimum value 13.7 0.1 0.1 -432.3 1
Range 38382.9 4540.9 16121.4 881.3 418370
Median 244 7.8 81 3.5 100.3
Mode 120.6 0.1 0.6 0.6 4.7
Skewness 14.19183 5.744292 8.525107 2.197062 17.51169
Kurtosis 227.5098 39.70688 94.16868 35.67179 307.4153
Standard error 132.2273 26.43056 69.71844 3.159916 1354.245
The regression model

BUSINESS ANALYSIS AND VALUATION
6
In the regression model, we are going to take the value of the outstanding shares to be the
dependent variable while the sales and the income are taken to be the independent variables
The Regression Analysis table obtained from Excel
The value of R square is 0.254099 (25.4099%) which will result in poor regression line.
The value of significance F is 3.84E-20 which is okay since it is less than 0.05
The coefficients are 352.0768, 0.330298, and 15.76695. The coefficients indicates the
relationship between the value of outstanding shares, the sales, and the income.
The regression line will become:
Value ¿ ( 0.330298 × sales ) +( 15.76695× income)
⊘ This is a preview!⊘
Do you want full access?
Subscribe today to unlock all pages.

Trusted by 1+ million students worldwide

BUSINESS ANALYSIS AND VALUATION
7
The totals of the values of the outstanding shares, the debts, the sales, the income, and the
assets of all the 309 firms can be compared as shown in the bar graph shown below.
1 2 3 4 5
0
100000
200000
300000
400000
500000
600000
203402.9
48214.7
113816
3625.7
554443.5
A BAR GRAPH SHOWING THE TOTALS OF SHARES' VALUE,
DEBT, SALES, INCOME, AND ASSETS OF ALL THE FIRMS
KEY
1. VALUE 2. DEBT 3. SALES 4. INCOME 5. ASSETS
MONEY IN MILLIONS OF US DOLLARS
Paraphrase This Document
Need a fresh take? Get an instant paraphrase of this document with our AI Paraphraser

BUSINESS ANALYSIS AND VALUATION
8
The average of the values of the outstanding shares, the debts, the sales, the income, and
the assets of all the 309 firms can be compared as shown in the bar graph shown below.
1 2 3 4 5
0
200
400
600
800
1000
1200
1400
1600
1800
2000
658.261812297735
156.034627831715
368.336569579288
11.7336569579288
1794.31553398058
A BAR GRAPH SHOWING THE AVERAGE VALUES OF SHARES'
VALUE, DEBT, SALES, INCOME, AND ASSETS OF ALL THE
FIRMS
KEY
1. VALUE 2. DEBT 3. SALES 4. INCOME 5. ASSETS
MONEY IN MILLIONS OF US DOLLARS

BUSINESS ANALYSIS AND VALUATION
9
Explanations and discussion of the findings
From the analysis above, we can deduce the following facts:
The total value of the long-term debt is 48214.7 million US dollars while the total
value of sales obtained by the firms in 1996 is 113816 million US dollars. From these values, we
can see the total value of the sales of 1996 is higher than the total value of the long-term debts.
The average value of the long-term debt is 156.0346 million US dollars while the average
of the sales obtained is 368.3366 million US dollars which shows that the average value of the
sales is higher than the average value of the long-term debts.
The total value of all the outstanding shares issued in 1996 is 203402.9 million US
dollars while the total value of the assets is 554443.5 million US dollars. This shows that the
total value of the assets is higher than the total value of all the outstanding shares.
The average value of the outstanding shares issued is 658.2618 million US dollars while
the average value of the assets is 1794.316 million US dollars which shows the average value of
the assets is higher than the average value of the outstanding shares issued.
Discussion of the findings
Debts and sales
Debts are usually the amount of money borrowed by people or organizations. Debts are
normally represented by bonds, loan notes, mortgage or other forms which state the repayment
⊘ This is a preview!⊘
Do you want full access?
Subscribe today to unlock all pages.

Trusted by 1+ million students worldwide

BUSINESS ANALYSIS AND VALUATION
10
terms and the interest requirements if applicable (What is Debt? definition and meaning). It is
important for the organizations to settle all their debts or have minimum debts for the
organizations to grow and become more successful (The Federal Trade Commission, 2012).
The sales made by the companies come in many different forms of goods or services.
Higher sales in the companies normally generate more profits to the companies which help in the
expansion of the companies. This attracts more investors to the businesses as the expanding
businesses have a great potential of earning the investors more profits in the future.
As seen from the given data, the total value and the average value of the sales are higher
than the total value and the average value of the long-term debts. This is a positive and a
desirable feature of the companies as it is required to minimize the debts and maximize the sales
for the companies to keep growing and expanding more.
Assets and values of shares
Assets are valuable items which are owned by entities or companies and can be used to
generate income for the entities (Viljoen-Smook, 2009). On the other hand, shares are the record
books or certificates which normally represent the ownership of a company or any organization
(Morris, 2007). Any company is required to have a good quantity of assets which will generate
some income for the company when needed. The companies normally sell their shares to the
investors for the sake of increasing its income. However, it is recommended that the number of
assets of the companies should always be higher than the shares sold by the company at any
time. In our data, we realize that the total value and the average value of the assets are higher
than the total value and the average value of the outstanding shares of the companies.
Paraphrase This Document
Need a fresh take? Get an instant paraphrase of this document with our AI Paraphraser

BUSINESS ANALYSIS AND VALUATION
11
The limitations of the report
This research report has been limited by various aspects. Some of the limitations of the
report include:
The given data contains the shares’ values, the debts, the sales, the income, and the assets
of only one year (1996). This limits our comparison capabilities since we can’t compare these
data with the data of the previous years.
The given data does not specify the companies involved. This makes it hard to know the
data of the individual companies to make the necessary analysis and comparisons.
Another limitation of the report is the large size of the sample size. The big size of the
sample (309) makes it so difficult to analyze the data of each company independently. This also
makes the comparison of the individual company’s performances very difficult.
Another limitation which has limited our research is the restriction of the size of the
report. We have so much research and analysis which can be done about the shares sold by the
companies, but the research is restricted by the size of the report.
The provision of the data has also been a limitation in the report. The students are limited
to using the provided data and are not supposed to do some more research about the data.

BUSINESS ANALYSIS AND VALUATION
12
Conclusion
From the research report, we can draw the following useful conclusions:
Companies always trade in shares in the stock market to realize some financial
benefits.
Companies always try to have minimal or no debts for them to keep on growing
and expanding more.
Companies have some assets which can be used to generate some income for the
companies when necessary.
Companies always work hard to increase their sales to realize more profits which
will help them to keep on growing.
References
⊘ This is a preview!⊘
Do you want full access?
Subscribe today to unlock all pages.

Trusted by 1+ million students worldwide
1 out of 13
Related Documents
Your All-in-One AI-Powered Toolkit for Academic Success.
+13062052269
info@desklib.com
Available 24*7 on WhatsApp / Email
Unlock your academic potential
Copyright © 2020–2025 A2Z Services. All Rights Reserved. Developed and managed by ZUCOL.


