Business Analytics 1: Comprehensive Data Analysis and Reporting
VerifiedAdded on 2022/12/27
|43
|5956
|88
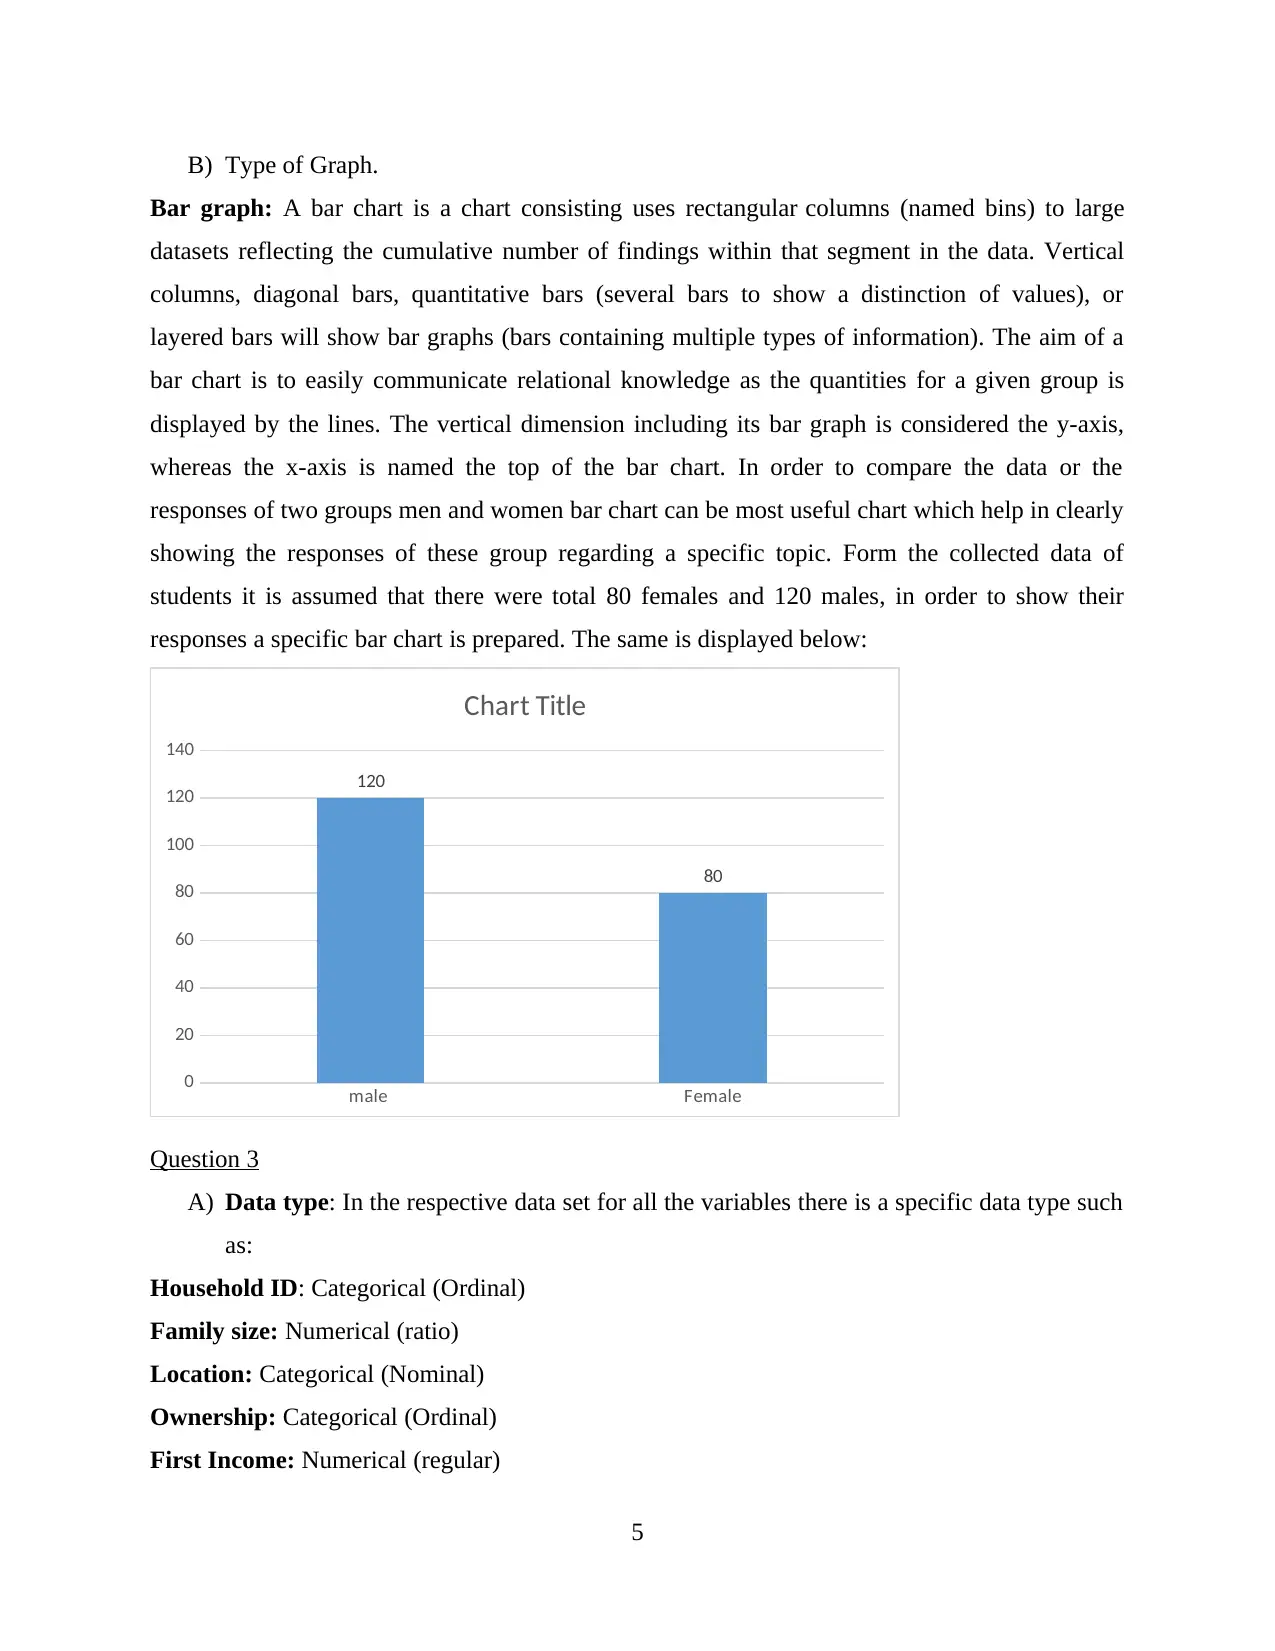
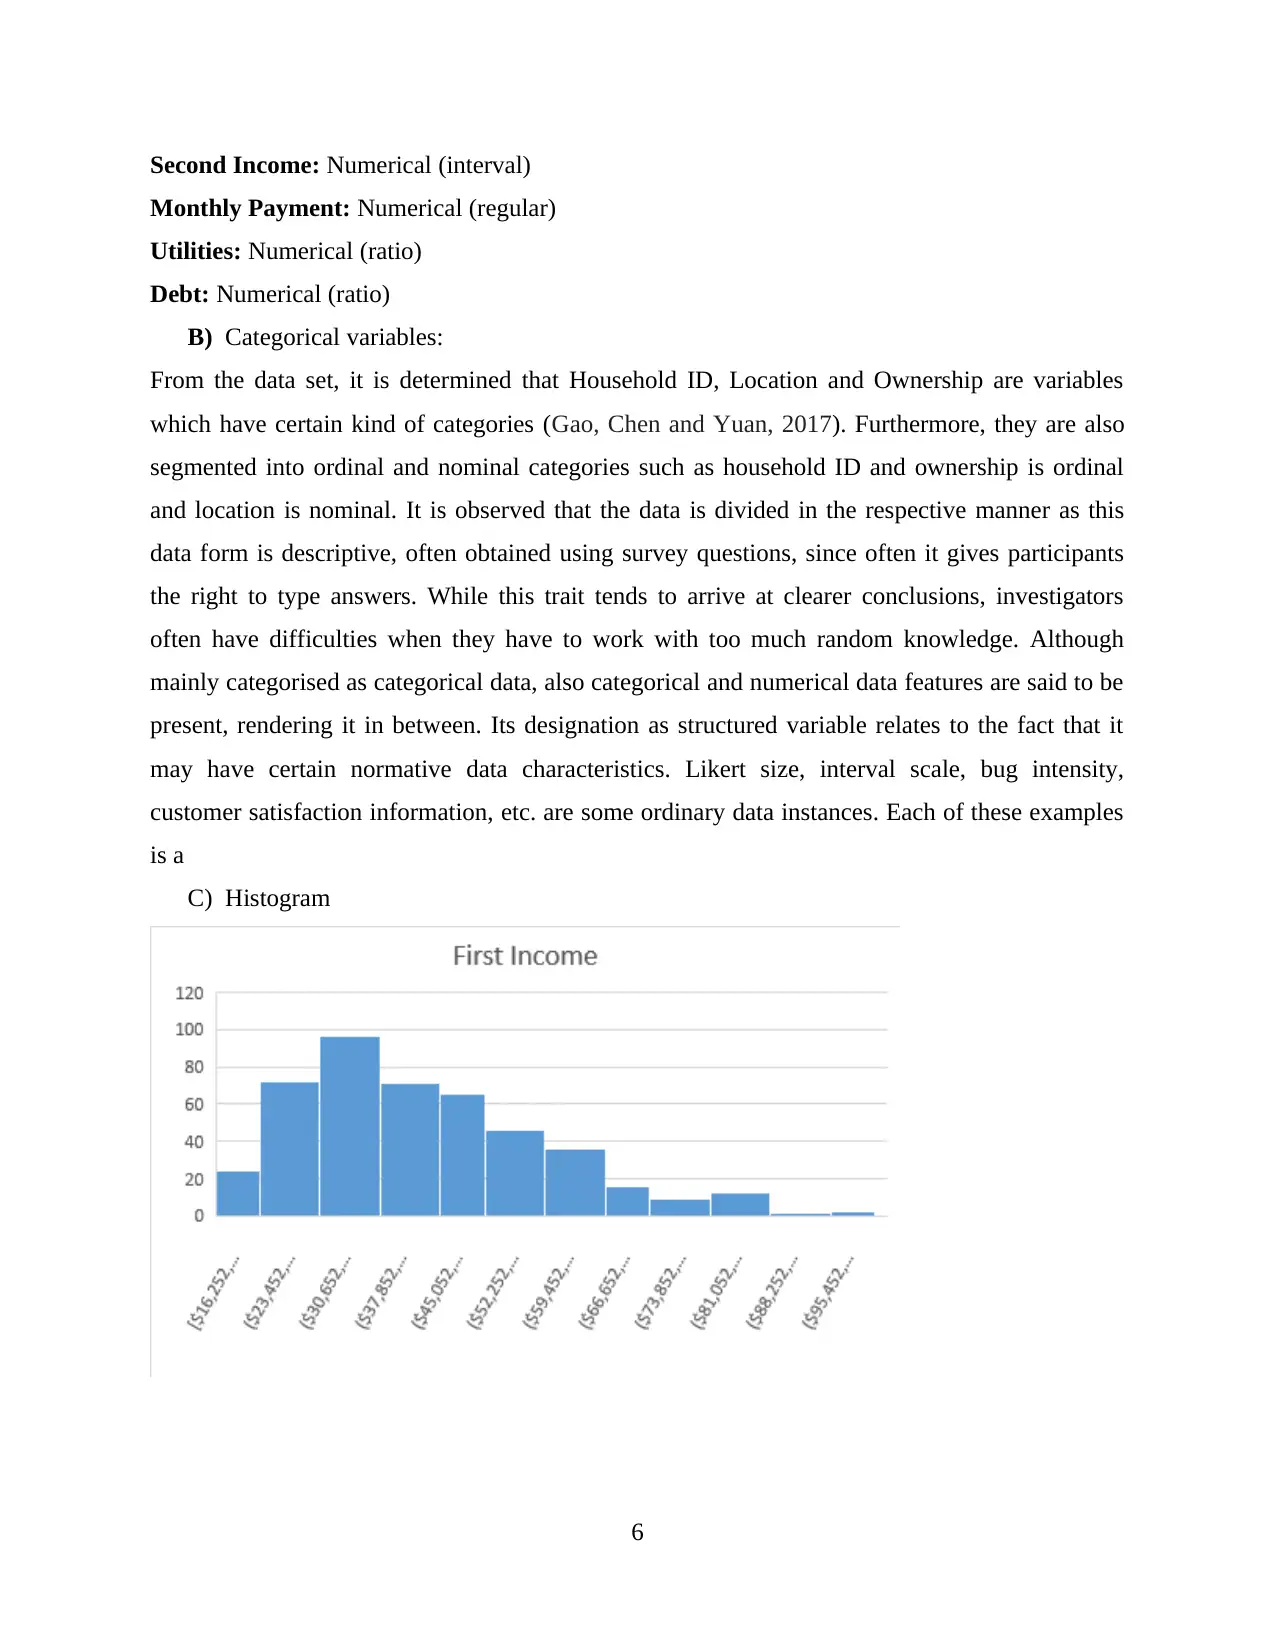
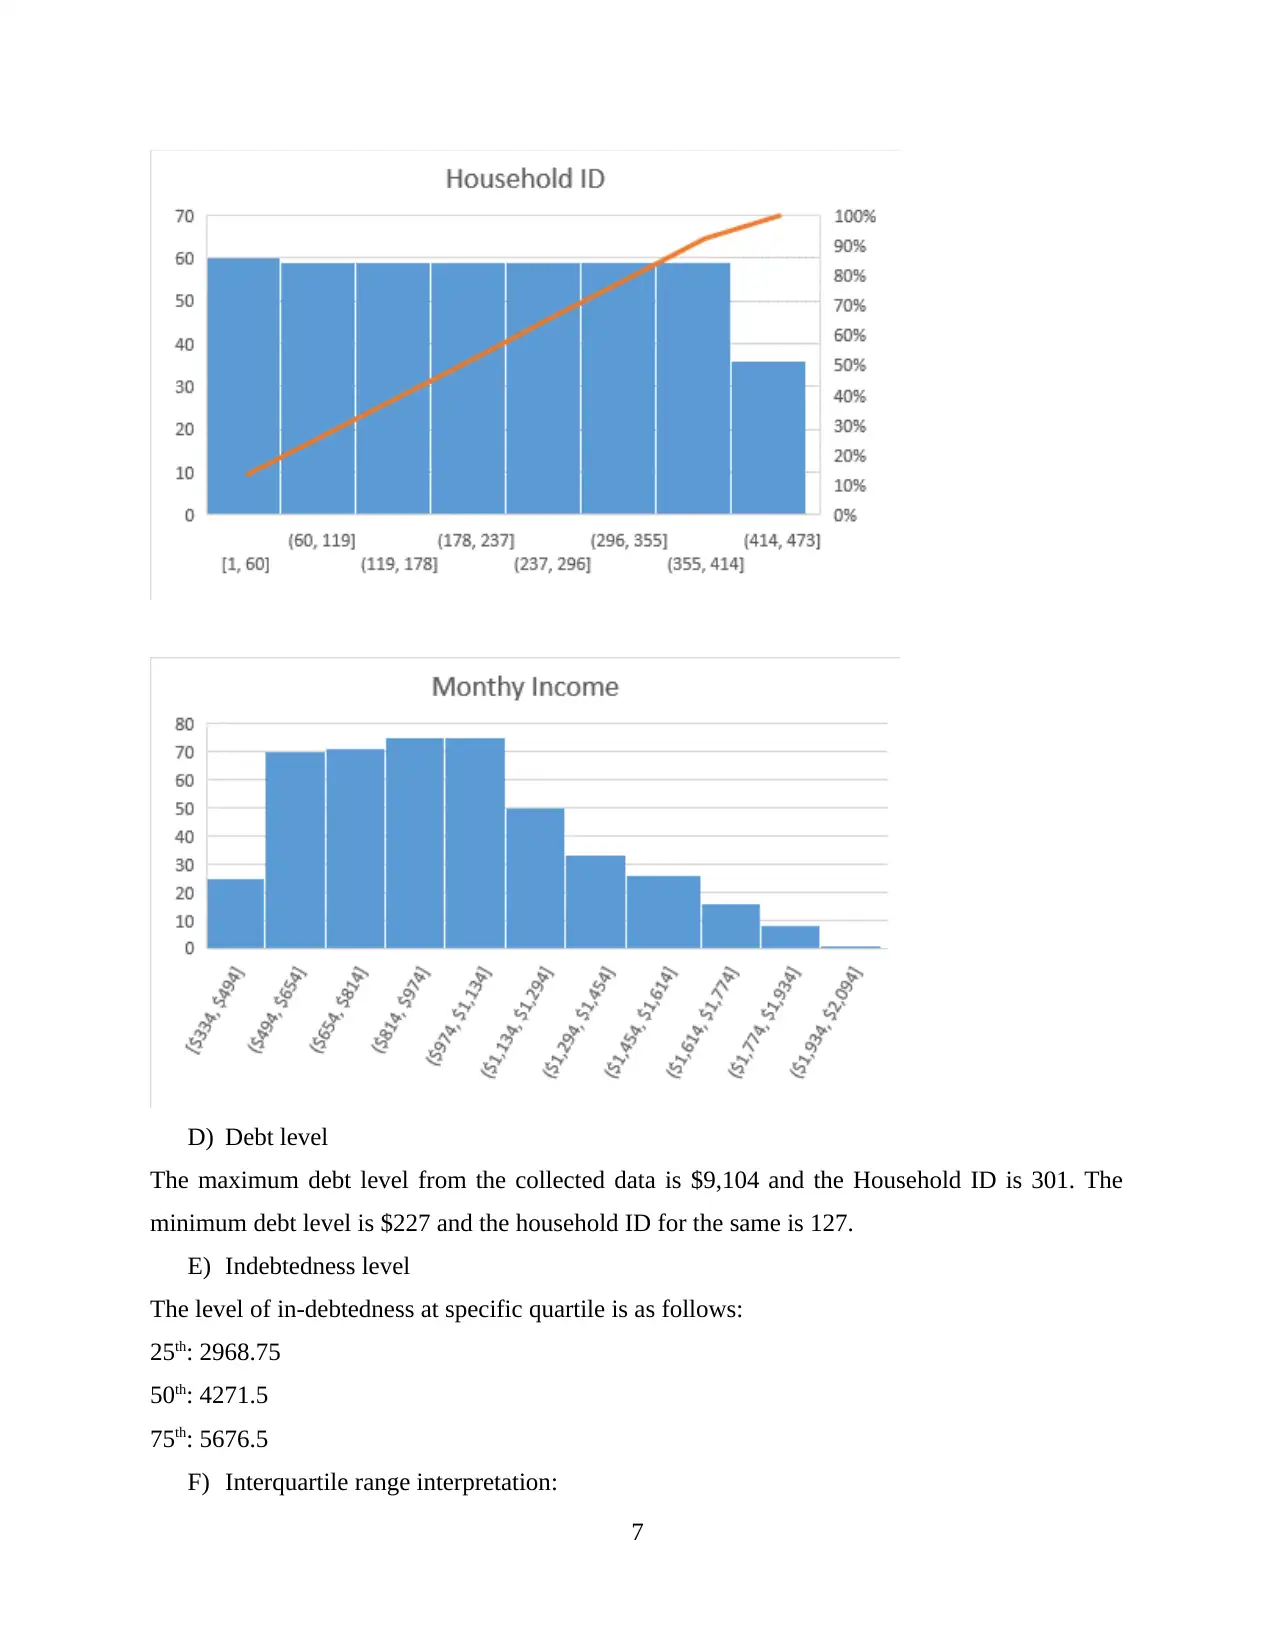
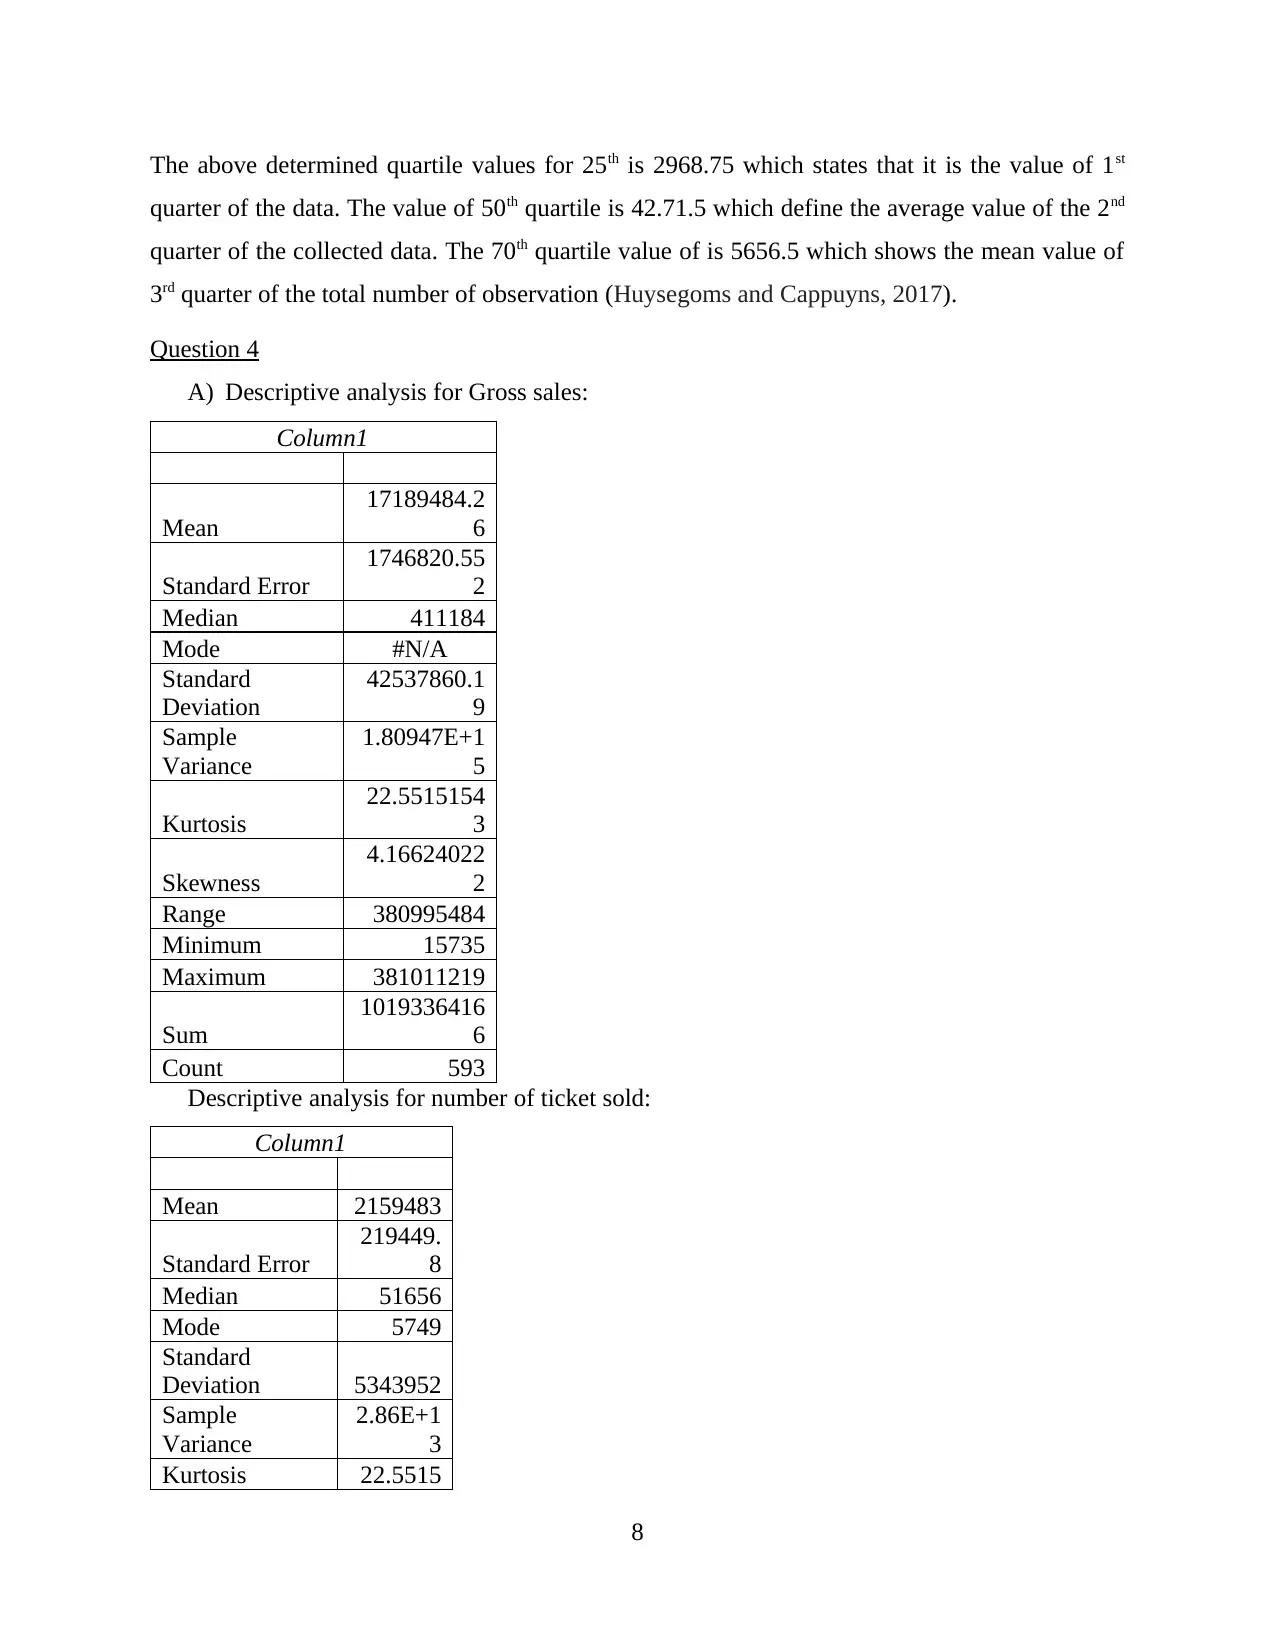
Homework Assignment
AI Summary
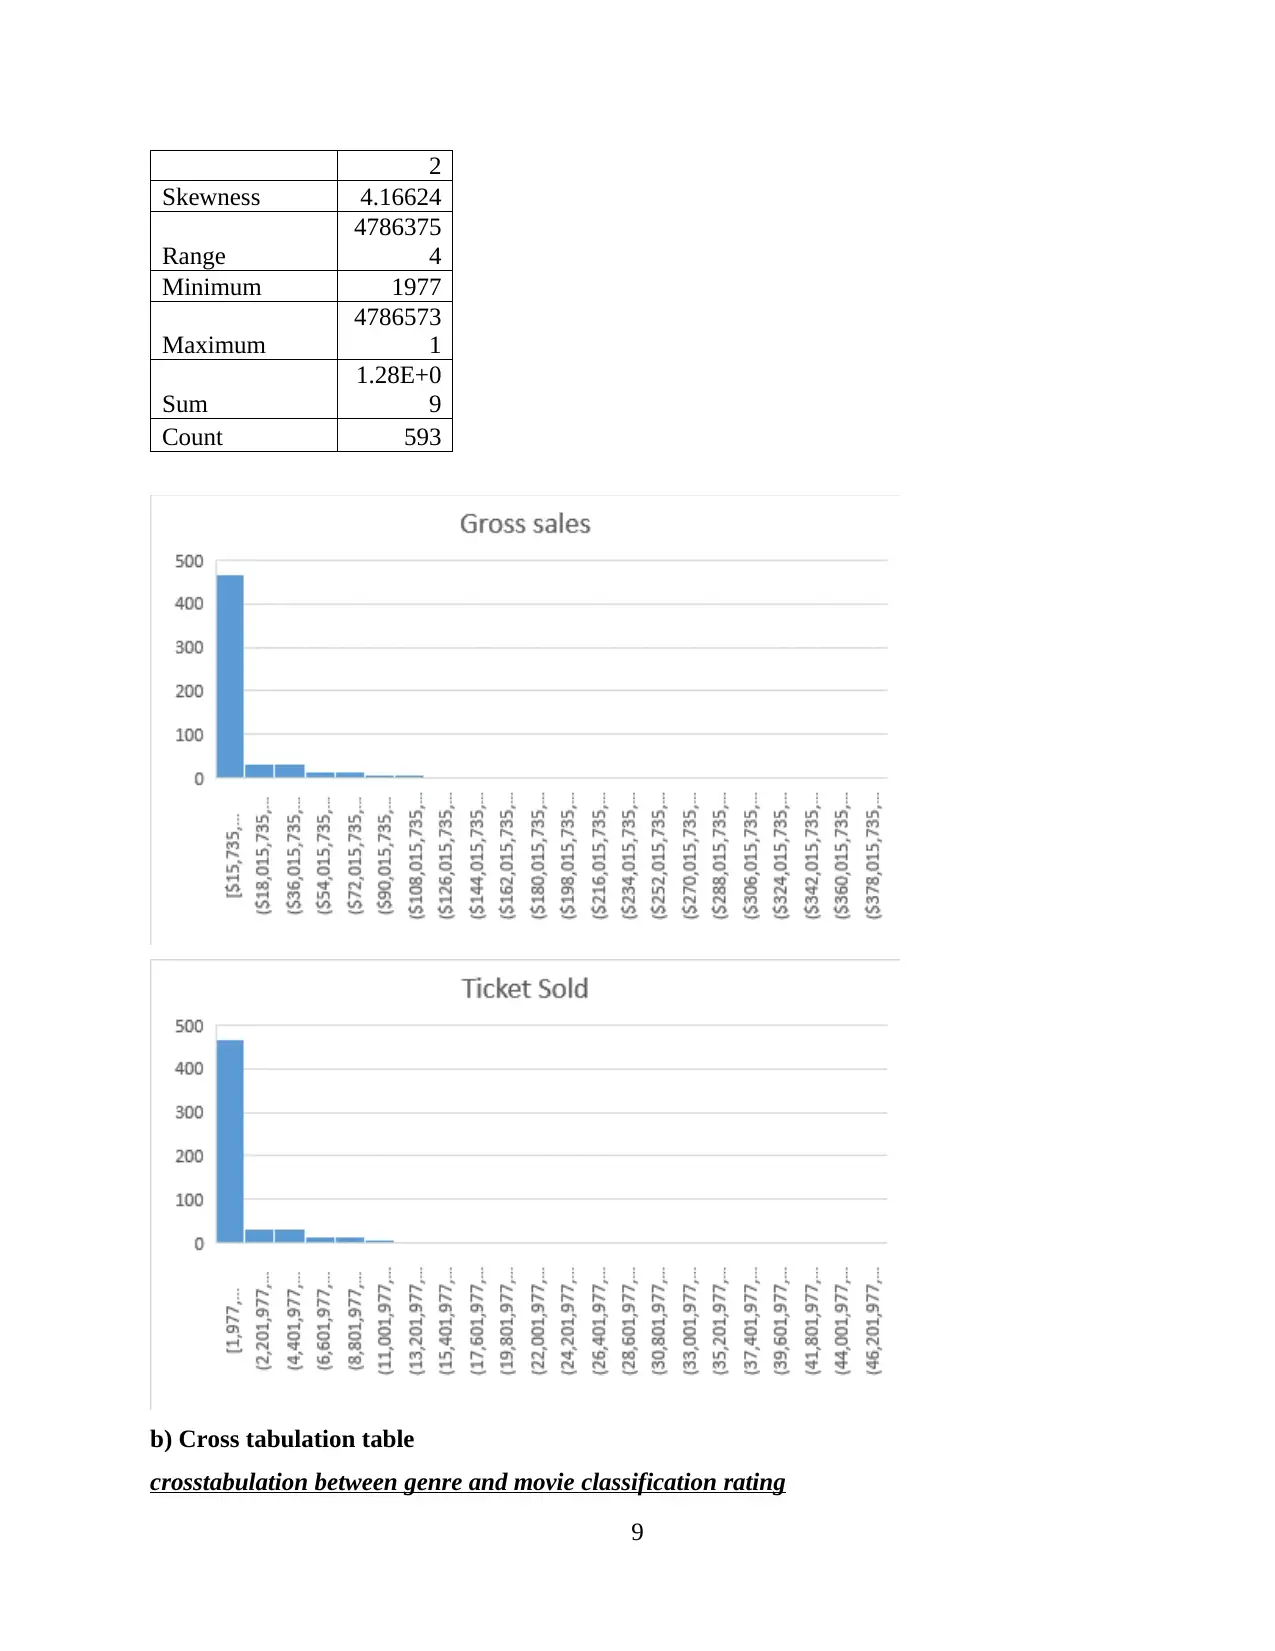
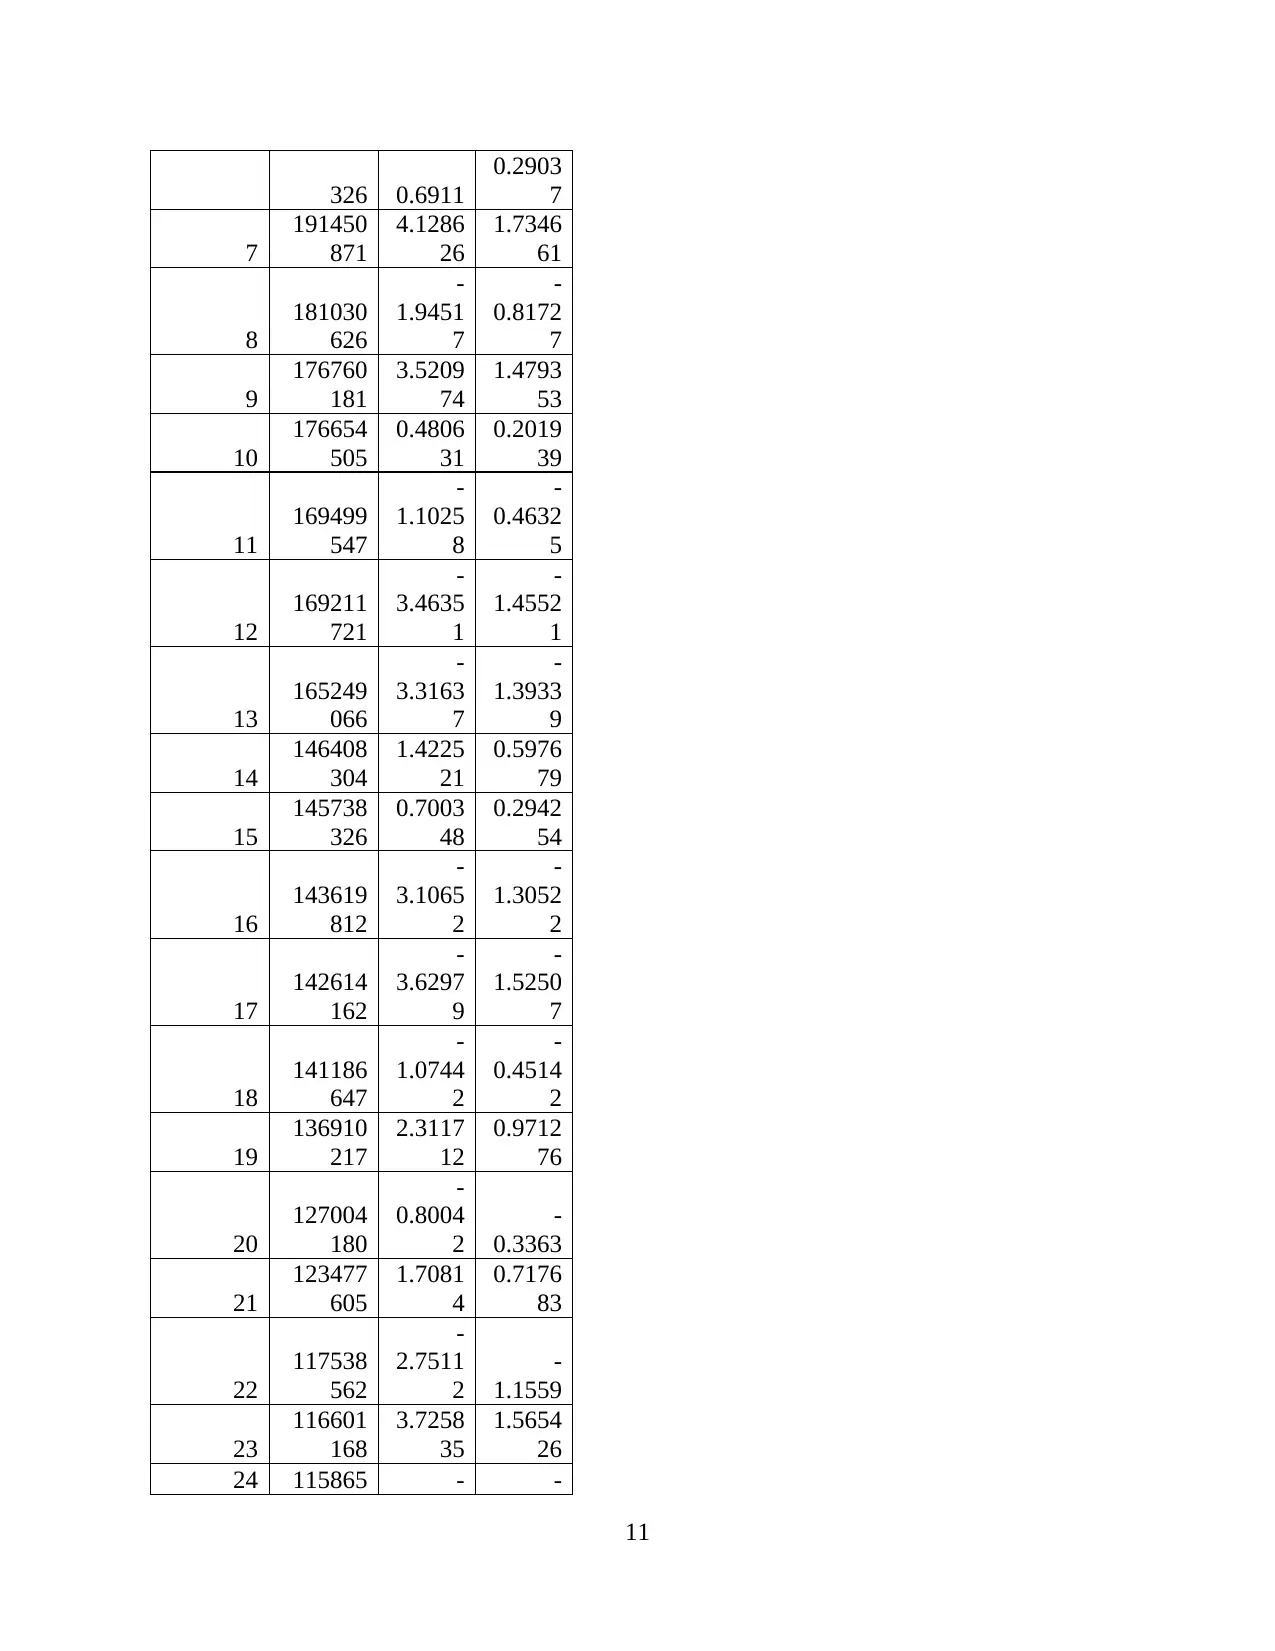
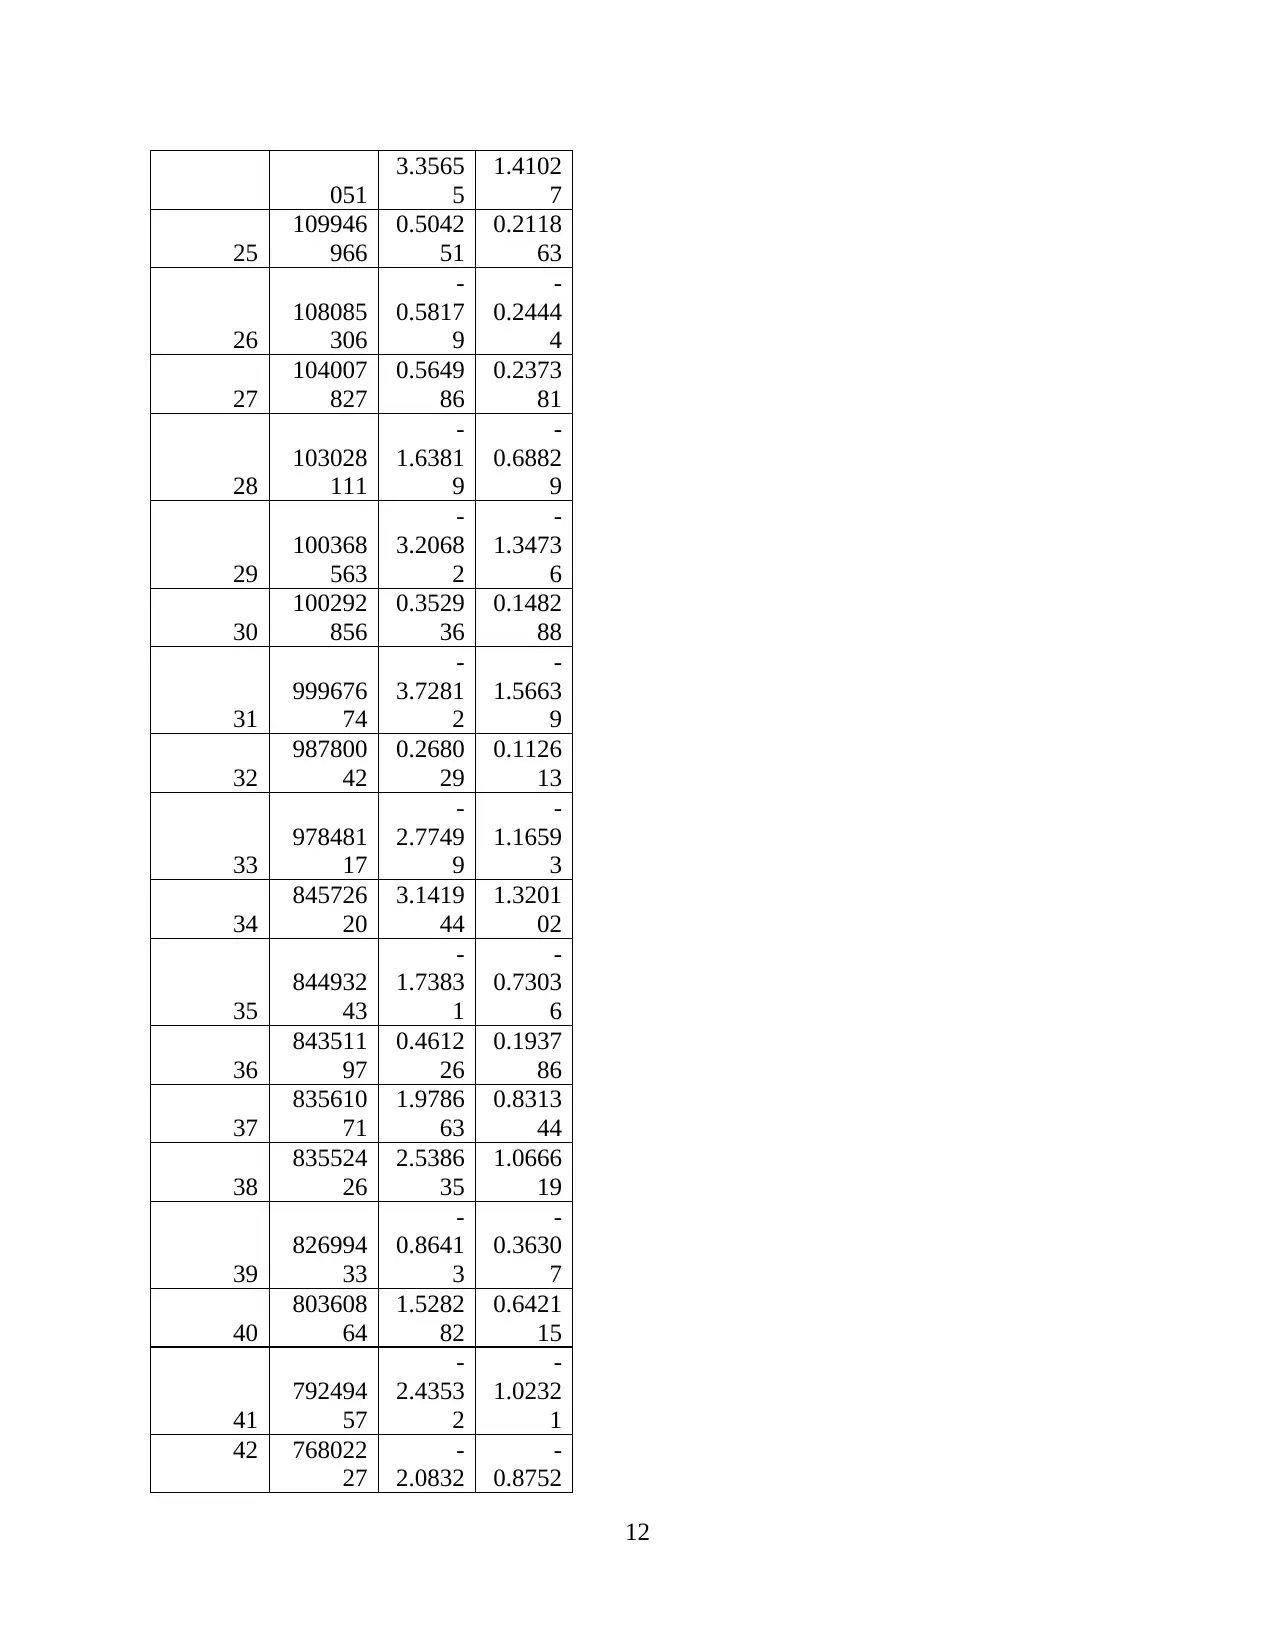
This document presents a comprehensive solution to a Business Analytics 1 assignment. It begins with an introduction to business analytics and its importance. The main body addresses four key questions, including breakeven point analysis, demonstrated through calculations and a one-way and two-way table. The assignment also covers data analysis techniques, such as descriptive statistics, identifying data types, and interpreting debt levels. Furthermore, it includes a cross-tabulation table and regression analysis to evaluate the relationship between variables, providing a thorough analysis of the provided data. The document includes the use of Excel for calculations and graph generation. The assignment also provides recommendations to students regarding the Covid-19 virus.
1 out of 43
Related Documents

Your All-in-One AI-Powered Toolkit for Academic Success.
+13062052269
info@desklib.com
Available 24*7 on WhatsApp / Email
![[object Object]](/_next/static/media/star-bottom.7253800d.svg)
Copyright © 2020–2026 A2Z Services. All Rights Reserved. Developed and managed by ZUCOL.