BSNS7162 Assignment 1: Statistical Analysis of Business Data

Verified

Added on  2022/09/14

|4
|892
|14
Homework Assignment
AI Summary
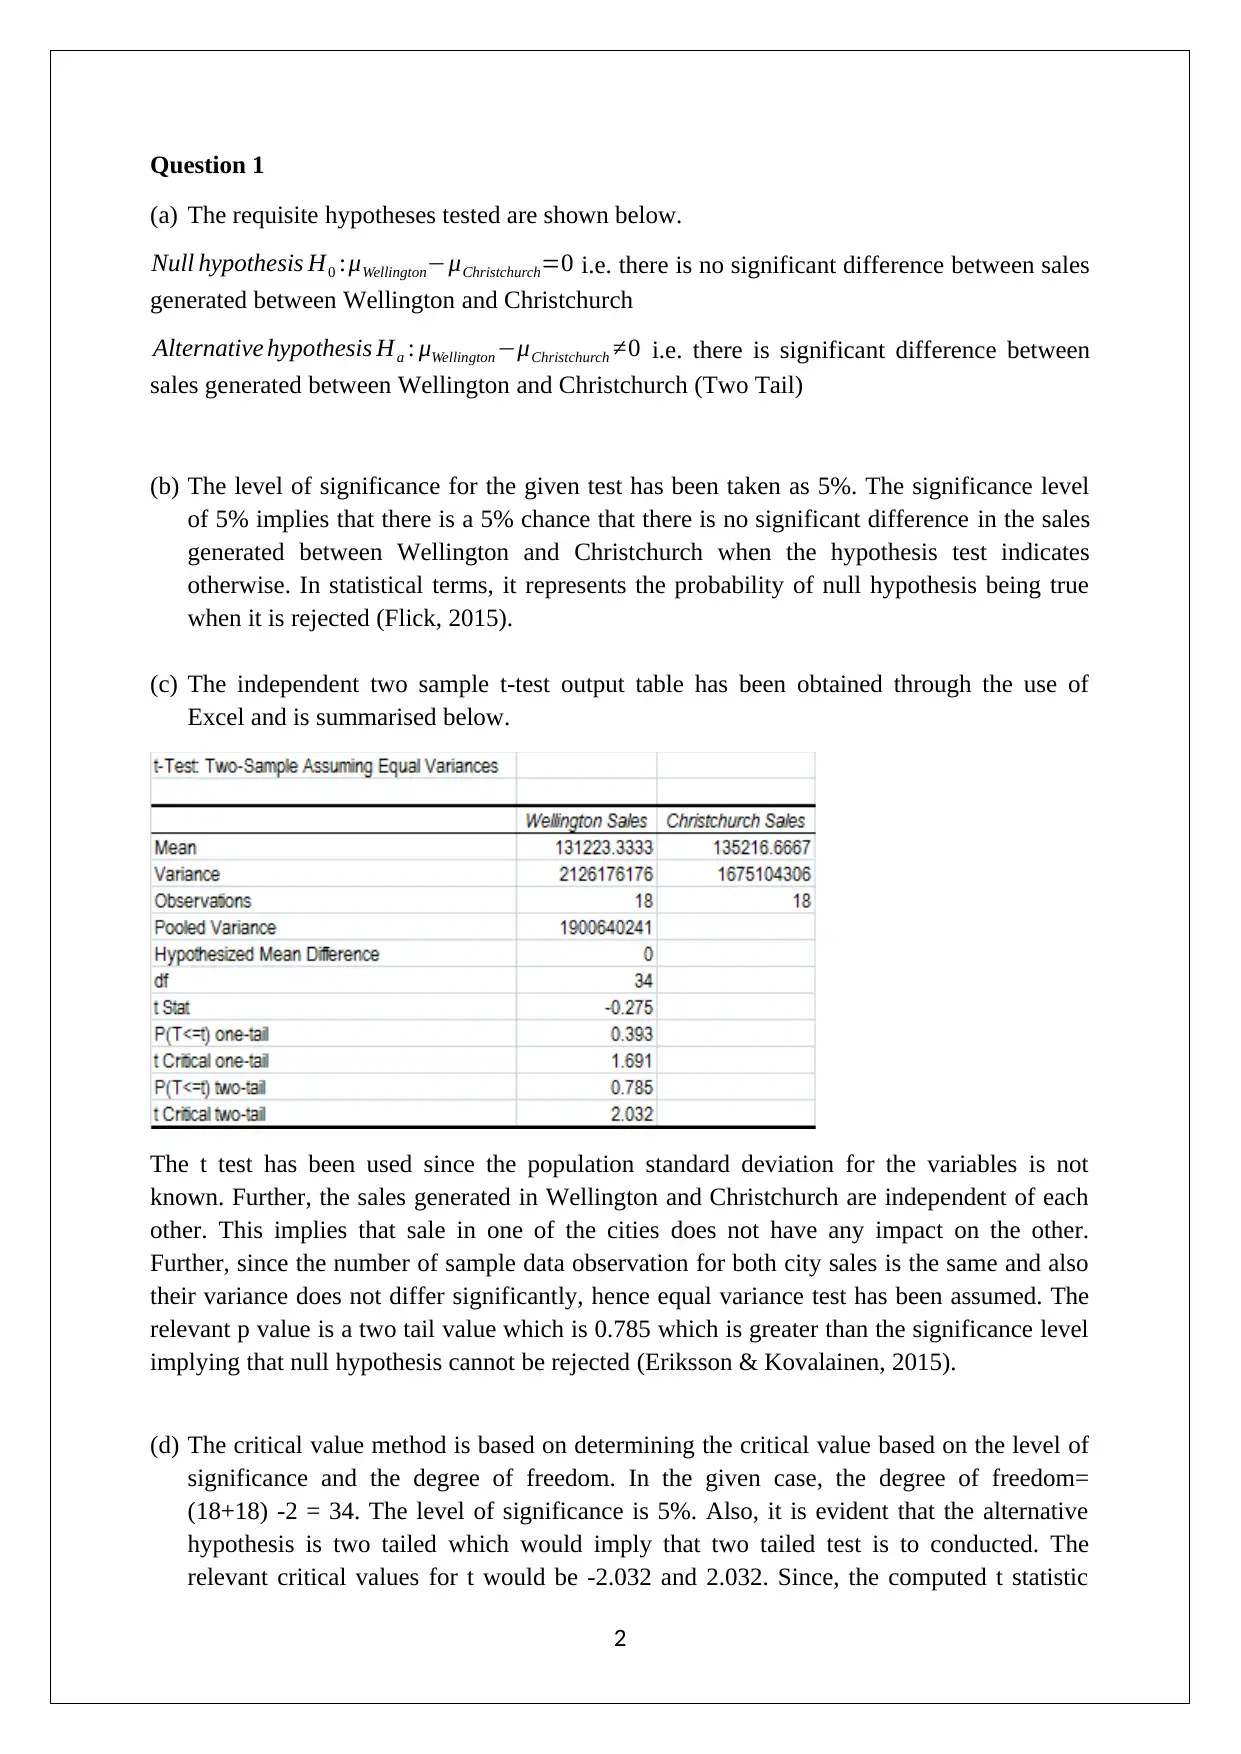
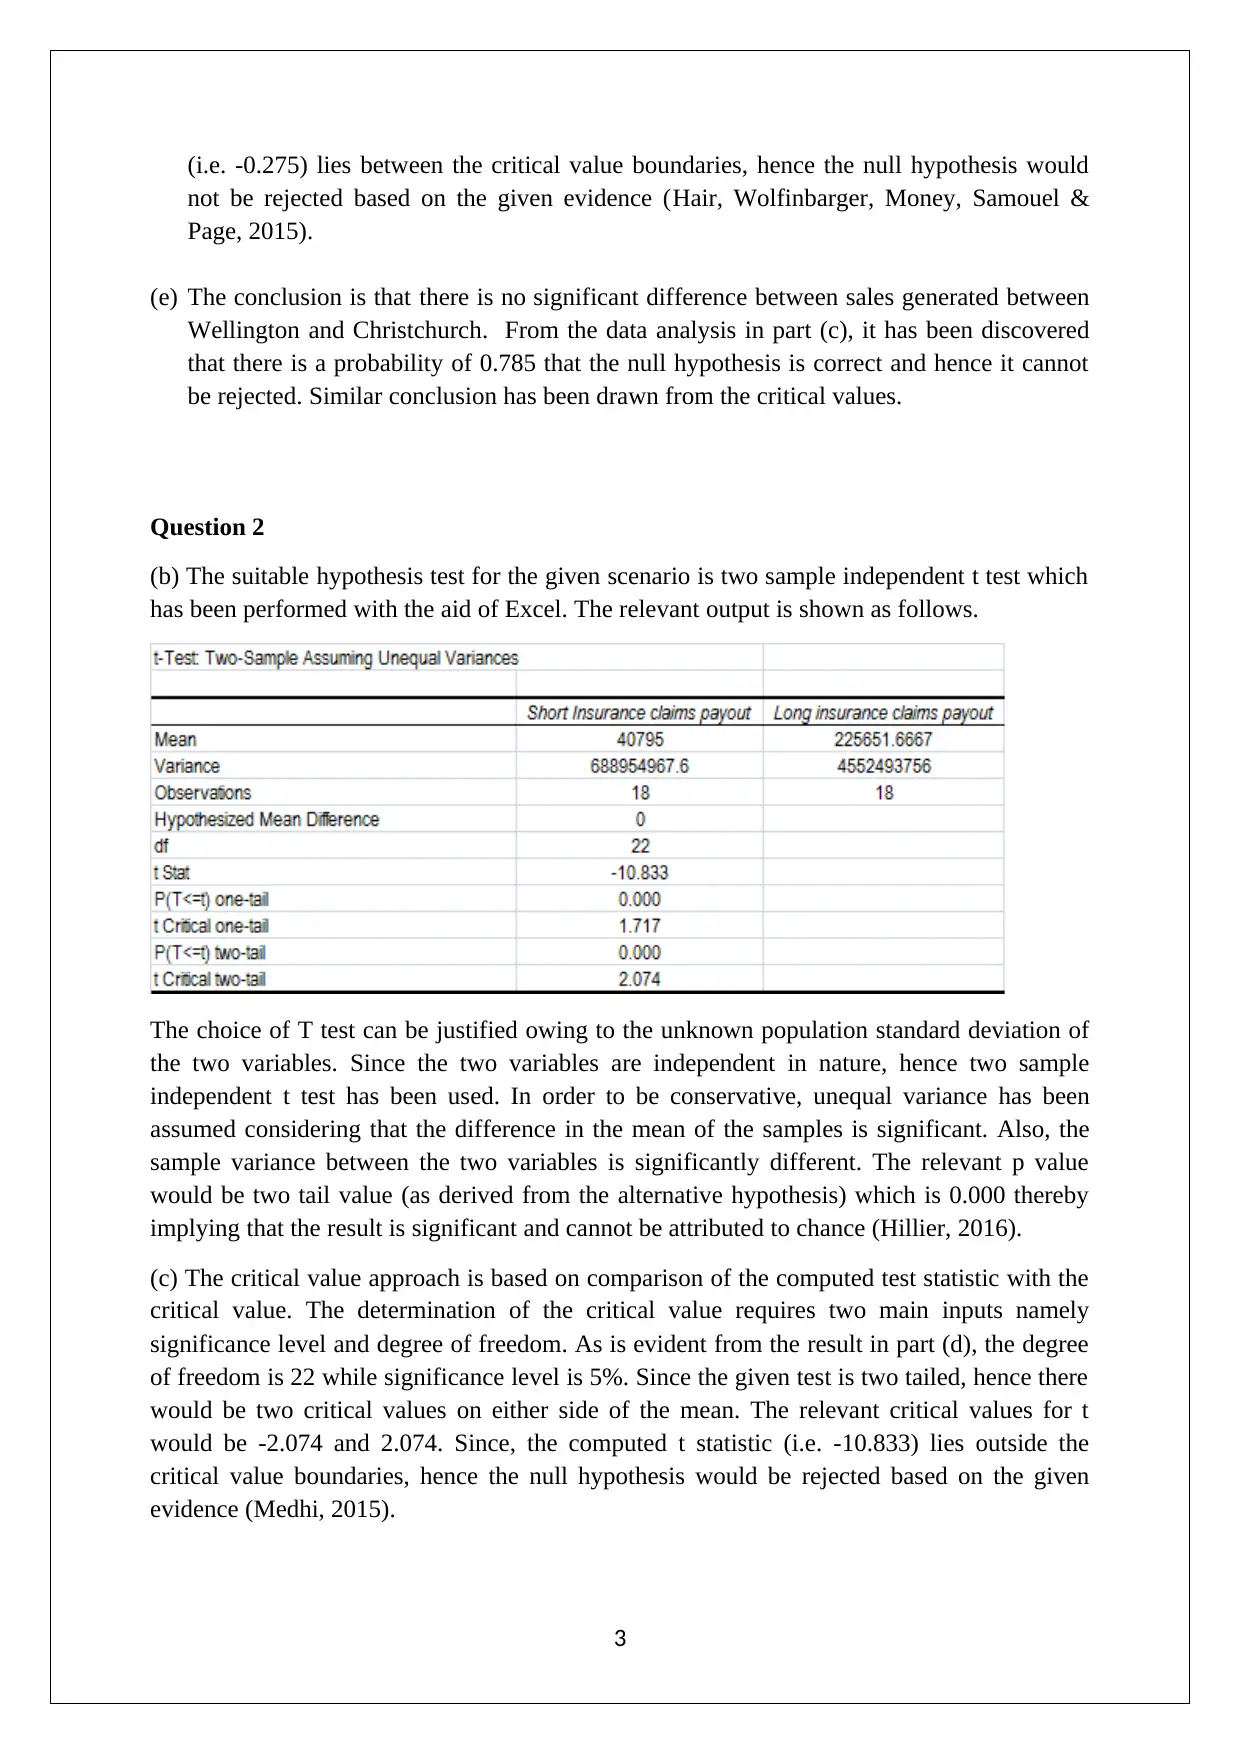
This assignment solution addresses statistical methods applied to business problems, focusing on hypothesis testing using t-tests. The solution includes two questions. Question 1 examines the difference in sales generated between Wellington and Christchurch using a two-sample independent t-test, analyzing p-values and critical values to determine the significance of the difference. The analysis concludes that there is no significant difference in sales between the two cities. Question 2 utilizes a two-sample independent t-test to analyze another scenario, determining the p-value and critical values. The solution provides detailed explanations of the tests, including the rationale behind the choice of t-tests, the use of Excel for calculations, and the interpretation of results, referencing statistical concepts such as significance levels and degrees of freedom. The assignment demonstrates the application of statistical techniques to make informed business decisions based on data analysis.
Document Page
BUSINESS ANALYTICS
STUDENT ID:
[Pick the date]
tabler-icon-diamond-filled.svg

Paraphrase This Document

Need a fresh take? Get an instant paraphrase of this document with our AI Paraphraser
Document Page
Question 1
(a) The requisite hypotheses tested are shown below.
Null hypothesis H0 :μWellingtonμChristchurch=0 i.e. there is no significant difference between sales
generated between Wellington and Christchurch
Alternative hypothesis Ha : μWellingtonμChristchurch 0 i.e. there is significant difference between
sales generated between Wellington and Christchurch (Two Tail)
(b) The level of significance for the given test has been taken as 5%. The significance level
of 5% implies that there is a 5% chance that there is no significant difference in the sales
generated between Wellington and Christchurch when the hypothesis test indicates
otherwise. In statistical terms, it represents the probability of null hypothesis being true
when it is rejected (Flick, 2015).
(c) The independent two sample t-test output table has been obtained through the use of
Excel and is summarised below.
The t test has been used since the population standard deviation for the variables is not
known. Further, the sales generated in Wellington and Christchurch are independent of each
other. This implies that sale in one of the cities does not have any impact on the other.
Further, since the number of sample data observation for both city sales is the same and also
their variance does not differ significantly, hence equal variance test has been assumed. The
relevant p value is a two tail value which is 0.785 which is greater than the significance level
implying that null hypothesis cannot be rejected (Eriksson & Kovalainen, 2015).
(d) The critical value method is based on determining the critical value based on the level of
significance and the degree of freedom. In the given case, the degree of freedom=
(18+18) -2 = 34. The level of significance is 5%. Also, it is evident that the alternative
hypothesis is two tailed which would imply that two tailed test is to conducted. The
relevant critical values for t would be -2.032 and 2.032. Since, the computed t statistic
2
Document Page
(i.e. -0.275) lies between the critical value boundaries, hence the null hypothesis would
not be rejected based on the given evidence (Hair, Wolfinbarger, Money, Samouel &
Page, 2015).
(e) The conclusion is that there is no significant difference between sales generated between
Wellington and Christchurch. From the data analysis in part (c), it has been discovered
that there is a probability of 0.785 that the null hypothesis is correct and hence it cannot
be rejected. Similar conclusion has been drawn from the critical values.
Question 2
(b) The suitable hypothesis test for the given scenario is two sample independent t test which
has been performed with the aid of Excel. The relevant output is shown as follows.
The choice of T test can be justified owing to the unknown population standard deviation of
the two variables. Since the two variables are independent in nature, hence two sample
independent t test has been used. In order to be conservative, unequal variance has been
assumed considering that the difference in the mean of the samples is significant. Also, the
sample variance between the two variables is significantly different. The relevant p value
would be two tail value (as derived from the alternative hypothesis) which is 0.000 thereby
implying that the result is significant and cannot be attributed to chance (Hillier, 2016).
(c) The critical value approach is based on comparison of the computed test statistic with the
critical value. The determination of the critical value requires two main inputs namely
significance level and degree of freedom. As is evident from the result in part (d), the degree
of freedom is 22 while significance level is 5%. Since the given test is two tailed, hence there
would be two critical values on either side of the mean. The relevant critical values for t
would be -2.074 and 2.074. Since, the computed t statistic (i.e. -10.833) lies outside the
critical value boundaries, hence the null hypothesis would be rejected based on the given
evidence (Medhi, 2015).
3
Document Page
References
Eriksson, P. & Kovalainen, A. (2015). Quantitative methods in business research (3rd ed.).
London: Sage Publications.
Flick, U. (2015). Introducing research methodology: A beginner's guide to doing a research
project (4th ed.). New York: Sage Publications.
Hair, J. F., Wolfinbarger, M., Money, A. H., Samouel, P., & Page, M. J. (2015). Essentials of
business research methods (2nd ed.). New York: Routledge.
Hillier, F. (2016). Introduction to Operations Research.(6th ed.). New York: McGraw Hill
Publications.
Medhi, J. (2015). Statistical Methods: An Introductory Text (4th ed.). Sydney: New Age
International.
4
chevron_up_icon
1 out of 4
circle_padding
hide_on_mobile
zoom_out_icon
[object Object]