Business Analytics Report: Analysis of Emerging Industry Segments
VerifiedAdded on 2020/02/18
|11
|2534
|66
Report
AI Summary
This report analyzes the emergence of three new industry segments—Cosmeceuticals, Nutricosmetics, and Nutraceuticals—in the Australian market, based on an end-user survey. The study examines product preferences across different states, finding Nutricosmetics as the most popular overall. It also explores consumer demographics, including gender, age, and income levels, to identify key trends. The research reveals the preferred forms of product consumption (beverage, food, pills) and communication channels (social media, email). Furthermore, it assesses consumer confidence and recommendation ratings, highlighting areas for improvement in product perception and marketing strategies. The report concludes with recommendations for producers to optimize their campaigns, build consumer confidence, and enhance product referral programs to capitalize on the growing wellness market in Australia.
Principles of Business Analytics
Name
Institution
Instructor
Date
Name
Institution
Instructor
Date
Paraphrase This Document
Need a fresh take? Get an instant paraphrase of this document with our AI Paraphraser
Table of Contents
Introduction...............................................................................................................................................3
Results.........................................................................................................................................................4
Understanding the industry segments....................................................................................................4
Product preference-New South Wales................................................................................................5
Product preference-Queensland..........................................................................................................5
Product preference-Western Australia...............................................................................................5
Product preference-South Australia...................................................................................................5
Product preference-Tasmania.............................................................................................................5
Product preference-Victoria...............................................................................................................5
Understanding the consumers................................................................................................................5
Gender versus Product Type...............................................................................................................5
Age band versus product type..............................................................................................................6
Form in which consumers would prefer.............................................................................................6
Channels for communicating with the consumers.............................................................................7
Amount willing to spend in a month..................................................................................................7
Understanding the potential markets and opportunities.........................................................................8
Confidence rating................................................................................................................................8
Recommendation rating......................................................................................................................9
Conclusion.................................................................................................................................................10
Recommendations.....................................................................................................................................10
References.................................................................................................................................................11
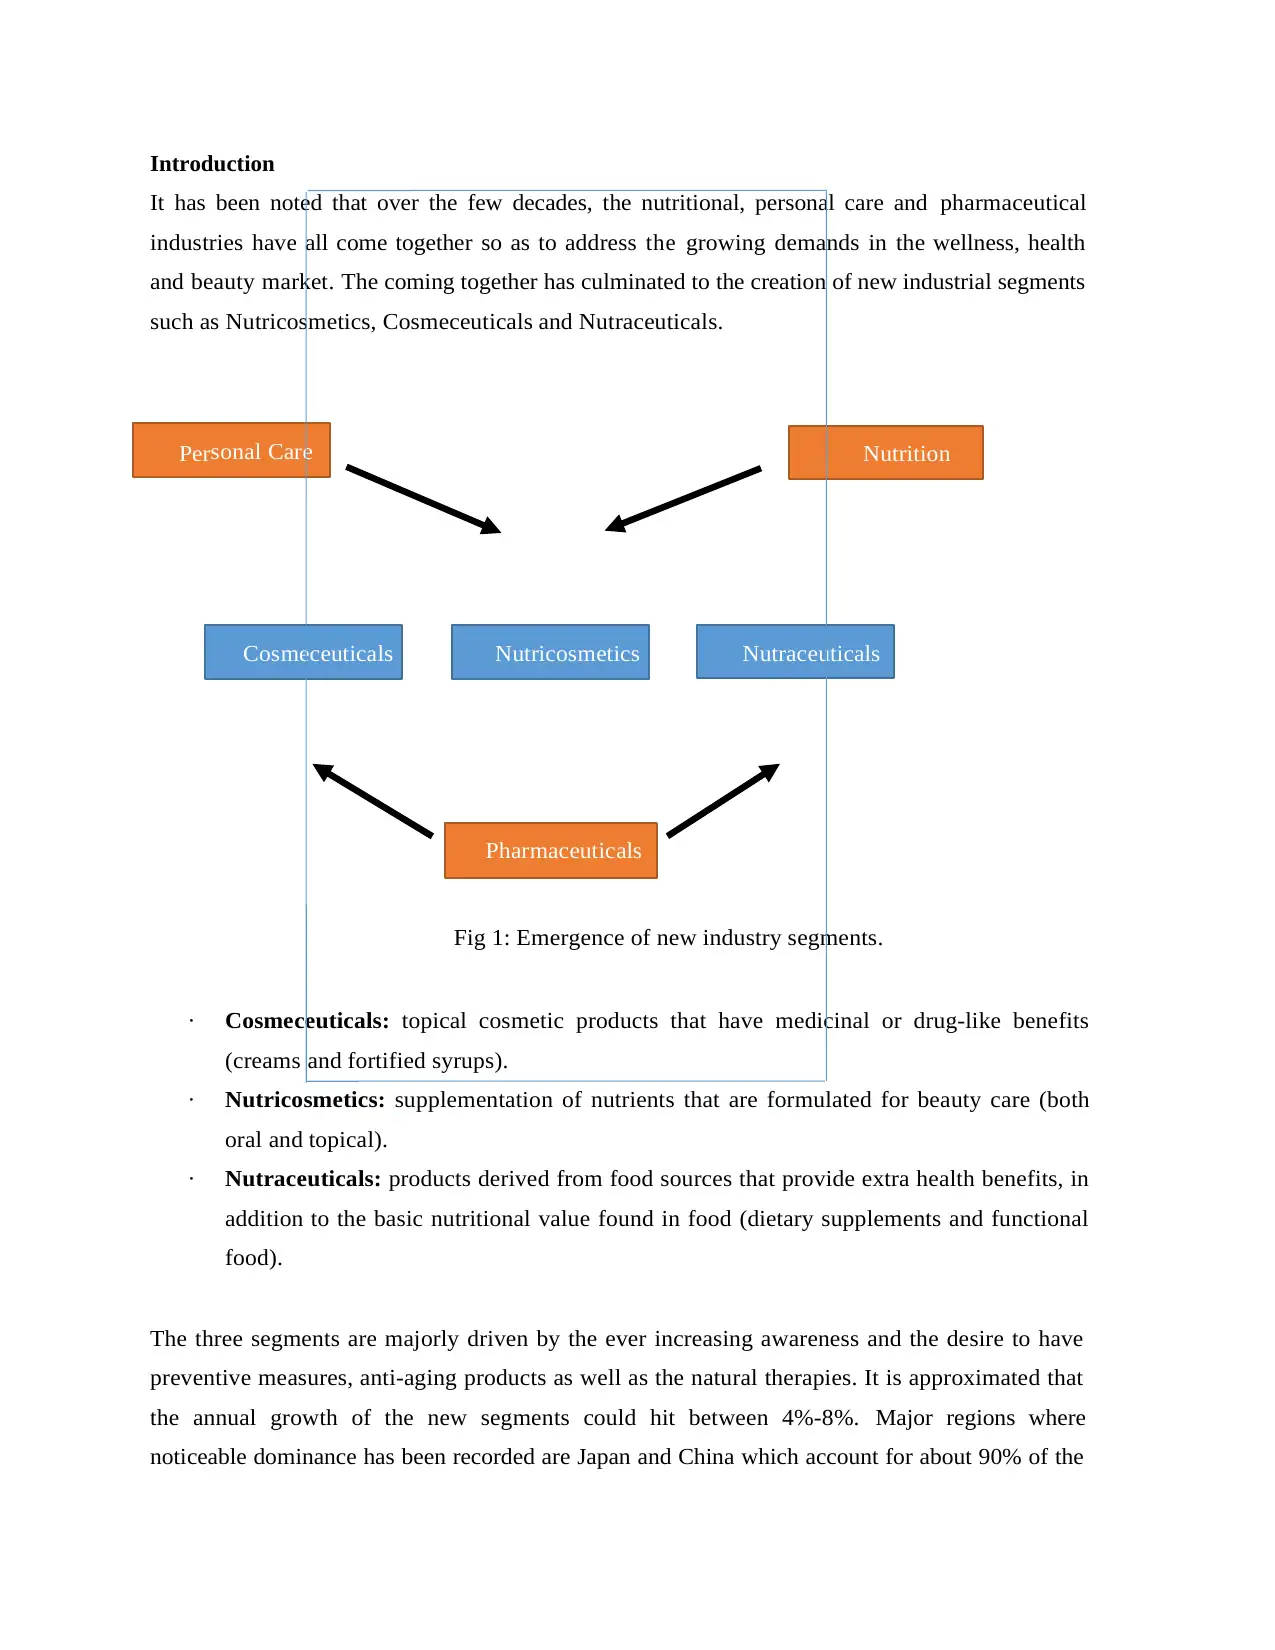
Introduction
It has been noted that over the few decades, the nutritional, personal care and pharmaceutical
industries have all come together so as to address the growing demands in the wellness, health
and beauty market. The coming together has culminated to the creation of new industrial segments
such as Nutricosmetics, Cosmeceuticals and Nutraceuticals.
Personal Care Nutrition
Cosmeceuticals Nutricosmetics Nutraceuticals
Pharmaceuticals
Fi g 1: Emergence of new i ndustry segments .
· Cosmeceuticals: topical cosmetic products that have medicinal or drug-like benefits
(creams and fortified syrups).
· Nutricosmetics: supplementation of nutrients that are formulated for beauty care (both
oral and topical).
· Nutraceuticals: products derived from food sources that provide extra health benefits, in
addition to the basic nutritional value found in food (dietary supplements and functional
food).
The three segments are majorly driven by the ever increasing awareness and the desire to have
preventive measures, anti-aging products as well as the natural therapies. It is approximated that
the annual growth of the new segments could hit between 4%-8%. Major regions where
noticeable dominance has been recorded are Japan and China which account for about 90% of the
⊘ This is a preview!⊘
Do you want full access?
Subscribe today to unlock all pages.
Trusted by 1+ million students worldwide
world sales. USA on the other hand has been noted to dominate the Nutraceutical industry with
approximately 45%.
The main aim of this paper was to analyze the emergence of the three segments in the Australian
market using an end-user survey that had been conducted. Two different business intelligence
analytic tools were employed to analyze the data. The two tools are;
SAP Lumira
Excel PowerPivot
Results
Understanding the industry segments
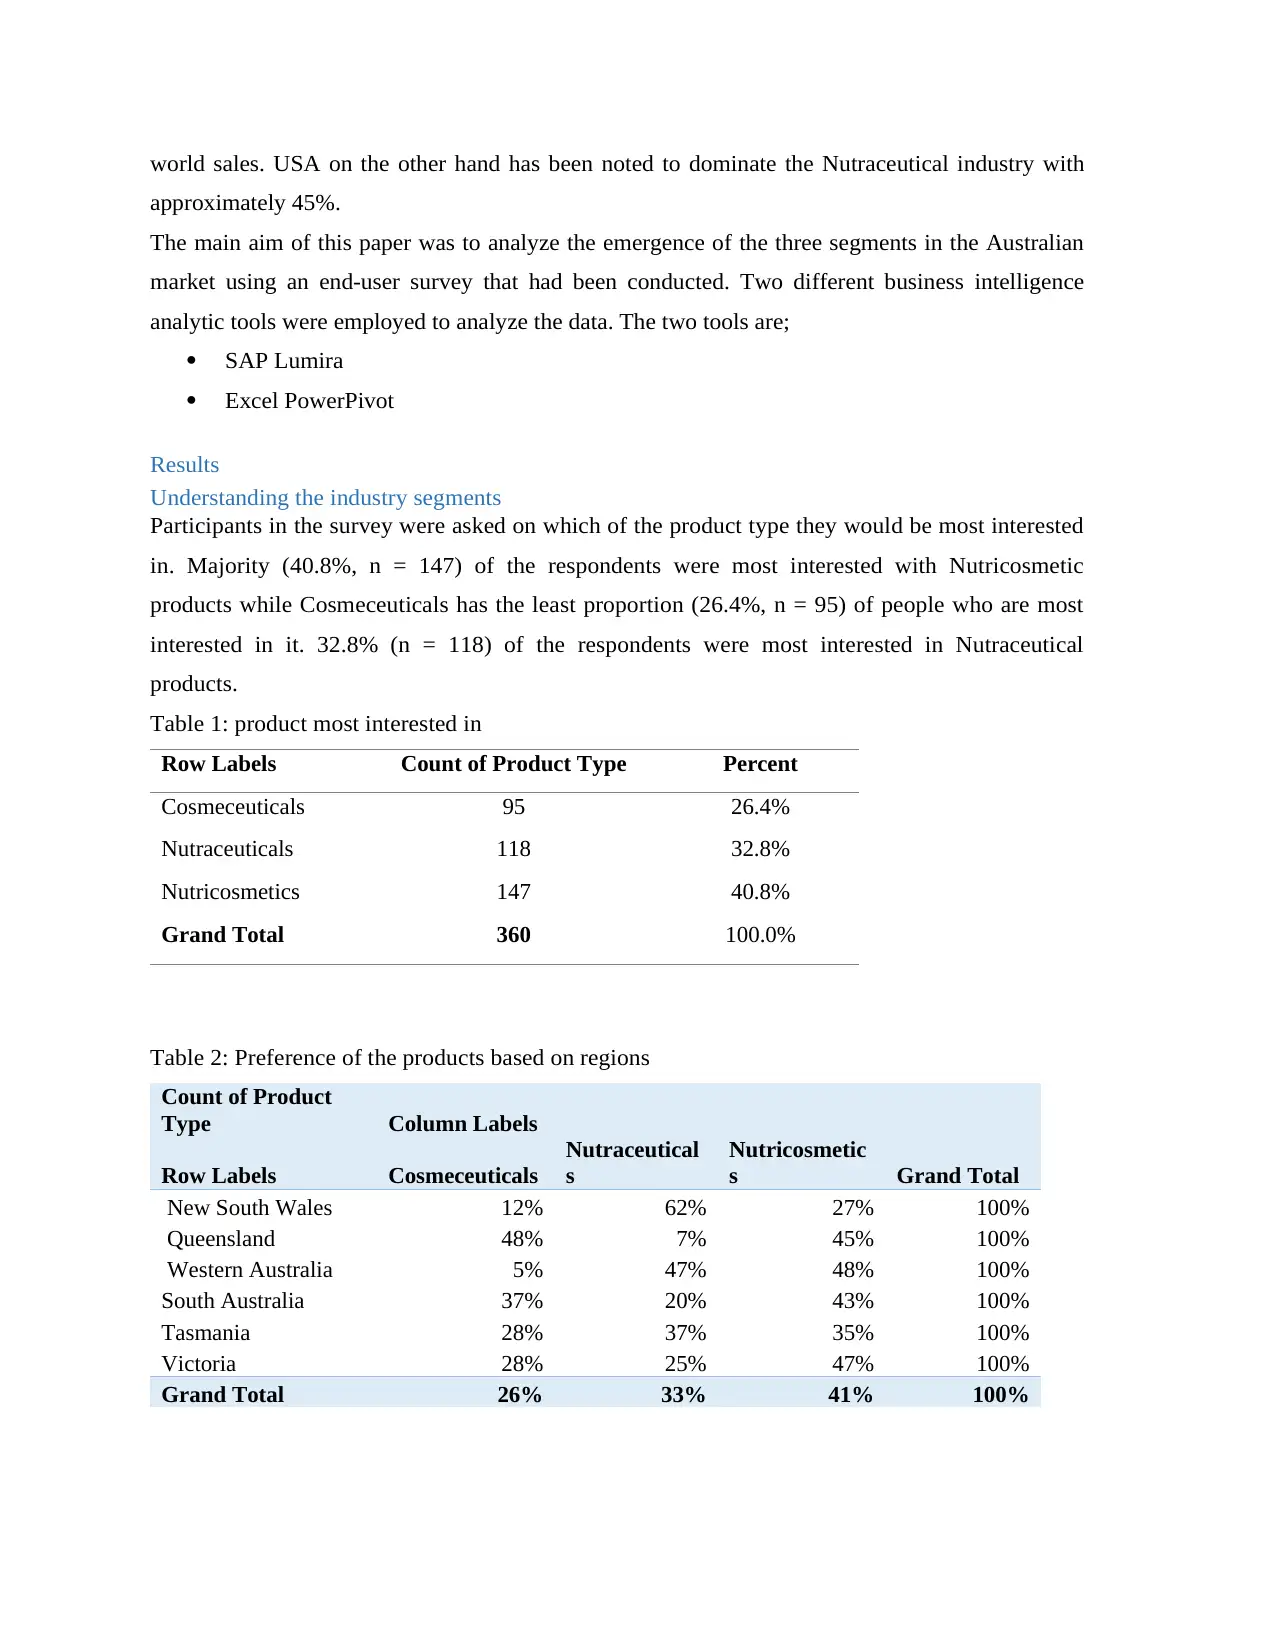
Participants in the survey were asked on which of the product type they would be most interested
in. Majority (40.8%, n = 147) of the respondents were most interested with Nutricosmetic
products while Cosmeceuticals has the least proportion (26.4%, n = 95) of people who are most
interested in it. 32.8% (n = 118) of the respondents were most interested in Nutraceutical
products.
Table 1: product most interested in
Row Labels Count of Product Type Percent
Cosmeceuticals 95 26.4%
Nutraceuticals 118 32.8%
Nutricosmetics 147 40.8%
Grand Total 360 100.0%
Table 2: Preference of the products based on regions
Count of Product
Type Column Labels
Row Labels Cosmeceuticals
Nutraceutical
s
Nutricosmetic
s Grand Total
New South Wales 12% 62% 27% 100%
Queensland 48% 7% 45% 100%
Western Australia 5% 47% 48% 100%
South Australia 37% 20% 43% 100%
Tasmania 28% 37% 35% 100%
Victoria 28% 25% 47% 100%
Grand Total 26% 33% 41% 100%
approximately 45%.
The main aim of this paper was to analyze the emergence of the three segments in the Australian
market using an end-user survey that had been conducted. Two different business intelligence
analytic tools were employed to analyze the data. The two tools are;
SAP Lumira
Excel PowerPivot
Results
Understanding the industry segments
Participants in the survey were asked on which of the product type they would be most interested
in. Majority (40.8%, n = 147) of the respondents were most interested with Nutricosmetic
products while Cosmeceuticals has the least proportion (26.4%, n = 95) of people who are most
interested in it. 32.8% (n = 118) of the respondents were most interested in Nutraceutical
products.
Table 1: product most interested in
Row Labels Count of Product Type Percent
Cosmeceuticals 95 26.4%
Nutraceuticals 118 32.8%
Nutricosmetics 147 40.8%
Grand Total 360 100.0%
Table 2: Preference of the products based on regions
Count of Product
Type Column Labels
Row Labels Cosmeceuticals
Nutraceutical
s
Nutricosmetic
s Grand Total
New South Wales 12% 62% 27% 100%
Queensland 48% 7% 45% 100%
Western Australia 5% 47% 48% 100%
South Australia 37% 20% 43% 100%
Tasmania 28% 37% 35% 100%
Victoria 28% 25% 47% 100%
Grand Total 26% 33% 41% 100%
Paraphrase This Document
Need a fresh take? Get an instant paraphrase of this document with our AI Paraphraser
Product preference-New South Wales
In New South Wales state, most respondents (62%, n = 37) from this state said to prefer
Nutraceutical products. Cosmeceutical products was the least preferred (12%, n = 7) among the
respondents from this state. 27% (n = 16) said to prefer Nutricosmetic products the most.
Product preference-Queensland
Unlike in New South Wales state, most respondents (48%, n = 29) from Queensland said to prefer
Cosmeceutical products. Nutraceutical products was the least preferred (7%, n = 4) among the
respondents from this state. 45% (n = 27) said to prefer Nutricosmetic products the most.
Product preference-Western Australia
In the Western Australia state, most respondents (48%, n = 29) said to prefer Nutricosmetic
products. Cosmeceutical products was the least preferred (5%, n = 3) among the respondents from
this state. 48% (n = 28) said to prefer Nutraceutical products the most.
Product preference-South Australia
Just like in Western Australia, most respondents (43%, n = 26) said to prefer Nutricosmetic
products. Cosmeceutical products had the second highest proportion of people who prefer it most
(37%) while Nutraceutical products had the least proportion of people who prefer it most (20%).
Product preference-Tasmania
In Western Australia, most respondents (37%) said to prefer Nutraceutical products followed by
35% who said to prefer Nutricosmetic products most while 28% said to prefer Cosmeceutical
products.
Product preference-Victoria
Just like in South Australia, most respondents (47%, n = 28) said to prefer Nutricosmetic
products. Cosmeceutical products had the second highest proportion of people who prefer it most
(28%) while Nutraceutical products had the least proportion of people who prefer it most (25%).
Understanding the consumers
Gender versus Product Type
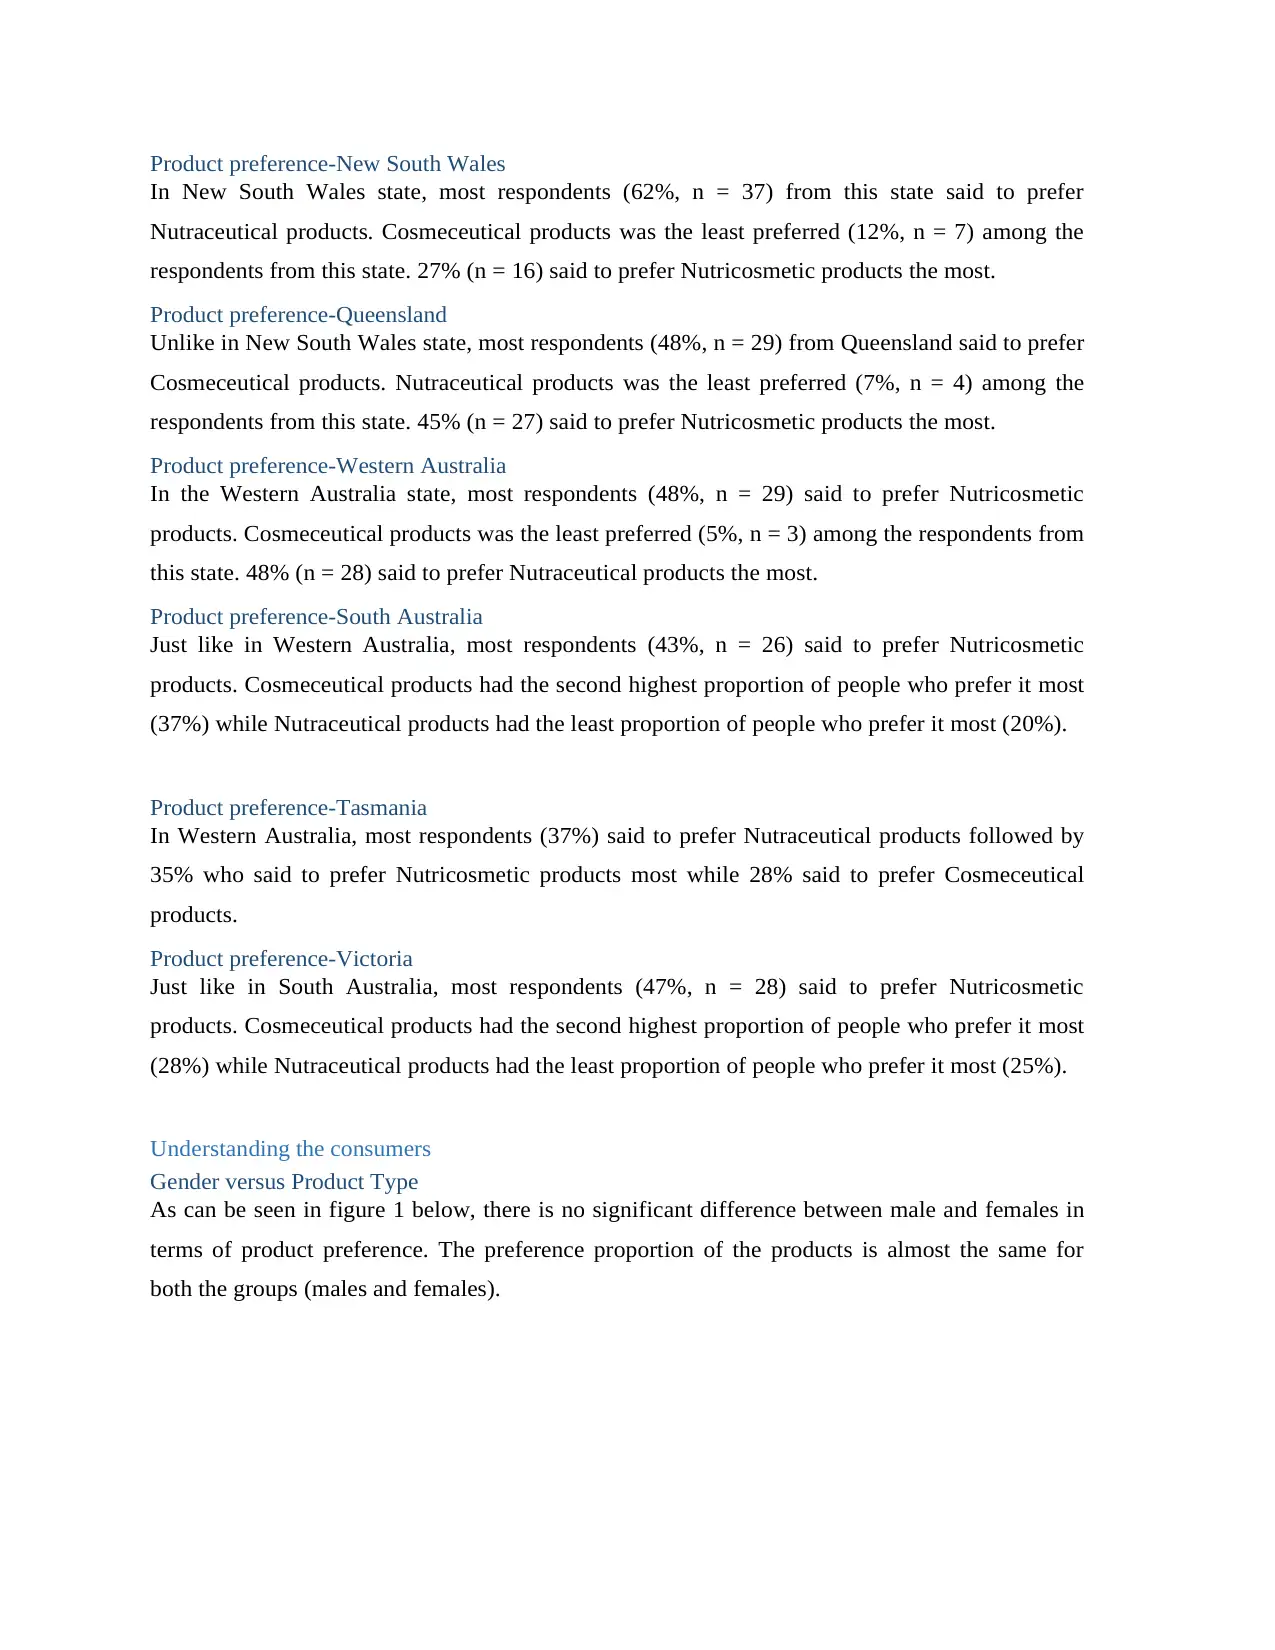
As can be seen in figure 1 below, there is no significant difference between male and females in
terms of product preference. The preference proportion of the products is almost the same for
both the groups (males and females).
In New South Wales state, most respondents (62%, n = 37) from this state said to prefer
Nutraceutical products. Cosmeceutical products was the least preferred (12%, n = 7) among the
respondents from this state. 27% (n = 16) said to prefer Nutricosmetic products the most.
Product preference-Queensland
Unlike in New South Wales state, most respondents (48%, n = 29) from Queensland said to prefer
Cosmeceutical products. Nutraceutical products was the least preferred (7%, n = 4) among the
respondents from this state. 45% (n = 27) said to prefer Nutricosmetic products the most.
Product preference-Western Australia
In the Western Australia state, most respondents (48%, n = 29) said to prefer Nutricosmetic
products. Cosmeceutical products was the least preferred (5%, n = 3) among the respondents from
this state. 48% (n = 28) said to prefer Nutraceutical products the most.
Product preference-South Australia
Just like in Western Australia, most respondents (43%, n = 26) said to prefer Nutricosmetic
products. Cosmeceutical products had the second highest proportion of people who prefer it most
(37%) while Nutraceutical products had the least proportion of people who prefer it most (20%).
Product preference-Tasmania
In Western Australia, most respondents (37%) said to prefer Nutraceutical products followed by
35% who said to prefer Nutricosmetic products most while 28% said to prefer Cosmeceutical
products.
Product preference-Victoria
Just like in South Australia, most respondents (47%, n = 28) said to prefer Nutricosmetic
products. Cosmeceutical products had the second highest proportion of people who prefer it most
(28%) while Nutraceutical products had the least proportion of people who prefer it most (25%).
Understanding the consumers
Gender versus Product Type
As can be seen in figure 1 below, there is no significant difference between male and females in
terms of product preference. The preference proportion of the products is almost the same for
both the groups (males and females).
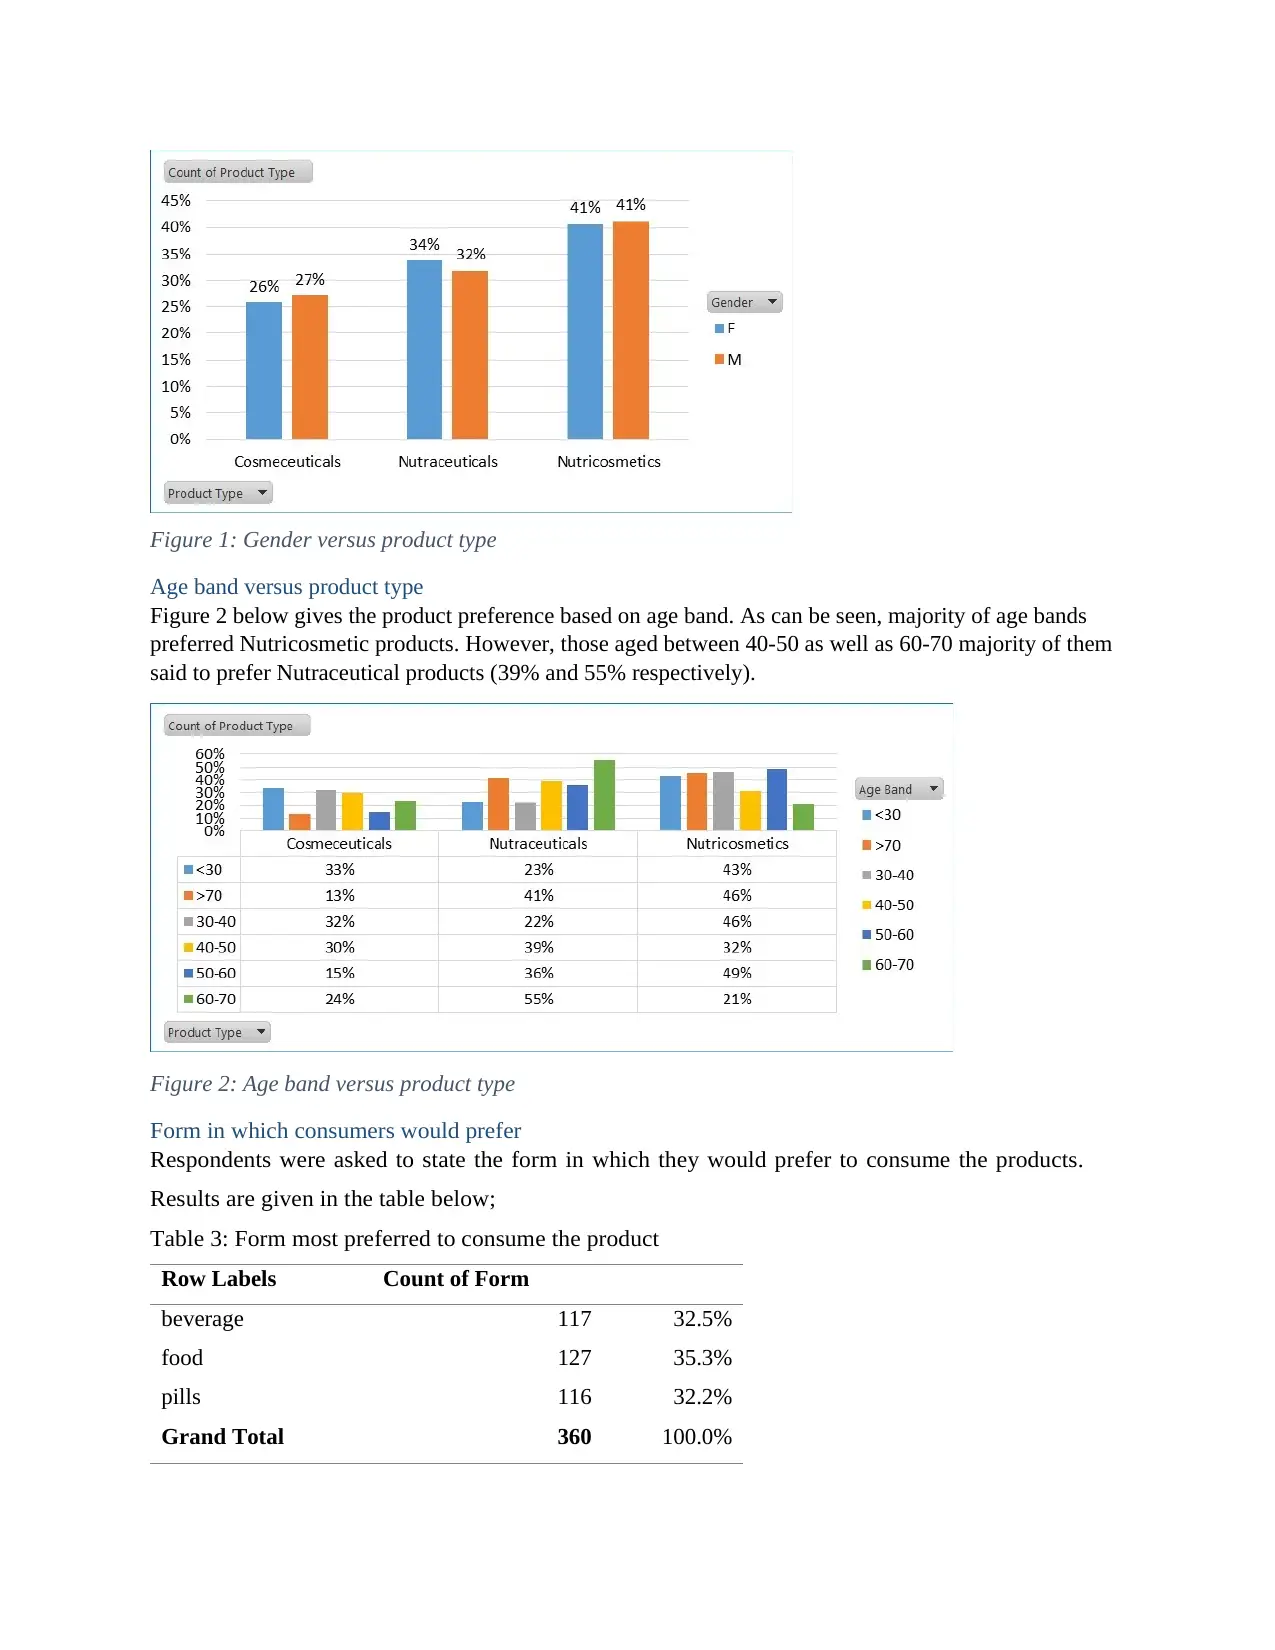
Figure 1: Gender versus product type
Age band versus product type
Figure 2 below gives the product preference based on age band. As can be seen, majority of age bands
preferred Nutricosmetic products. However, those aged between 40-50 as well as 60-70 majority of them
said to prefer Nutraceutical products (39% and 55% respectively).
Figure 2: Age band versus product type
Form in which consumers would prefer
Respondents were asked to state the form in which they would prefer to consume the products.
Results are given in the table below;
Table 3: Form most preferred to consume the product
Row Labels Count of Form
beverage 117 32.5%
food 127 35.3%
pills 116 32.2%
Grand Total 360 100.0%
⊘ This is a preview!⊘
Do you want full access?
Subscribe today to unlock all pages.
Trusted by 1+ million students worldwide
As can be seen, majority (35.3%, n = 127) would prefer to consume the products as food, 32.5%
(n = 117) would prefer to consume it as beverage while the remaining 32.2% (n = 116) would
prefer to consume it as pills.
Channels for communicating with the consumers
Social media is the most preferred channel of contacting the consumers (41%, n = 147), followed
by email (36%, n = 130) while post was the least preferred (23%, n = 83). It is important to note
that the channel preference for both males and females was not significantly different.
Table 4: Channel preference
Count of Channel Column Labels
Row Labels F M Grand Total
Email 19% 17% 36%
Post 11% 12% 23%
Social Media 23% 18% 41%
Grand Total 53% 47% 100%
Amount willing to spend in a month
Majority (63.3%) of the respondents said to be willing to spend between 50-100 dollars on the
products every month. 9.4% (n = 34) of the respondents are willing to spend more than 100
dollars while 27.2% (n = 98) are willing to spend less than 50 dollars a month.
Table 5: Amount in dollars respondents willing to spend in a month
Row Labels Count of Monthly ($) Percent
<50 98 27.2%
50-100 228 63.3%
>100 34 9.4%
Grand Total 360 100.0%
Table 6 provides the income levels of the respondents versus the product preference. As can be
seen, majority (41.6%) of those who earn less than $50,000 would prefer Nutracutical products
the most. See table 6 for more results.
Table 6: Income level versus product preference
Count of Product
Type
Column Labels
Row Labels Cosmeceuticals Nutraceutical
s
Nutricosmetic
s
Grand Total
< 50,000 26.0% 41.6% 32.5% 100.0%
50,000-70,000 27.2% 31.1% 41.7% 100.0%
Paraphrase This Document
Need a fresh take? Get an instant paraphrase of this document with our AI Paraphraser
70,000-90,000 23.8% 29.4% 46.9% 100.0%
> 100,000 35.1% 32.4% 32.4% 100.0%
Grand Total 26.4% 32.8% 40.8% 100.0%
Understanding the potential markets and opportunities
Confidence rating
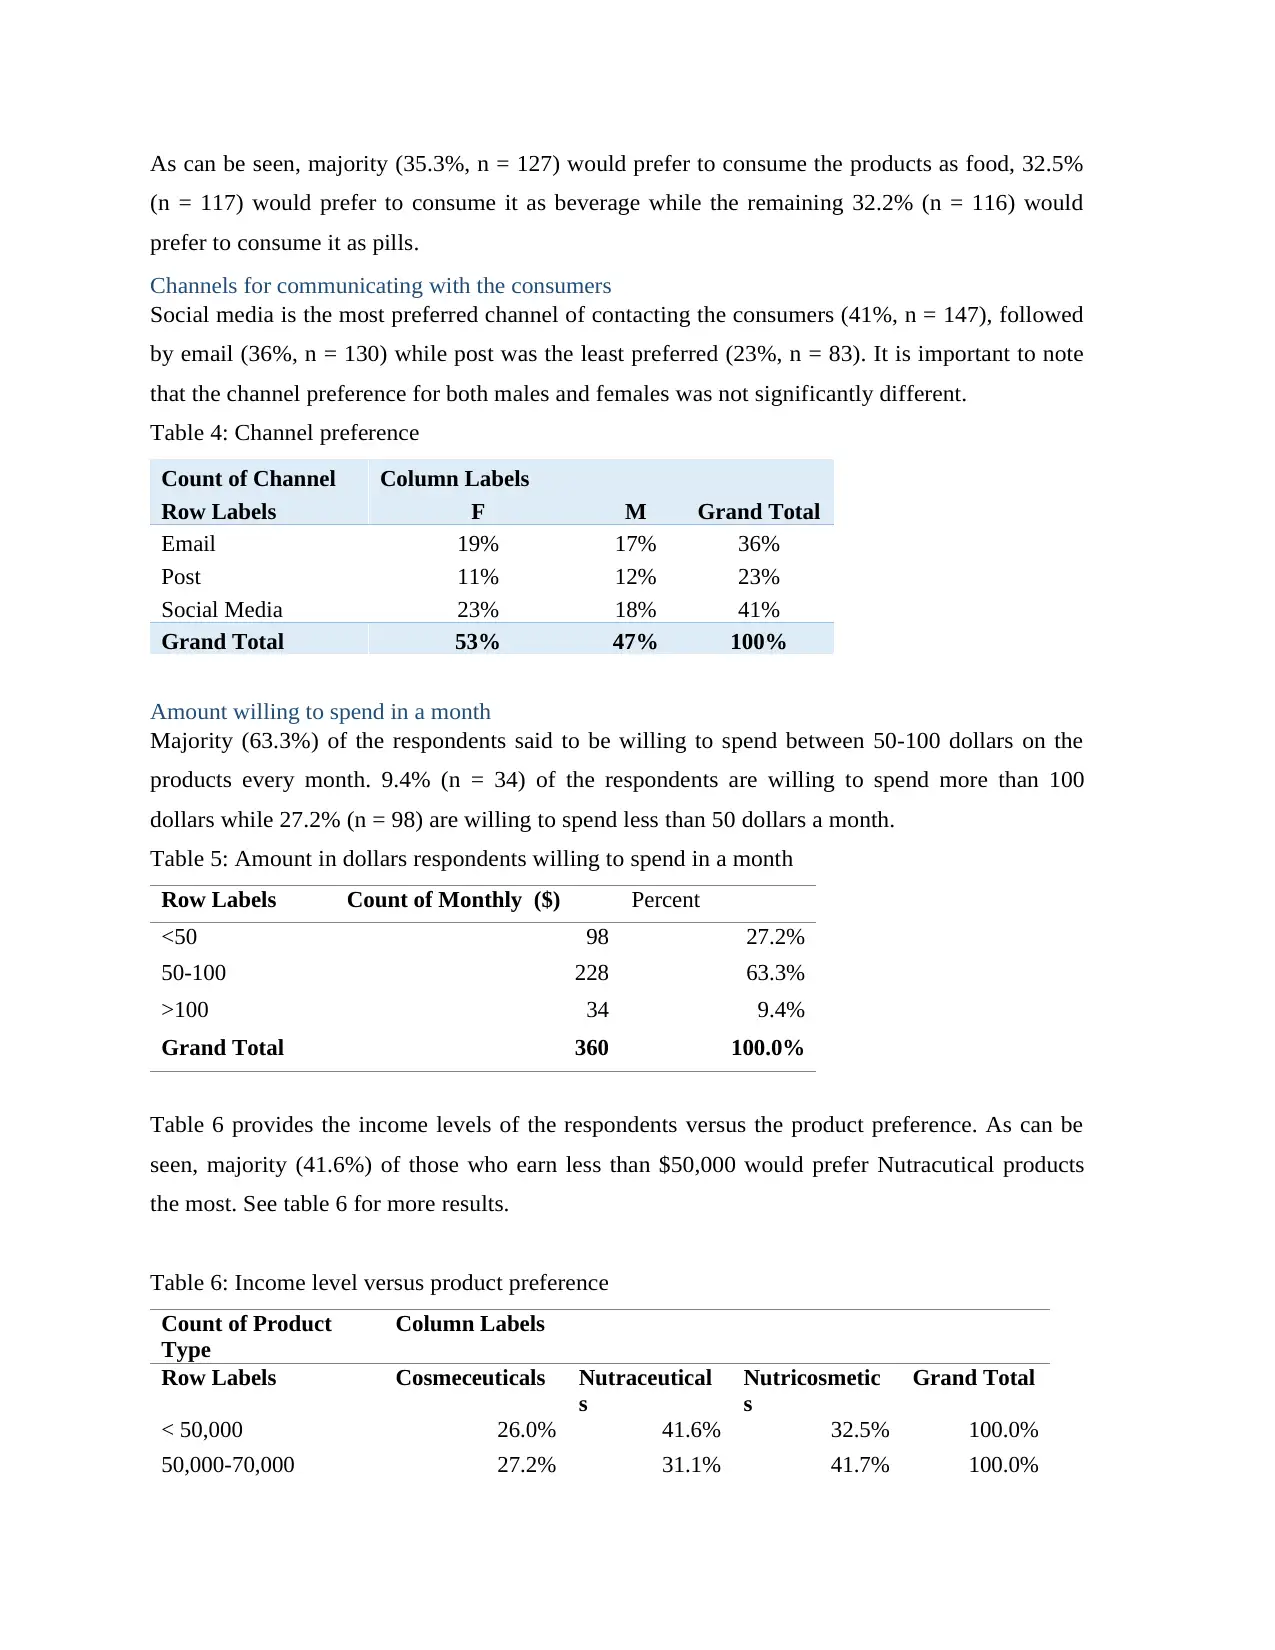
Even though Nutricosmetics was most preferred product among the respondents across all the
states, the confidence scores received were still lower than the confidence scores given for
Cosmeceutical which was the second among the most preferred products. Respondents were asked
how confident they were of the results from using the products. They were required to rate between 1
and 5 with 1 representing least confident while 5 representing most confident.
Cosmeceutical products ranked highest in terms of the confidence scores followed by Nutricosmetics
while Nutraceutical products came distant third. Of interest to note was that none of the products got
a score of 4 and above.
Females rated the Cosmeceutical products and Nutraceutical products highly as compared to the male
respondents who only gave a higher rating for Nutricosmetics.
Figure 3: Confidence rating of the product types by gender
Recommendation rating
Respondents were also asked to score on how confident they are to recommend the products to their
friends. The scores were between 1 and 10 with 1 being least confident and 10 being most confident. The
average scores were worrying. The average recommendation score for all the products was merely 5.39
out of 10. Cosmeceutical products had the highest recommendation score (5.6) while Nutraceuticals had
the least score. In overall, female respondents had higher recommendation scores for all the products as
compared to the male respondents. The average score for the males rating for all the products was on
average lower than 5 while females rating was slightly above 6. In fact a Net Promoter Score (NPS) of -
> 100,000 35.1% 32.4% 32.4% 100.0%
Grand Total 26.4% 32.8% 40.8% 100.0%
Understanding the potential markets and opportunities
Confidence rating
Even though Nutricosmetics was most preferred product among the respondents across all the
states, the confidence scores received were still lower than the confidence scores given for
Cosmeceutical which was the second among the most preferred products. Respondents were asked
how confident they were of the results from using the products. They were required to rate between 1
and 5 with 1 representing least confident while 5 representing most confident.
Cosmeceutical products ranked highest in terms of the confidence scores followed by Nutricosmetics
while Nutraceutical products came distant third. Of interest to note was that none of the products got
a score of 4 and above.
Females rated the Cosmeceutical products and Nutraceutical products highly as compared to the male
respondents who only gave a higher rating for Nutricosmetics.
Figure 3: Confidence rating of the product types by gender
Recommendation rating
Respondents were also asked to score on how confident they are to recommend the products to their
friends. The scores were between 1 and 10 with 1 being least confident and 10 being most confident. The
average scores were worrying. The average recommendation score for all the products was merely 5.39
out of 10. Cosmeceutical products had the highest recommendation score (5.6) while Nutraceuticals had
the least score. In overall, female respondents had higher recommendation scores for all the products as
compared to the male respondents. The average score for the males rating for all the products was on
average lower than 5 while females rating was slightly above 6. In fact a Net Promoter Score (NPS) of -
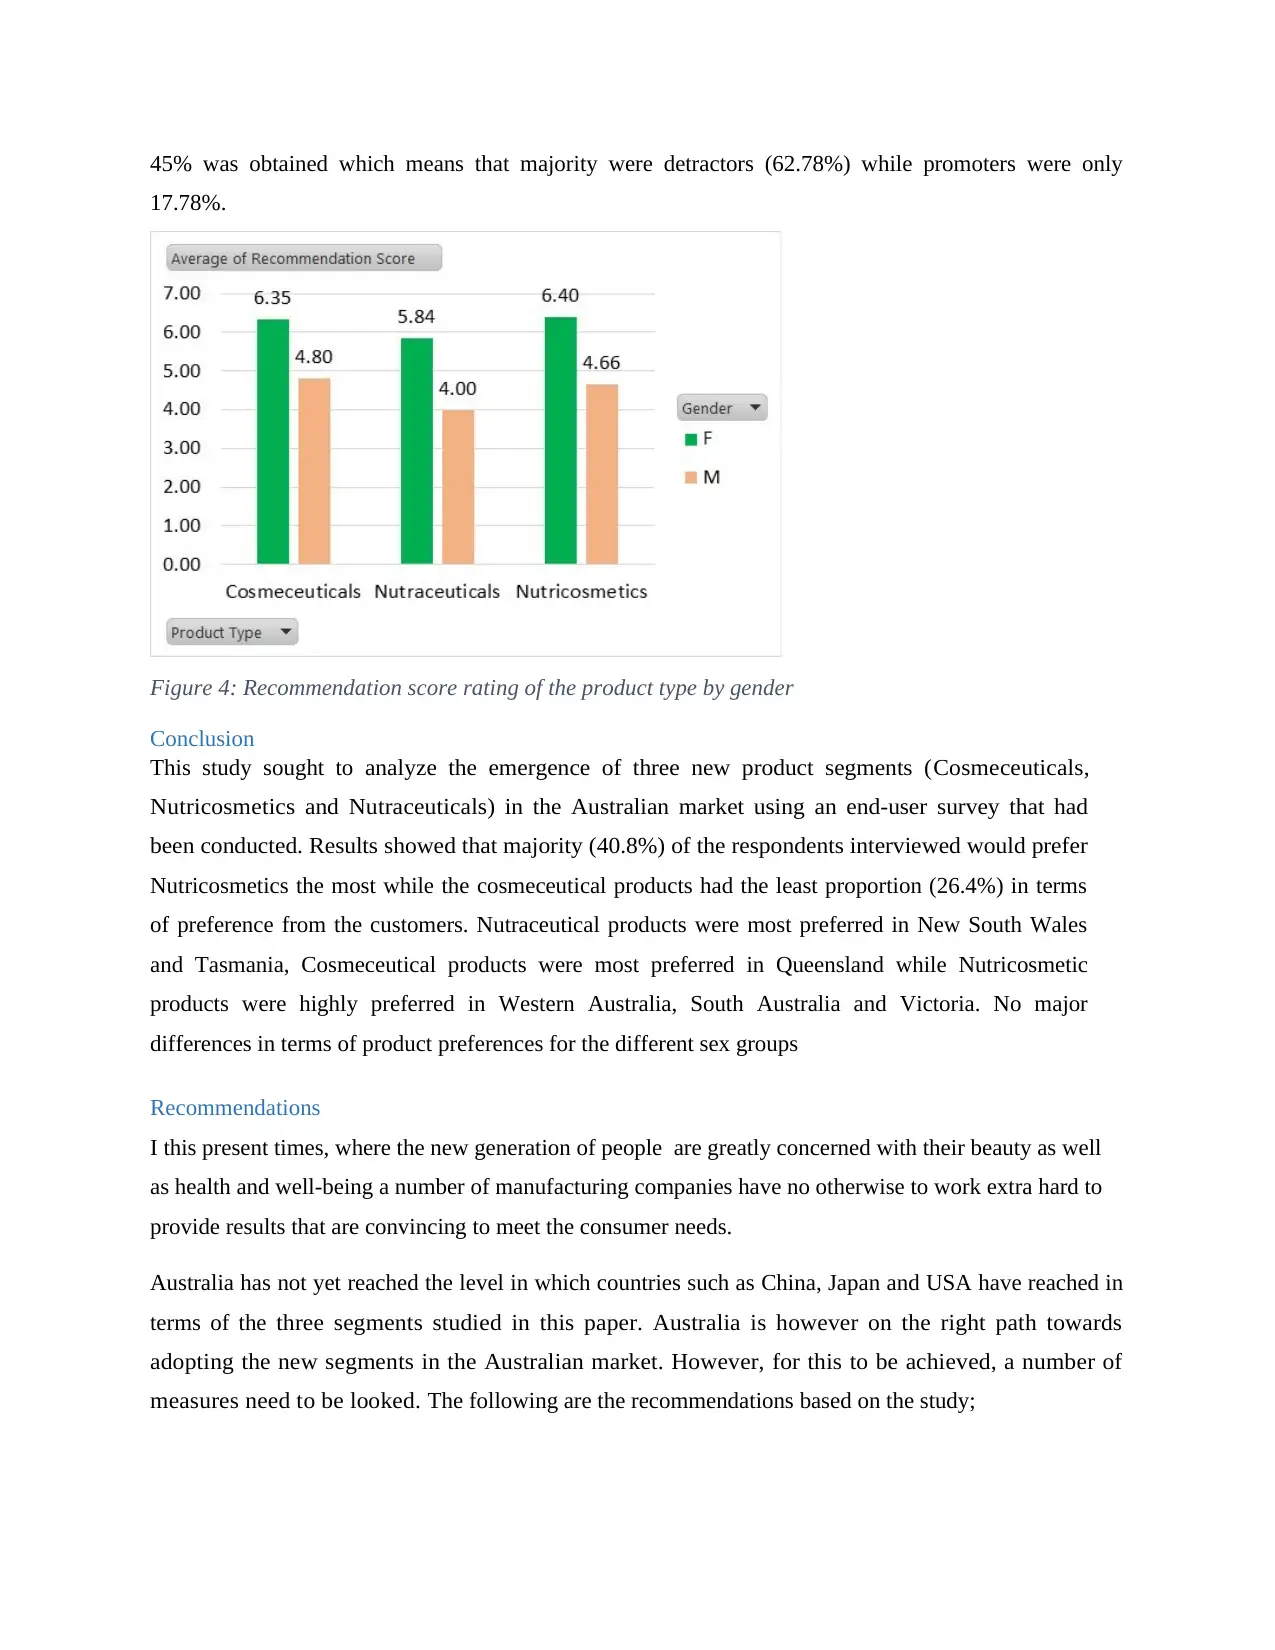
45% was obtained which means that majority were detractors (62.78%) while promoters were only
17.78%.
Figure 4: Recommendation score rating of the product type by gender
Conclusion
This study sought to analyze the emergence of three new product segments (Cosmeceuticals,
Nutricosmetics and Nutraceuticals) in the Australian market using an end-user survey that had
been conducted. Results showed that majority (40.8%) of the respondents interviewed would prefer
Nutricosmetics the most while the cosmeceutical products had the least proportion (26.4%) in terms
of preference from the customers. Nutraceutical products were most preferred in New South Wales
and Tasmania, Cosmeceutical products were most preferred in Queensland while Nutricosmetic
products were highly preferred in Western Australia, South Australia and Victoria. No major
differences in terms of product preferences for the different sex groups
Recommendations
I this present times, where the new generation of people are greatly concerned with their beauty as well
as health and well-being a number of manufacturing companies have no otherwise to work extra hard to
provide results that are convincing to meet the consumer needs.
Australia has not yet reached the level in which countries such as China, Japan and USA have reached in
terms of the three segments studied in this paper. Australia is however on the right path towards
adopting the new segments in the Australian market. However, for this to be achieved, a number of
measures need to be looked. The following are the recommendations based on the study;
⊘ This is a preview!⊘
Do you want full access?
Subscribe today to unlock all pages.
Trusted by 1+ million students worldwide
The producers should focus more of their campaigns in the social media as it proved to be the
most preferred channel of communication
The management should work on building the confidence of the consumers, the confidence levels
for the products are still very low
The pricing of the products should be between 50 to 100 dollars
The customer referral is a very important aspect of marketing a product. When a client c alls a
friend of theirs or a counterpart at another company and refers them to buy your goods or use
your service, it reminds them why they like to do business with you. Results of this study
revealed that the recommendation scores for the products is quite low, the management needs to
find out why this is the case and attempt to see on areas of improvement. The management could
possibly come up with a reward system for any referral made. This will see them reach many
people as possible.
The form in which consumers would like to consume the products is very important to note. It is
advisable that the producers have a mix of the different forms of consumption. It is important to
note that there was no significant difference in terms of the forms in which the customers would
want to consume the products. It would therefore prudent to bring all the three forms of
consumption into the market.
As observed from analysis, majority of the women in the aged below 30 years old have more
interest on Nutricosmetics and Cosmeceutical products as a sign of beauty care. The new
companies coming up should bring in products that focus on them since they represent a
significant population group in Australia.
The confidence levels of the new products are still very low as seen from the analysis, any
potential client intending to enter these new industry segments in Australia or even the existing
ones should put more emphasis on their campaign of sensitizing the consumer about the new
product segment about the benefits of the product and arraign any fears that may cause low
confidence levels among the consumers.
Paraphrase This Document
Need a fresh take? Get an instant paraphrase of this document with our AI Paraphraser
References
Epstein , H., 2009. Cosmeceutical vehicles. Clinical Dermatol, 27(5), p. 453–60.
Kenneth , R., Feingold, M. D. & Debra , C., 2010. Elizabeth M. Zettersten, MD, Ruby Ghadially,
MOptimal ratios of topical stratum corneum lipids improve barrier recovery in chronologically aged skin.
Zhou , C., Jin , Y. S. & Yeon , K. K., 2005. Heat Modulation of Tropoelastin, Fibrillin-1, and
MatrixMetalloproteinase-12 in Human Skin. Volume 124, p. 70–78.
1 out of 11

Your All-in-One AI-Powered Toolkit for Academic Success.
+13062052269
info@desklib.com
Available 24*7 on WhatsApp / Email
![[object Object]](/_next/static/media/star-bottom.7253800d.svg)
Unlock your academic potential
Copyright © 2020–2026 A2Z Services. All Rights Reserved. Developed and managed by ZUCOL.