LUBM303 Business Analytics Report: Costing, Correlation & Strategies
VerifiedAdded on 2022/12/15
|17
|4475
|364
Report
AI Summary
This business analytics report explores mathematical models, costing and revenue behavior, correlation of coefficient, and marketing strategies. It includes a five-year projection based on provided data, analyzing annual output, fixed costs, variable costs, and sales prices to calculate profit and loss. The report also discusses the importance of correlation coefficient in determining the relationship between advertisement and sales, and suggests social media marketing strategies to enhance sales and brand awareness. The analysis emphasizes the significance of understanding cost and revenue relationships for profitability and the need for continuous product innovation to maintain a competitive edge. Desklib provides access to similar solved assignments and resources for students.
Business analytics
Paraphrase This Document
Need a fresh take? Get an instant paraphrase of this document with our AI Paraphraser
Table of Contents
Introduction......................................................................................................................................3
Mathematical model.....................................................................................................................3
Correlation of coefficient.............................................................................................................8
Inflation/money supply..............................................................................................................13
Conclusion.....................................................................................................................................15
References......................................................................................................................................16
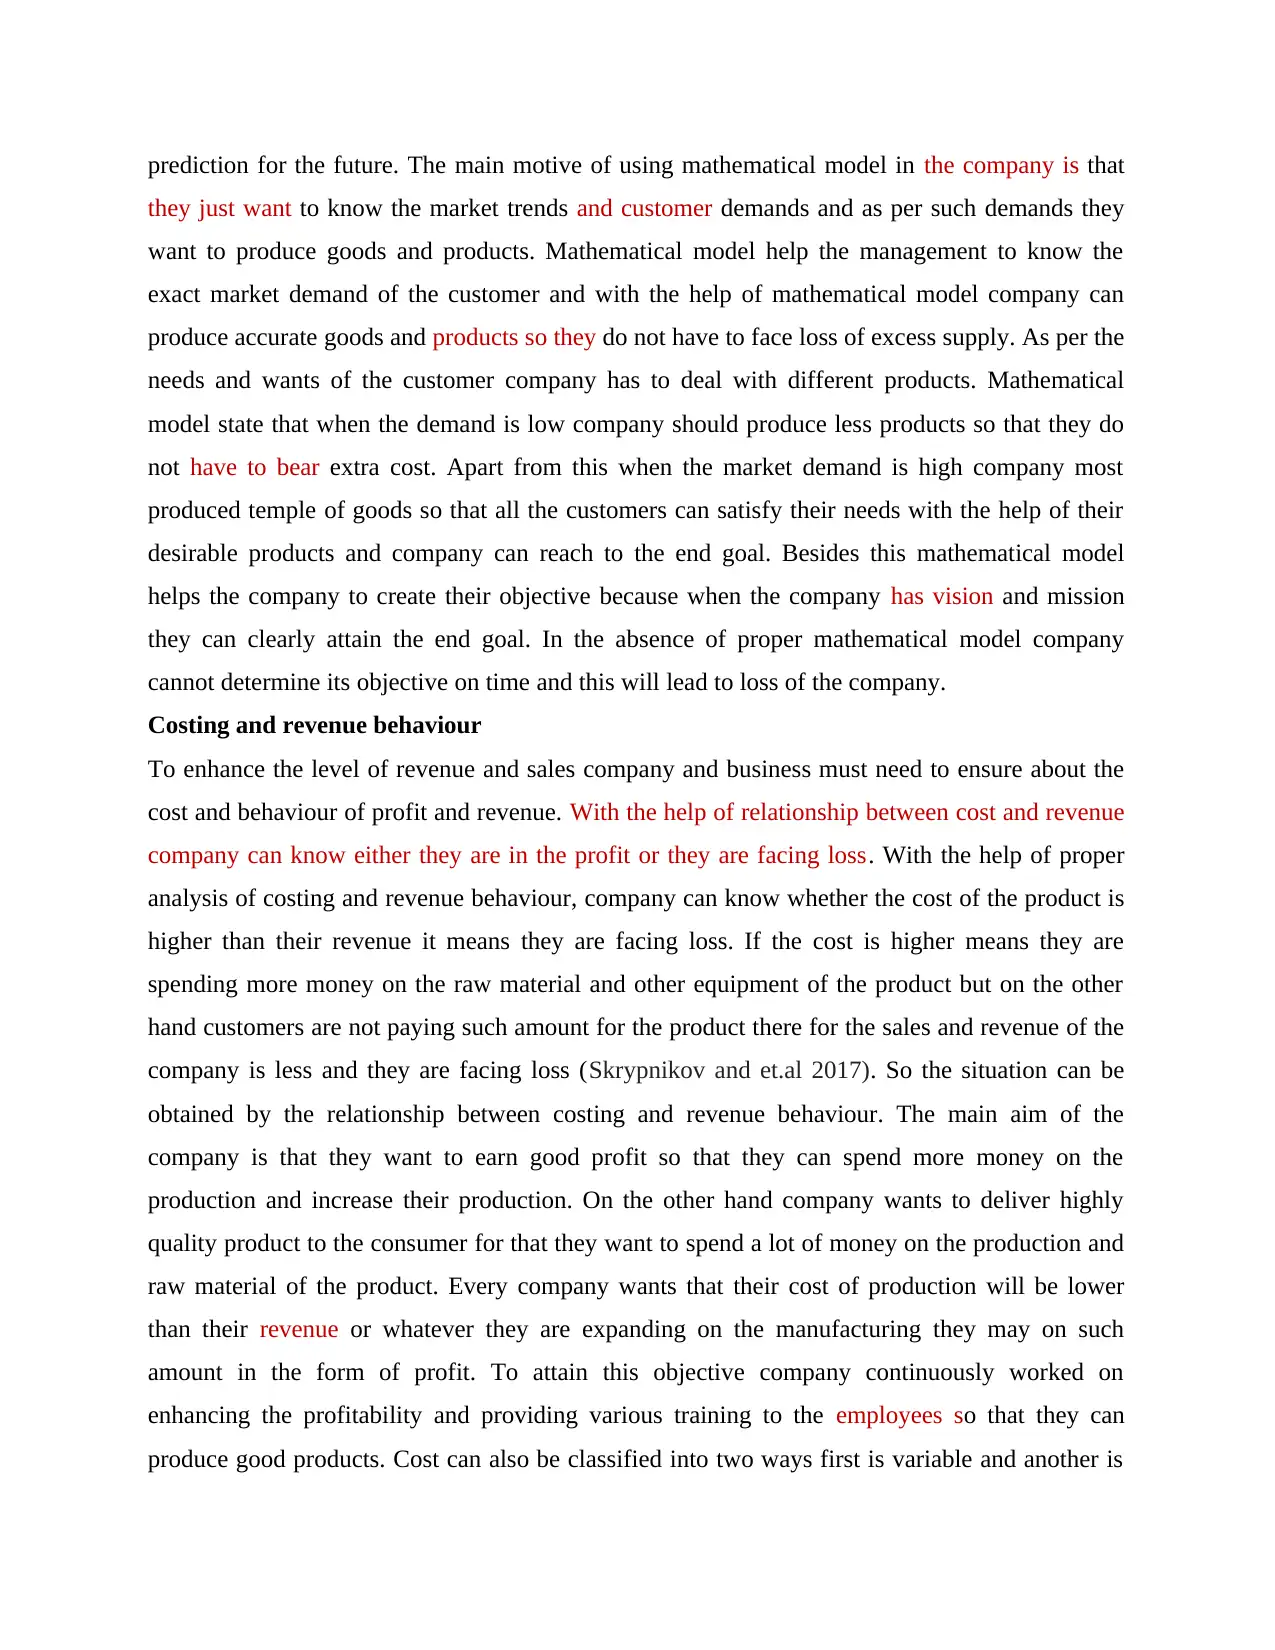
Introduction
The following report is based on business analytics. Business analytics is a continuous process in
which company and business implements various statistical tools and techniques to analyse the
data of their customers and improve their decision making so that company can increase sales
and revenue (Kim and et.al2020). This report states about coefficient of correlation between two
variables such as advertisement and sales of the company. Besides this quantity theory is being
explained in this report. This report provides in-depth knowledge about inflation and money
supply. In this report various marketing strategies which can be implemented by the company is
mentioned. This support gives information about mathematical model as well.
Mathematical model
Mathematical model is a system which uses mathematical language. Mathematical model is used
in physical and non physical system and provides better knowledge information to the company
(Jiang and et.al 2019). This method also helps in determining the various factors which impacts
the value of the variables. Mathematical model is the art of transferring the theoretical problem
into the numerical issue through mathematical model company can analyse the numerical issue
and reached out to the main problem and as per such analysis they can get different solutions,
which helps the management and company to enhance the profitability in sales of the product
(Samui and et.al 2020). Mathematical model also uses financial modelling to provide better
resultant outcome to the company with the help of financial modelling company can make
policies about the finance and profit of the company. As per the profit company can expand their
business in different countries as well because when they have sample of profit that can spend on
their production. This can only become possible with the help of mathematical model. Another
benefit of mathematical model is that it is easy to implement and it also save the valuable time of
company and Management. Apart from this mathematical model provides sales revenue and
information of fixed cost but from this essential information about output is also being given by
mathematical model. One of the biggest advantages of mathematical model is that it provides
⊘ This is a preview!⊘
Do you want full access?
Subscribe today to unlock all pages.
Trusted by 1+ million students worldwide
prediction for the future. The main motive of using mathematical model in the company is that
they just want to know the market trends and customer demands and as per such demands they
want to produce goods and products. Mathematical model help the management to know the
exact market demand of the customer and with the help of mathematical model company can
produce accurate goods and products so they do not have to face loss of excess supply. As per the
needs and wants of the customer company has to deal with different products. Mathematical
model state that when the demand is low company should produce less products so that they do
not have to bear extra cost. Apart from this when the market demand is high company most
produced temple of goods so that all the customers can satisfy their needs with the help of their
desirable products and company can reach to the end goal. Besides this mathematical model
helps the company to create their objective because when the company has vision and mission
they can clearly attain the end goal. In the absence of proper mathematical model company
cannot determine its objective on time and this will lead to loss of the company.
Costing and revenue behaviour
To enhance the level of revenue and sales company and business must need to ensure about the
cost and behaviour of profit and revenue. With the help of relationship between cost and revenue
company can know either they are in the profit or they are facing loss. With the help of proper
analysis of costing and revenue behaviour, company can know whether the cost of the product is
higher than their revenue it means they are facing loss. If the cost is higher means they are
spending more money on the raw material and other equipment of the product but on the other
hand customers are not paying such amount for the product there for the sales and revenue of the
company is less and they are facing loss (Skrypnikov and et.al 2017). So the situation can be
obtained by the relationship between costing and revenue behaviour. The main aim of the
company is that they want to earn good profit so that they can spend more money on the
production and increase their production. On the other hand company wants to deliver highly
quality product to the consumer for that they want to spend a lot of money on the production and
raw material of the product. Every company wants that their cost of production will be lower
than their revenue or whatever they are expanding on the manufacturing they may on such
amount in the form of profit. To attain this objective company continuously worked on
enhancing the profitability and providing various training to the employees so that they can
produce good products. Cost can also be classified into two ways first is variable and another is
Paraphrase This Document
Need a fresh take? Get an instant paraphrase of this document with our AI Paraphraser
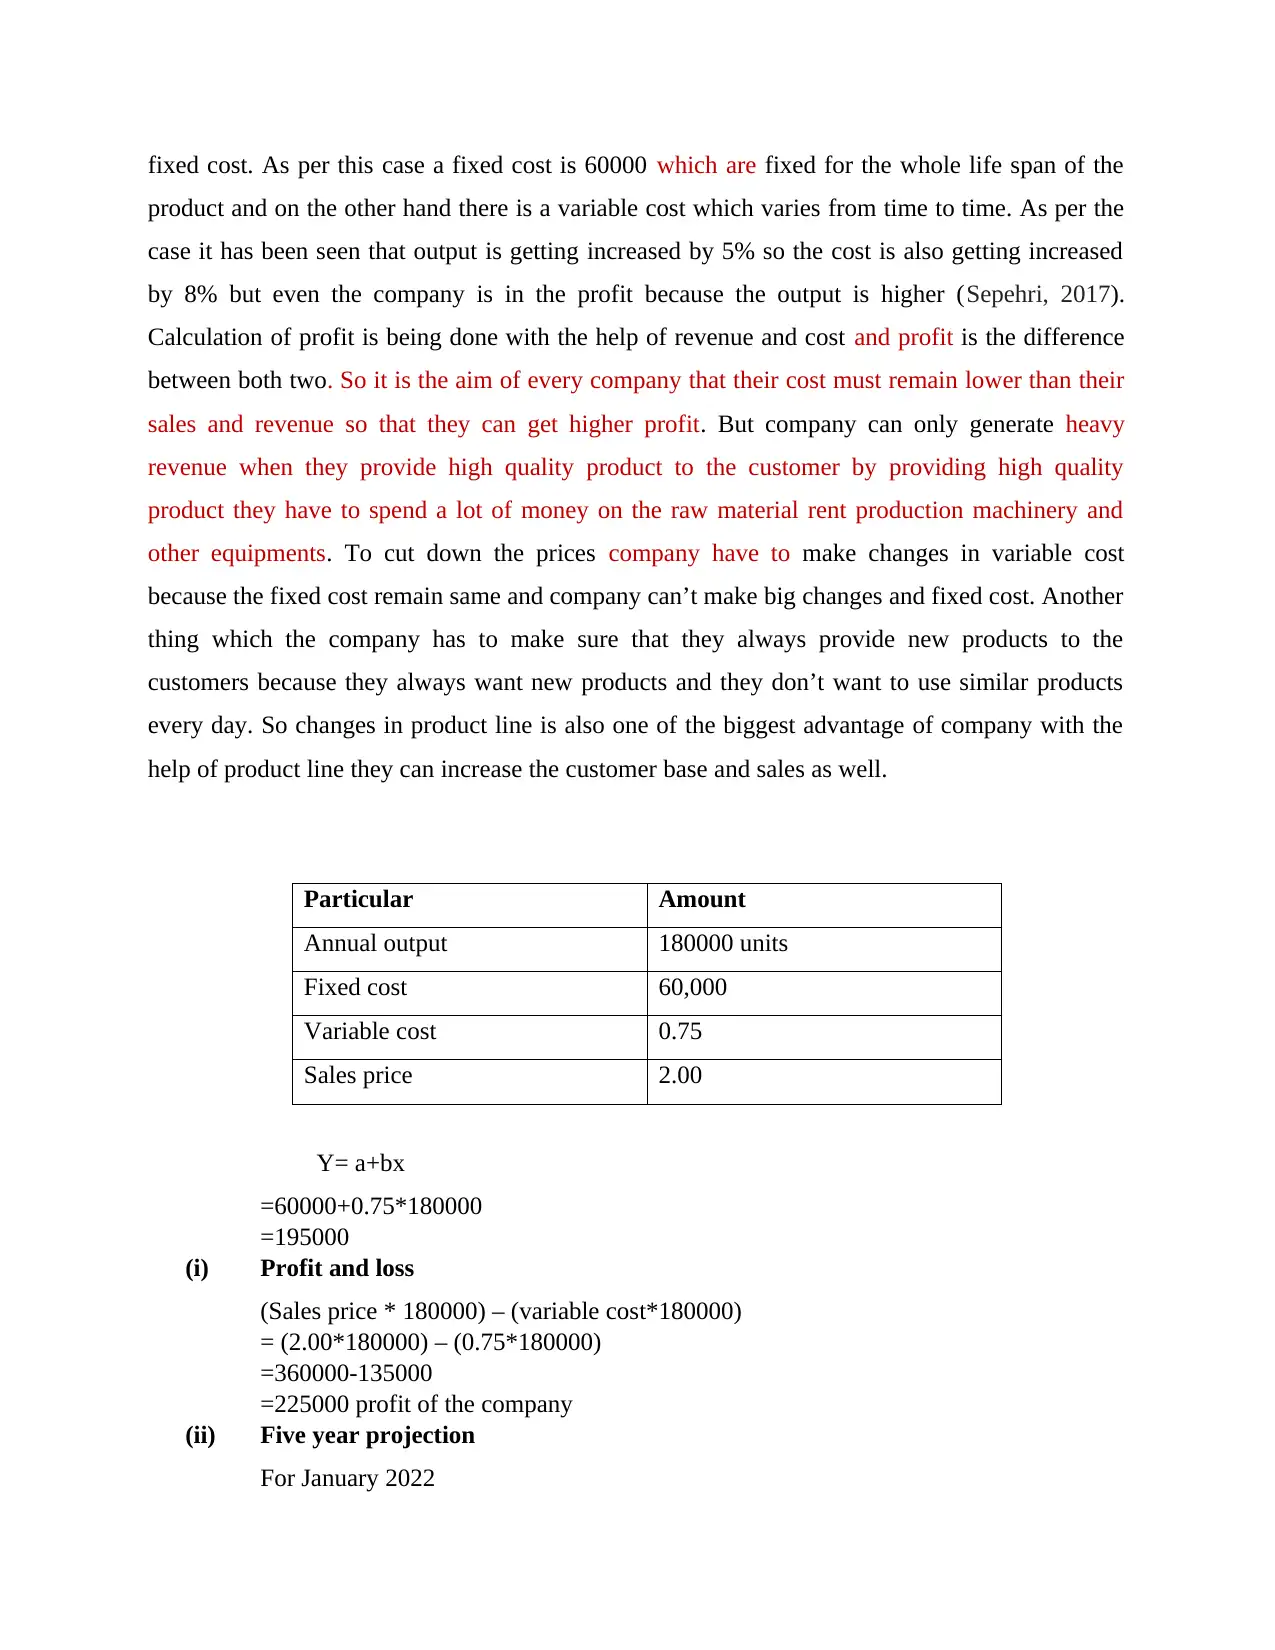
fixed cost. As per this case a fixed cost is 60000 which are fixed for the whole life span of the
product and on the other hand there is a variable cost which varies from time to time. As per the
case it has been seen that output is getting increased by 5% so the cost is also getting increased
by 8% but even the company is in the profit because the output is higher (Sepehri, 2017).
Calculation of profit is being done with the help of revenue and cost and profit is the difference
between both two. So it is the aim of every company that their cost must remain lower than their
sales and revenue so that they can get higher profit. But company can only generate heavy
revenue when they provide high quality product to the customer by providing high quality
product they have to spend a lot of money on the raw material rent production machinery and
other equipments. To cut down the prices company have to make changes in variable cost
because the fixed cost remain same and company can’t make big changes and fixed cost. Another
thing which the company has to make sure that they always provide new products to the
customers because they always want new products and they don’t want to use similar products
every day. So changes in product line is also one of the biggest advantage of company with the
help of product line they can increase the customer base and sales as well.
Particular Amount
Annual output 180000 units
Fixed cost 60,000
Variable cost 0.75
Sales price 2.00
Y= a+bx
=60000+0.75*180000
=195000
(i) Profit and loss
(Sales price * 180000) – (variable cost*180000)
= (2.00*180000) – (0.75*180000)
=360000-135000
=225000 profit of the company
(ii) Five year projection
For January 2022
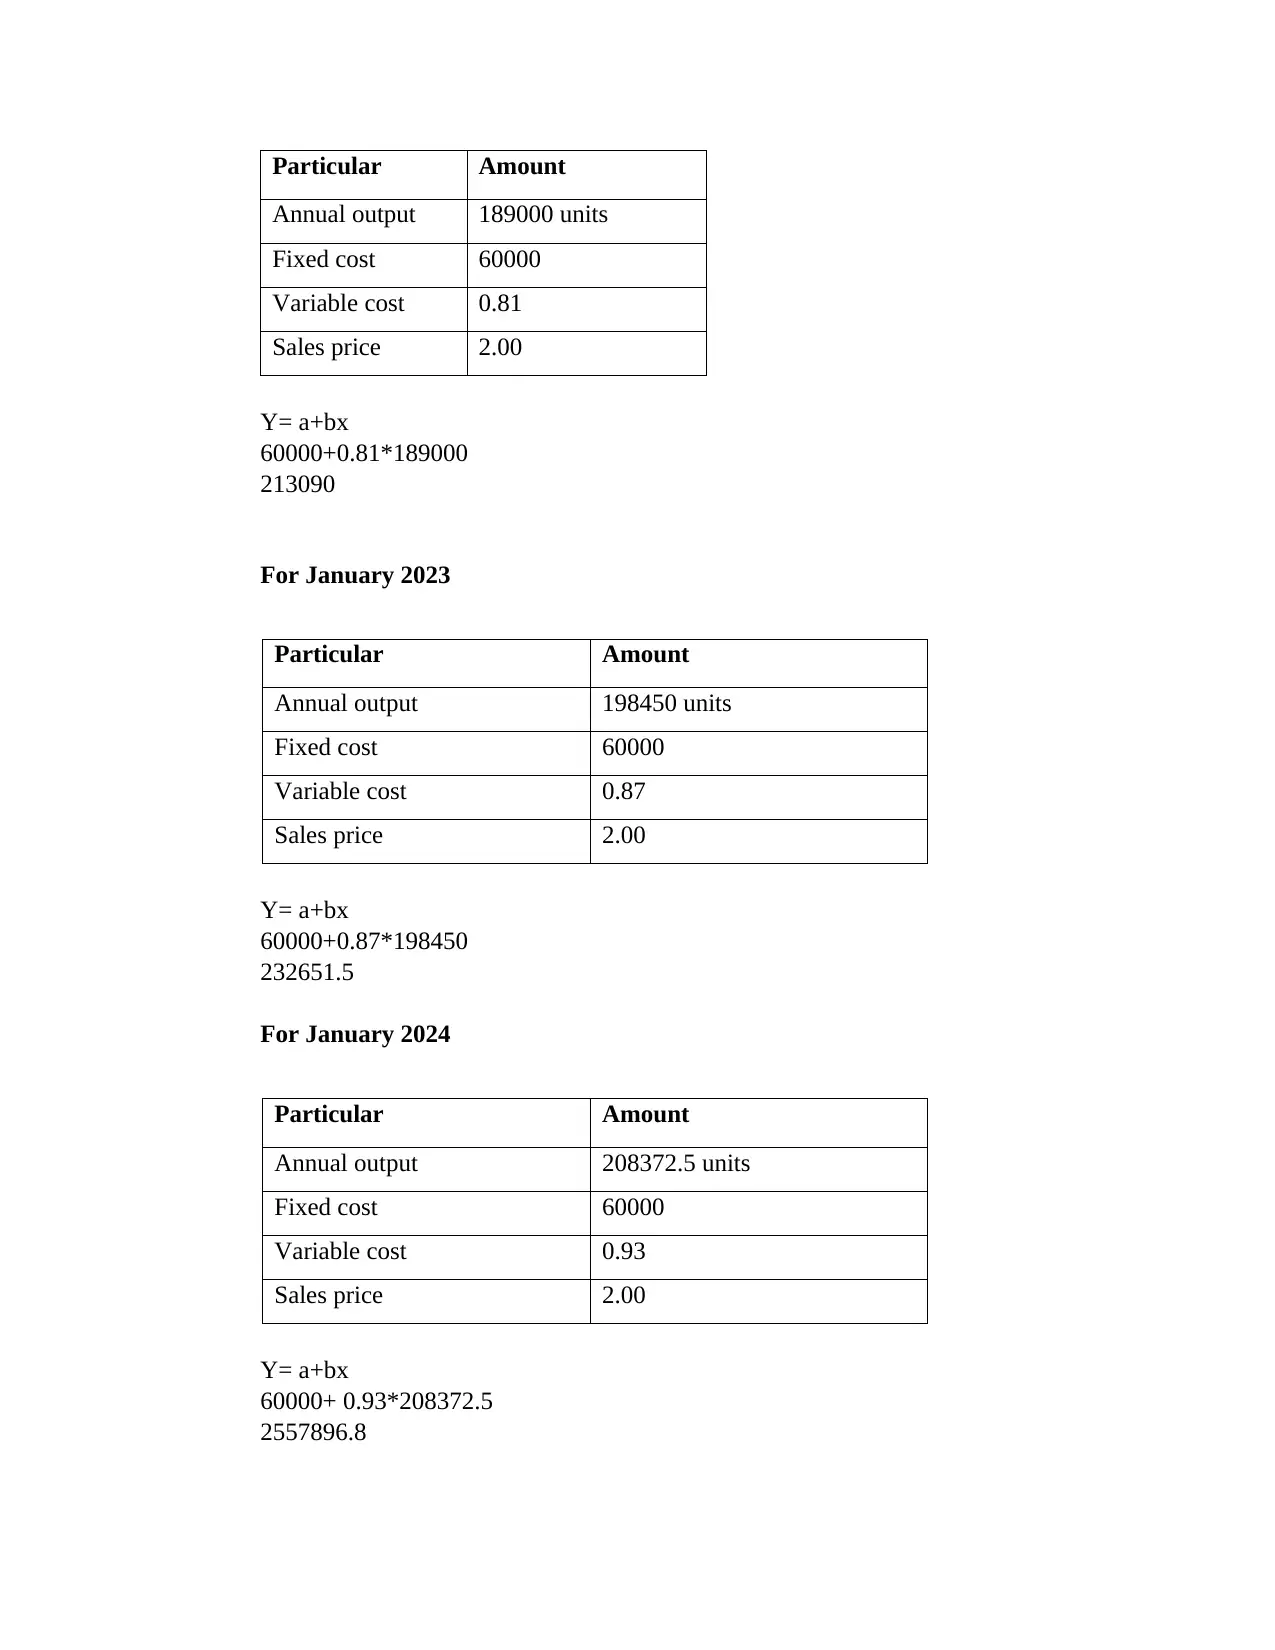
Particular Amount
Annual output 189000 units
Fixed cost 60000
Variable cost 0.81
Sales price 2.00
Y= a+bx
60000+0.81*189000
213090
For January 2023
Particular Amount
Annual output 198450 units
Fixed cost 60000
Variable cost 0.87
Sales price 2.00
Y= a+bx
60000+0.87*198450
232651.5
For January 2024
Particular Amount
Annual output 208372.5 units
Fixed cost 60000
Variable cost 0.93
Sales price 2.00
Y= a+bx
60000+ 0.93*208372.5
2557896.8
⊘ This is a preview!⊘
Do you want full access?
Subscribe today to unlock all pages.
Trusted by 1+ million students worldwide
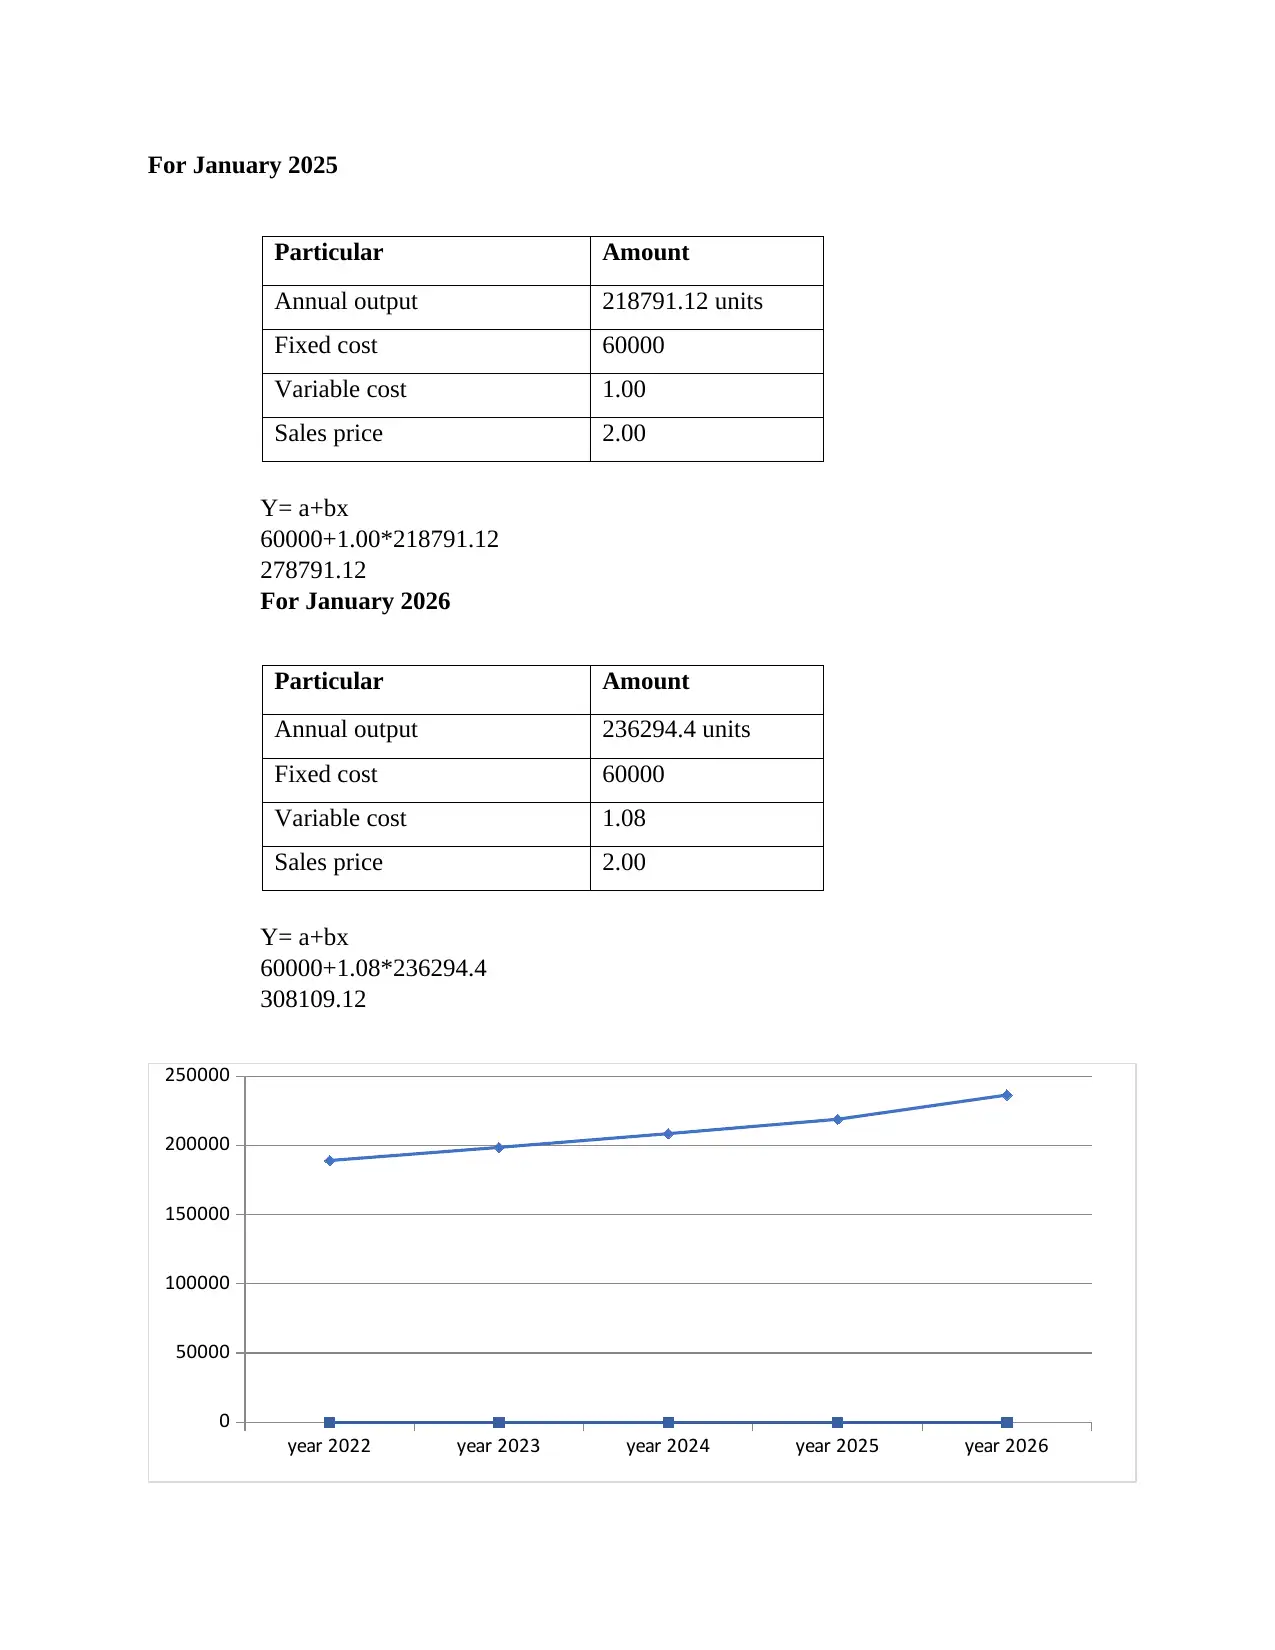
For January 2025
Particular Amount
Annual output 218791.12 units
Fixed cost 60000
Variable cost 1.00
Sales price 2.00
Y= a+bx
60000+1.00*218791.12
278791.12
For January 2026
Particular Amount
Annual output 236294.4 units
Fixed cost 60000
Variable cost 1.08
Sales price 2.00
Y= a+bx
60000+1.08*236294.4
308109.12
year 2022 year 2023 year 2024 year 2025 year 2026
0
50000
100000
150000
200000
250000
Particular Amount
Annual output 218791.12 units
Fixed cost 60000
Variable cost 1.00
Sales price 2.00
Y= a+bx
60000+1.00*218791.12
278791.12
For January 2026
Particular Amount
Annual output 236294.4 units
Fixed cost 60000
Variable cost 1.08
Sales price 2.00
Y= a+bx
60000+1.08*236294.4
308109.12
year 2022 year 2023 year 2024 year 2025 year 2026
0
50000
100000
150000
200000
250000
Paraphrase This Document
Need a fresh take? Get an instant paraphrase of this document with our AI Paraphraser
Correlation of coefficient
Correlation of Coefficient represents the relationship between two variants and events.
Correlation of Coefficient is being used to measure that how strong relationship between both
variables. It can be determined by the linear regression (Nystrand and et.al 2019). Correlation of
Coefficient provides a value which determines the relationship of different variables. Correlation
of Coefficient varies from -1 to 1. If the correlation of Coefficient is 1 it shows that if any
positive change comes in one of the variable it will affect the second variable in a positive way.
On the other hand if the correlation of Coefficient as -1 then it shows that any positive change in
any variable will provide negative degrees and change in another variable. In the given task the
coefficient is 0.9 which shows that if the manager of the company is making any change in
advertisement it will definitely impact the revenue and sales of the company in a positive way
(Yang and et. al 2020). Because 0.9 is nearby 1 which means that the marketing strategies
followed by the company and its manager is favourable for the company and when manager is
making any change and advertisement in marketing strategies it is directly impacting to the
revenue and sales of the company. When the marketing strategy is getting changed or manager is
doing any new marketing strategy it is impacting the entire work of company and the sales is
getting promoted. So the change in one variable is impacting another variable in a positive way.
Like when the advertisement strategy is being changed it is positively impacting the sales of the
company. If the correlation of Coefficient is zero it means that there is no positive and negative
impact on the variable if any one variable get changed. Correlation of Coefficient states that the
larger the number it leads to larger change for the company (Tuan and et.al2020) . The main use
of correlation of Coefficient is to know the relation between both the variables and provide the
best answer to the company that how strong the relationship is among the variables. It measures
the strength of the variables and how much benefit these variables will provide to the company is
being calculated by the correlation of coefficient. Correlation of Coefficient will provide valuable
information to the management of the company that whatever changes they are doing in
advertisement is it affecting the revenue in positive way or negative way. So with the help of
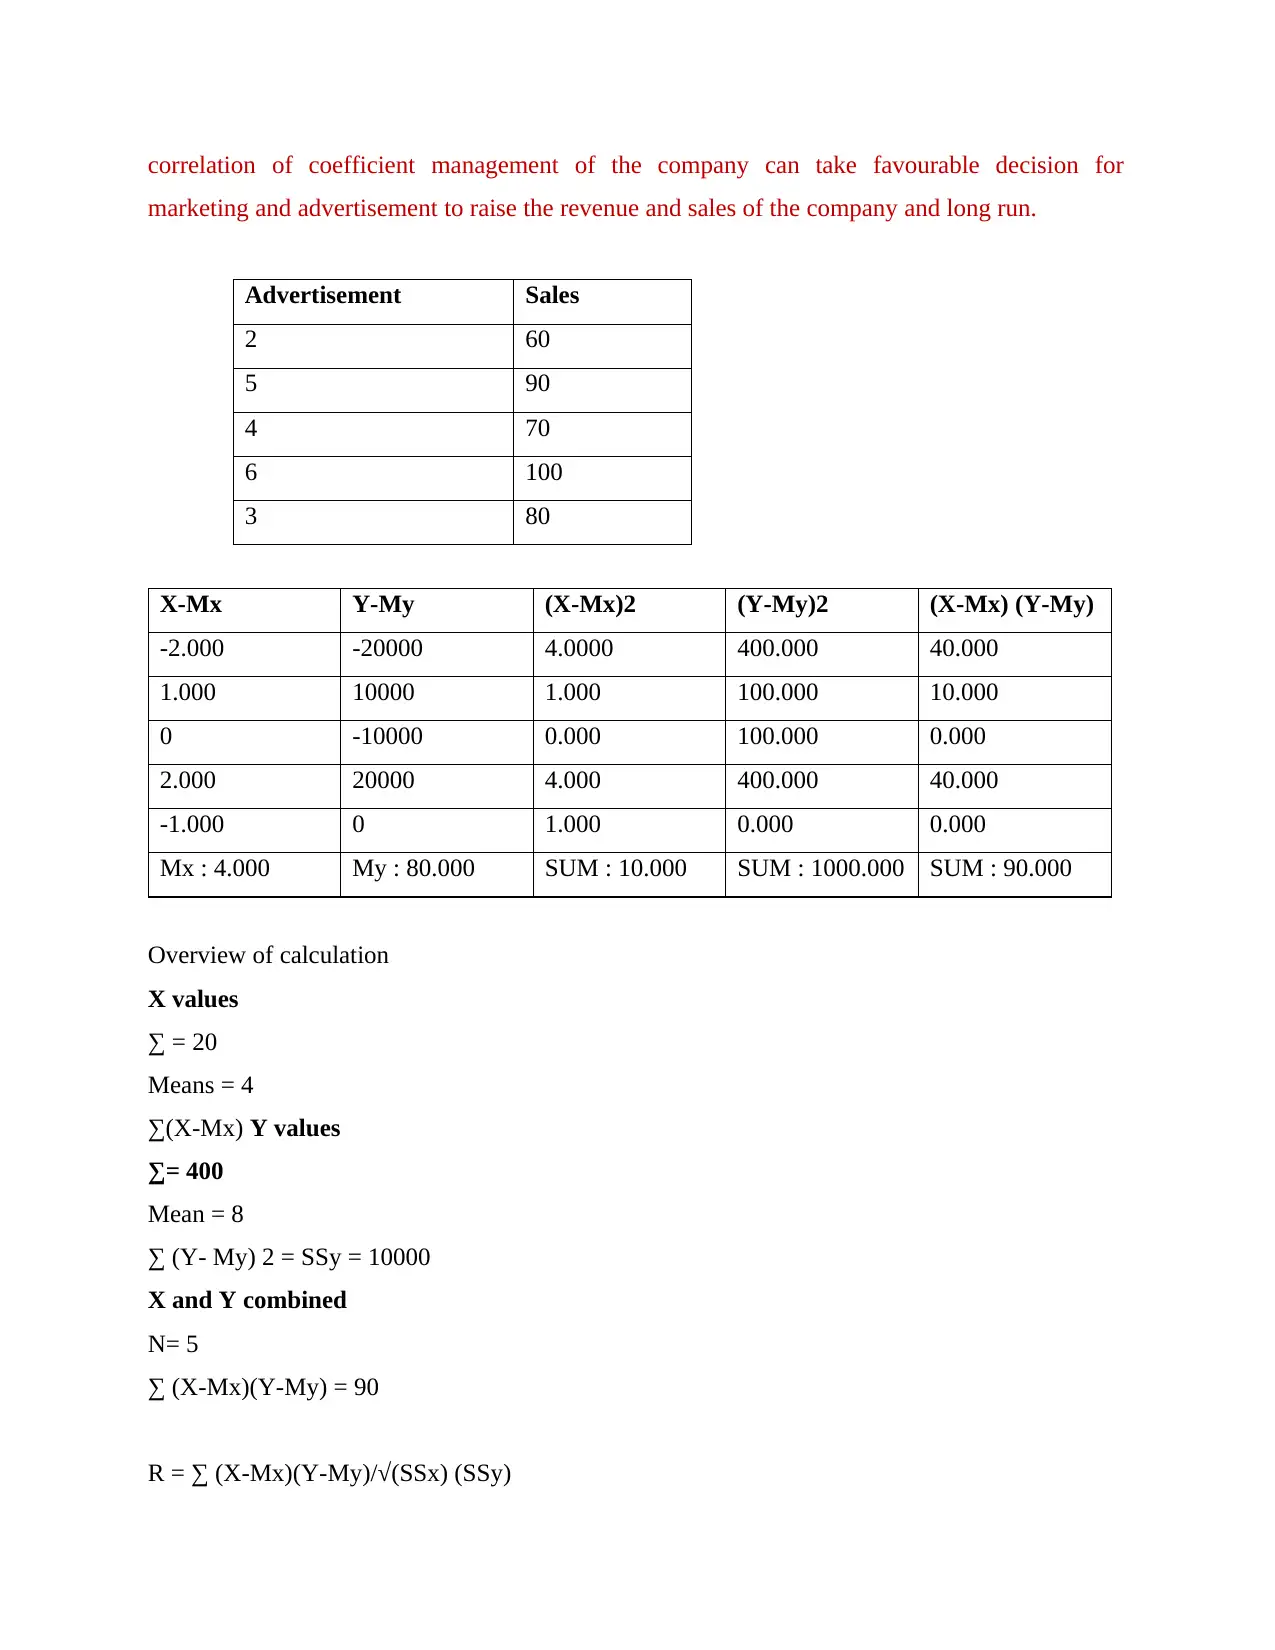
correlation of coefficient management of the company can take favourable decision for
marketing and advertisement to raise the revenue and sales of the company and long run.
Advertisement Sales
2 60
5 90
4 70
6 100
3 80
X-Mx Y-My (X-Mx)2 (Y-My)2 (X-Mx) (Y-My)
-2.000 -20000 4.0000 400.000 40.000
1.000 10000 1.000 100.000 10.000
0 -10000 0.000 100.000 0.000
2.000 20000 4.000 400.000 40.000
-1.000 0 1.000 0.000 0.000
Mx : 4.000 My : 80.000 SUM : 10.000 SUM : 1000.000 SUM : 90.000
Overview of calculation
X values
∑ = 20
Means = 4
∑(X-Mx) Y values
∑= 400
Mean = 8
∑ (Y- My) 2 = SSy = 10000
X and Y combined
N= 5
∑ (X-Mx)(Y-My) = 90
R = ∑ (X-Mx)(Y-My)/√(SSx) (SSy)
⊘ This is a preview!⊘
Do you want full access?
Subscribe today to unlock all pages.
Trusted by 1+ million students worldwide
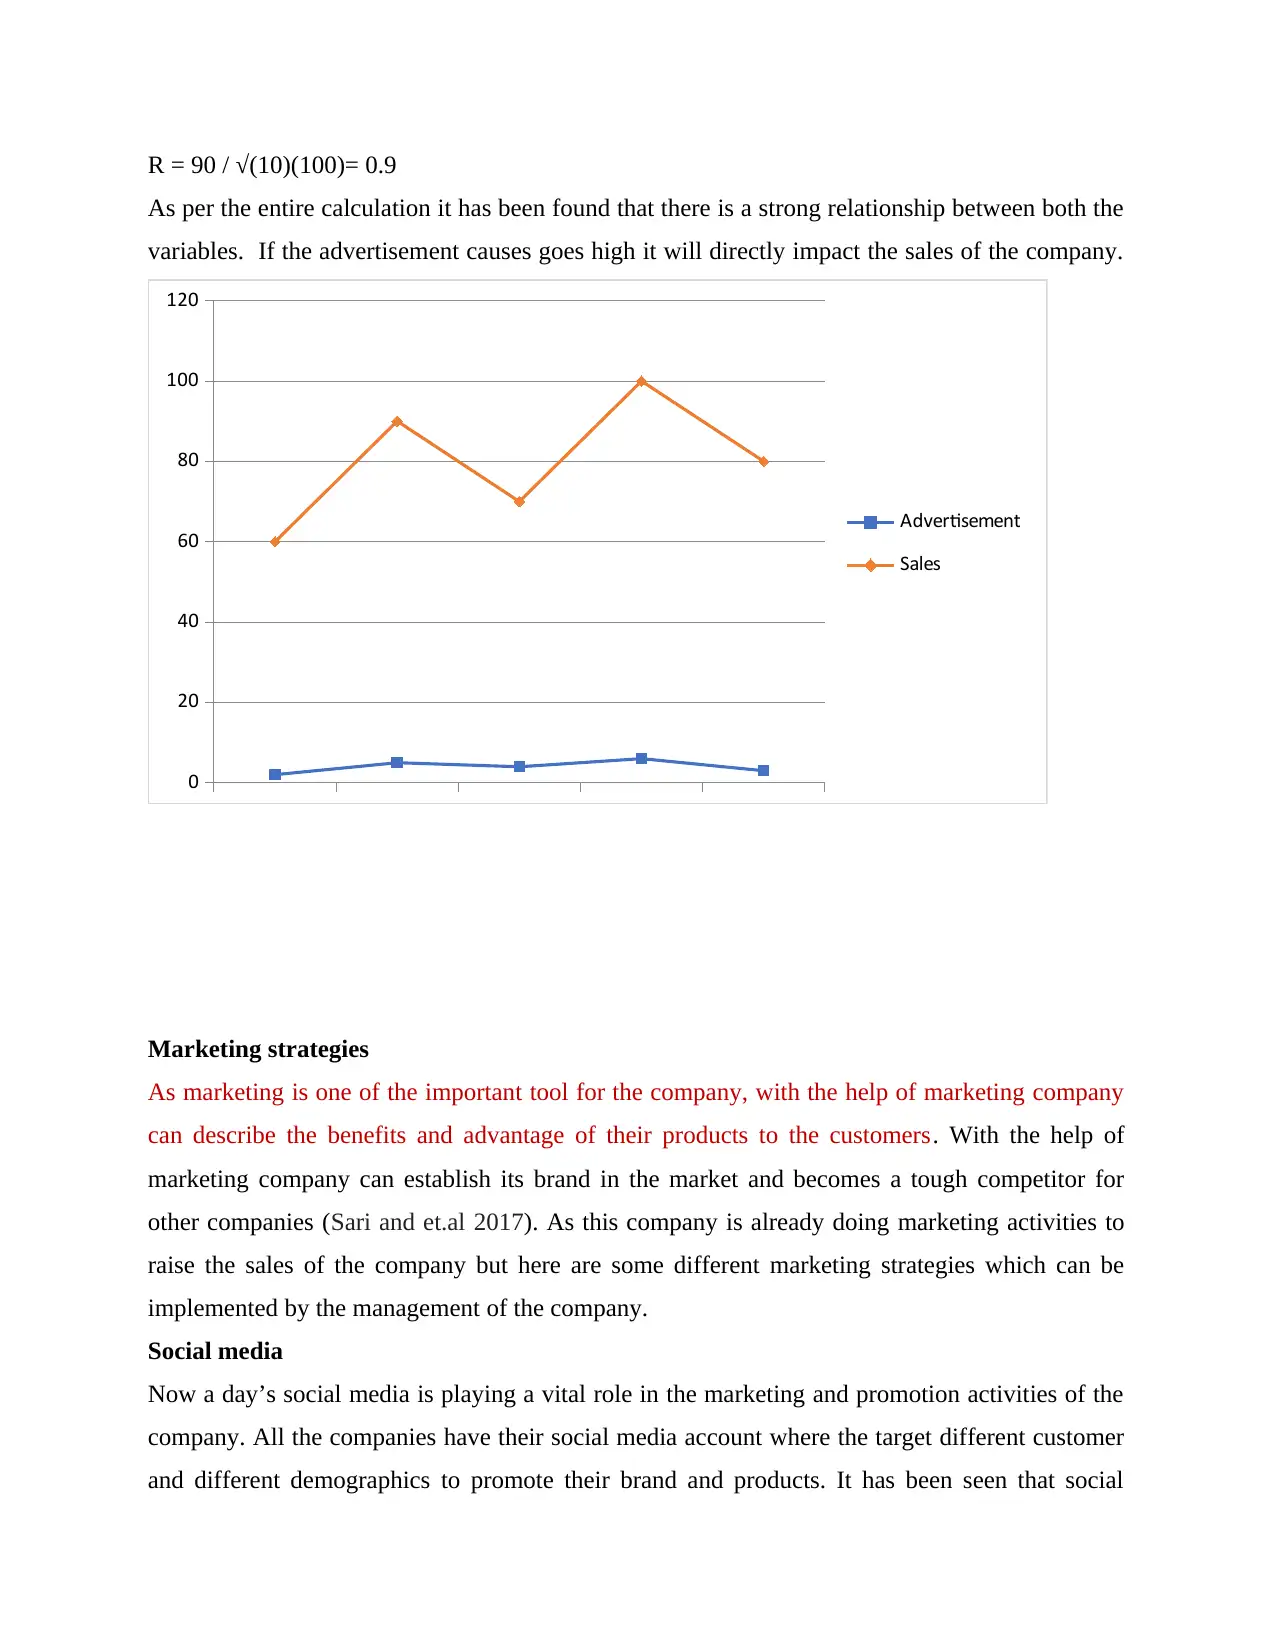
R = 90 / √(10)(100)= 0.9
As per the entire calculation it has been found that there is a strong relationship between both the
variables. If the advertisement causes goes high it will directly impact the sales of the company.
0
20
40
60
80
100
120
Advertisement
Sales
Marketing strategies
As marketing is one of the important tool for the company, with the help of marketing company
can describe the benefits and advantage of their products to the customers. With the help of
marketing company can establish its brand in the market and becomes a tough competitor for
other companies (Sari and et.al 2017). As this company is already doing marketing activities to
raise the sales of the company but here are some different marketing strategies which can be
implemented by the management of the company.
Social media
Now a day’s social media is playing a vital role in the marketing and promotion activities of the
company. All the companies have their social media account where the target different customer
and different demographics to promote their brand and products. It has been seen that social
Paraphrase This Document
Need a fresh take? Get an instant paraphrase of this document with our AI Paraphraser
media has millions of customers and it has many active users so the company are targeting such
users to sell their products. So social media can be an important tool for the company to promote
their products. To remain active on social media platform managers can create a page of
companies where they have to provide various details images and information about the latest
trends of and products of the company so that more and more people come to know about the
products and the name of the company. This company can hire social media manager who will
check out the blogs of the company and also answer the queries of the customers which will rise
on the social media platform of the company.
Email marketing
This is one of the cheapest ways of marketing for the company through which it can raise its
sales and revenue. In this marketing management will provide emails to the previous customers
of the company so that they can know the latest trends and offers given by the company to them
(Zakaria and et.al2017). This is one of the easiest ways to be in touch with customers. With the
help of email customer can easily know about the latest product of the company and they may
forward such mail to their friends and families so that they can also get the benefit of discount
and different offers. In email marketing company can provide referral code to their local users so
that they may forward such mail to other persons and they can use the referral code and this will
help the company to enhance its sales.
Content marketing strategies
As marketing strategy focuses on the content provided by the company to its customers whether
the provided by online website of the company or social media handle (Stimolo, and et.al 2019).
According to this company and the management must provide correct inaccurate details to the
customers so that they do not have any question in their mind whether they want to purchase the
product or not. Company can use such content on their social media handles such as Facebook
Twitter and LinkedIn. This will definitely help the company to increase the profitability.
Pricing strategy
This is one of the powerful tools of the companies to which it can raise its sales and revenue
easily. All the company have to sale the product at cheap and affordable cost to the customers
especially as compared to their competitors (Lambe and et.al2017). If the company provides
better quality goods at low prices it will definitely grab the attention of customers and the
customer base of the company can increase easily. With the help of these marketing strategies
company can gain competitive advantage.
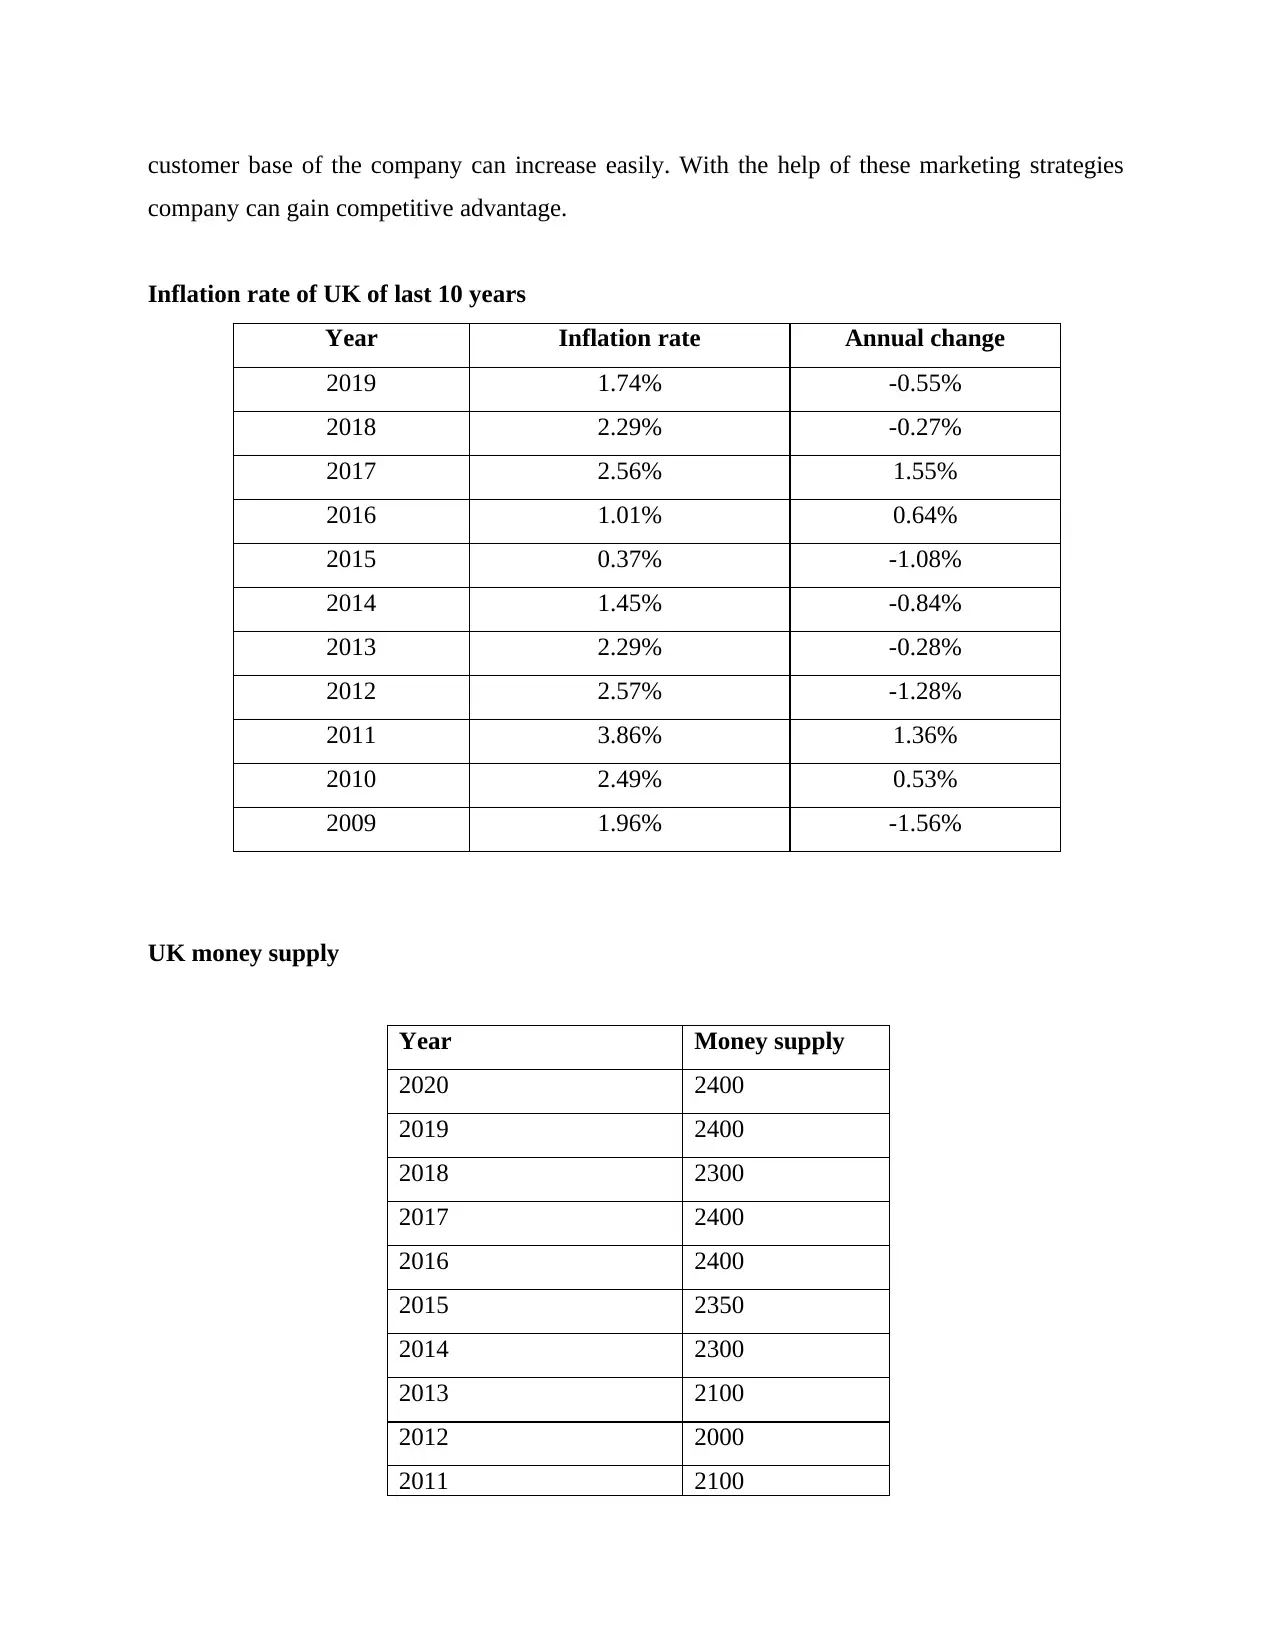
Inflation rate of UK of last 10 years
Year Inflation rate Annual change
2019 1.74% -0.55%
2018 2.29% -0.27%
2017 2.56% 1.55%
2016 1.01% 0.64%
2015 0.37% -1.08%
2014 1.45% -0.84%
2013 2.29% -0.28%
2012 2.57% -1.28%
2011 3.86% 1.36%
2010 2.49% 0.53%
2009 1.96% -1.56%
UK money supply
Year Money supply
2020 2400
2019 2400
2018 2300
2017 2400
2016 2400
2015 2350
2014 2300
2013 2100
2012 2000
2011 2100
company can gain competitive advantage.
Inflation rate of UK of last 10 years
Year Inflation rate Annual change
2019 1.74% -0.55%
2018 2.29% -0.27%
2017 2.56% 1.55%
2016 1.01% 0.64%
2015 0.37% -1.08%
2014 1.45% -0.84%
2013 2.29% -0.28%
2012 2.57% -1.28%
2011 3.86% 1.36%
2010 2.49% 0.53%
2009 1.96% -1.56%
UK money supply
Year Money supply
2020 2400
2019 2400
2018 2300
2017 2400
2016 2400
2015 2350
2014 2300
2013 2100
2012 2000
2011 2100
⊘ This is a preview!⊘
Do you want full access?
Subscribe today to unlock all pages.
Trusted by 1+ million students worldwide
1 out of 17
Related Documents


Your All-in-One AI-Powered Toolkit for Academic Success.
+13062052269
info@desklib.com
Available 24*7 on WhatsApp / Email
![[object Object]](/_next/static/media/star-bottom.7253800d.svg)
Unlock your academic potential
Copyright © 2020–2026 A2Z Services. All Rights Reserved. Developed and managed by ZUCOL.