LUBM303 - Business Analytics: Cost, Profit, and Break-Even Analysis
VerifiedAdded on 2022/12/29
|14
|2877
|150
Report
AI Summary
This report provides a comprehensive business analysis focusing on costing decisions within Borehamwood Farms Limited (BF Ltd). It includes a mathematical model to calculate profit/loss, a correlation analysis between advertising expenditure and sales revenue, and a break-even analysis to determine the point at which the company covers its expenses. The report also evaluates the benefits and limitations of the break-even model, offering insights into strategic planning and decision-making. The analysis covers aspects like budgeted annual output, fixed costs, variable costs, and sales prices to provide a holistic view of the company's financial performance. The scatter diagram shows the relationship between advertisement expenditure and sales revenue. It concludes with recommendations for marketing managers to optimize advertising expenditures and boost overall sales/revenue. Desklib offers a variety of solved assignments and past papers for students.

Business Analytic
Paraphrase This Document
Need a fresh take? Get an instant paraphrase of this document with our AI Paraphraser
Table of Contents
Table of Contents.................................................................................................................................2
INTRODUCTION................................................................................................................................3
Question 1.............................................................................................................................................3
Mathematical Model:...................................................................................................................3
Calculate the profit or loss for BF Ltd:........................................................................................3
Draw a graph with a spreadsheet:................................................................................................4
Question 2.............................................................................................................................................5
Analysis:......................................................................................................................................6
Question 3.............................................................................................................................................7
Determine:...................................................................................................................................7
When company’s target profit for the year is £56000:................................................................7
Break even chart:.........................................................................................................................8
Critically analyse the benefits and limitations of the breakeven model:.....................................8
CONCLUSION..................................................................................................................................11
REFERENCES...................................................................................................................................12
INTRODUCTION
Business Predictive is also an approach used by companies to evaluate historical/past
evidence by leveraging analytical instruments and software in order to generate knowledge to
enhance strategic planning (Evans, 2017). The freezers were observed to be holding smaller than
required by several temperatures and therefore to enable higher consumption. Thus, the cost of
power has decreased without impacting healthy food preservation by rising the temperature.
Company owners may benefit from these experiences and use knowledge to better use their
money. Companies of data based goods consider their information as company asset and aim to
beat the competition. Successful enterprise analytics focus on consistency of the data, skilled
researchers who recognize technologies and market, and operational preparation to use
information to construct perspectives that affect strategic choices. The thesis covers numerous
elements of market research and a thoughtful evaluation of the outcomes across various
functional tasks. Successful enterprise analytics focus on consistency of the data, skilled
researchers who recognize technologies and market, and operational preparation to use
information to construct perspectives that affect strategic choices. The thesis covers numerous
elements of market research and a thoughtful evaluation of the outcomes across various
functional tasks.
Question 1
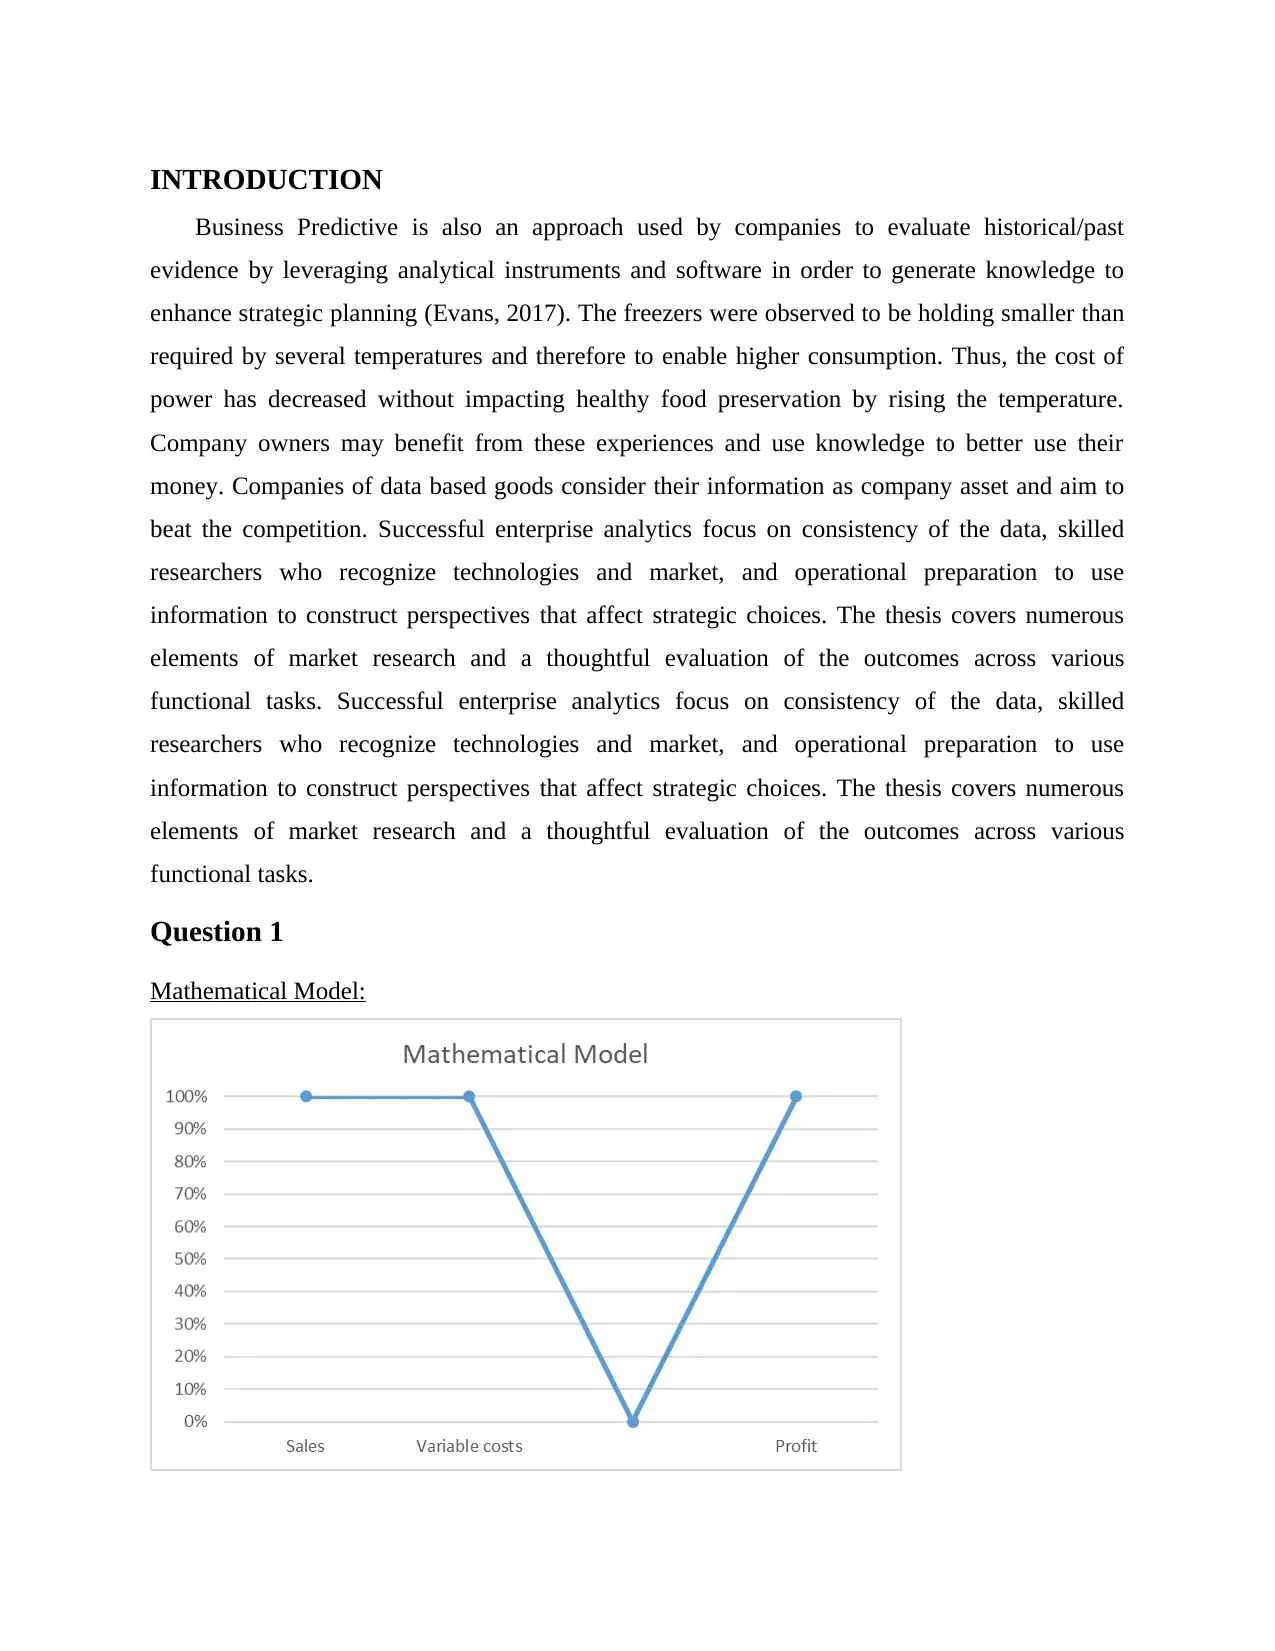
Mathematical Model:
Business Predictive is also an approach used by companies to evaluate historical/past
evidence by leveraging analytical instruments and software in order to generate knowledge to
enhance strategic planning (Evans, 2017). The freezers were observed to be holding smaller than
required by several temperatures and therefore to enable higher consumption. Thus, the cost of
power has decreased without impacting healthy food preservation by rising the temperature.
Company owners may benefit from these experiences and use knowledge to better use their
money. Companies of data based goods consider their information as company asset and aim to
beat the competition. Successful enterprise analytics focus on consistency of the data, skilled
researchers who recognize technologies and market, and operational preparation to use
information to construct perspectives that affect strategic choices. The thesis covers numerous
elements of market research and a thoughtful evaluation of the outcomes across various
functional tasks. Successful enterprise analytics focus on consistency of the data, skilled
researchers who recognize technologies and market, and operational preparation to use
information to construct perspectives that affect strategic choices. The thesis covers numerous
elements of market research and a thoughtful evaluation of the outcomes across various
functional tasks.
Question 1
Mathematical Model:
⊘ This is a preview!⊘
Do you want full access?
Subscribe today to unlock all pages.
Trusted by 1+ million students worldwide
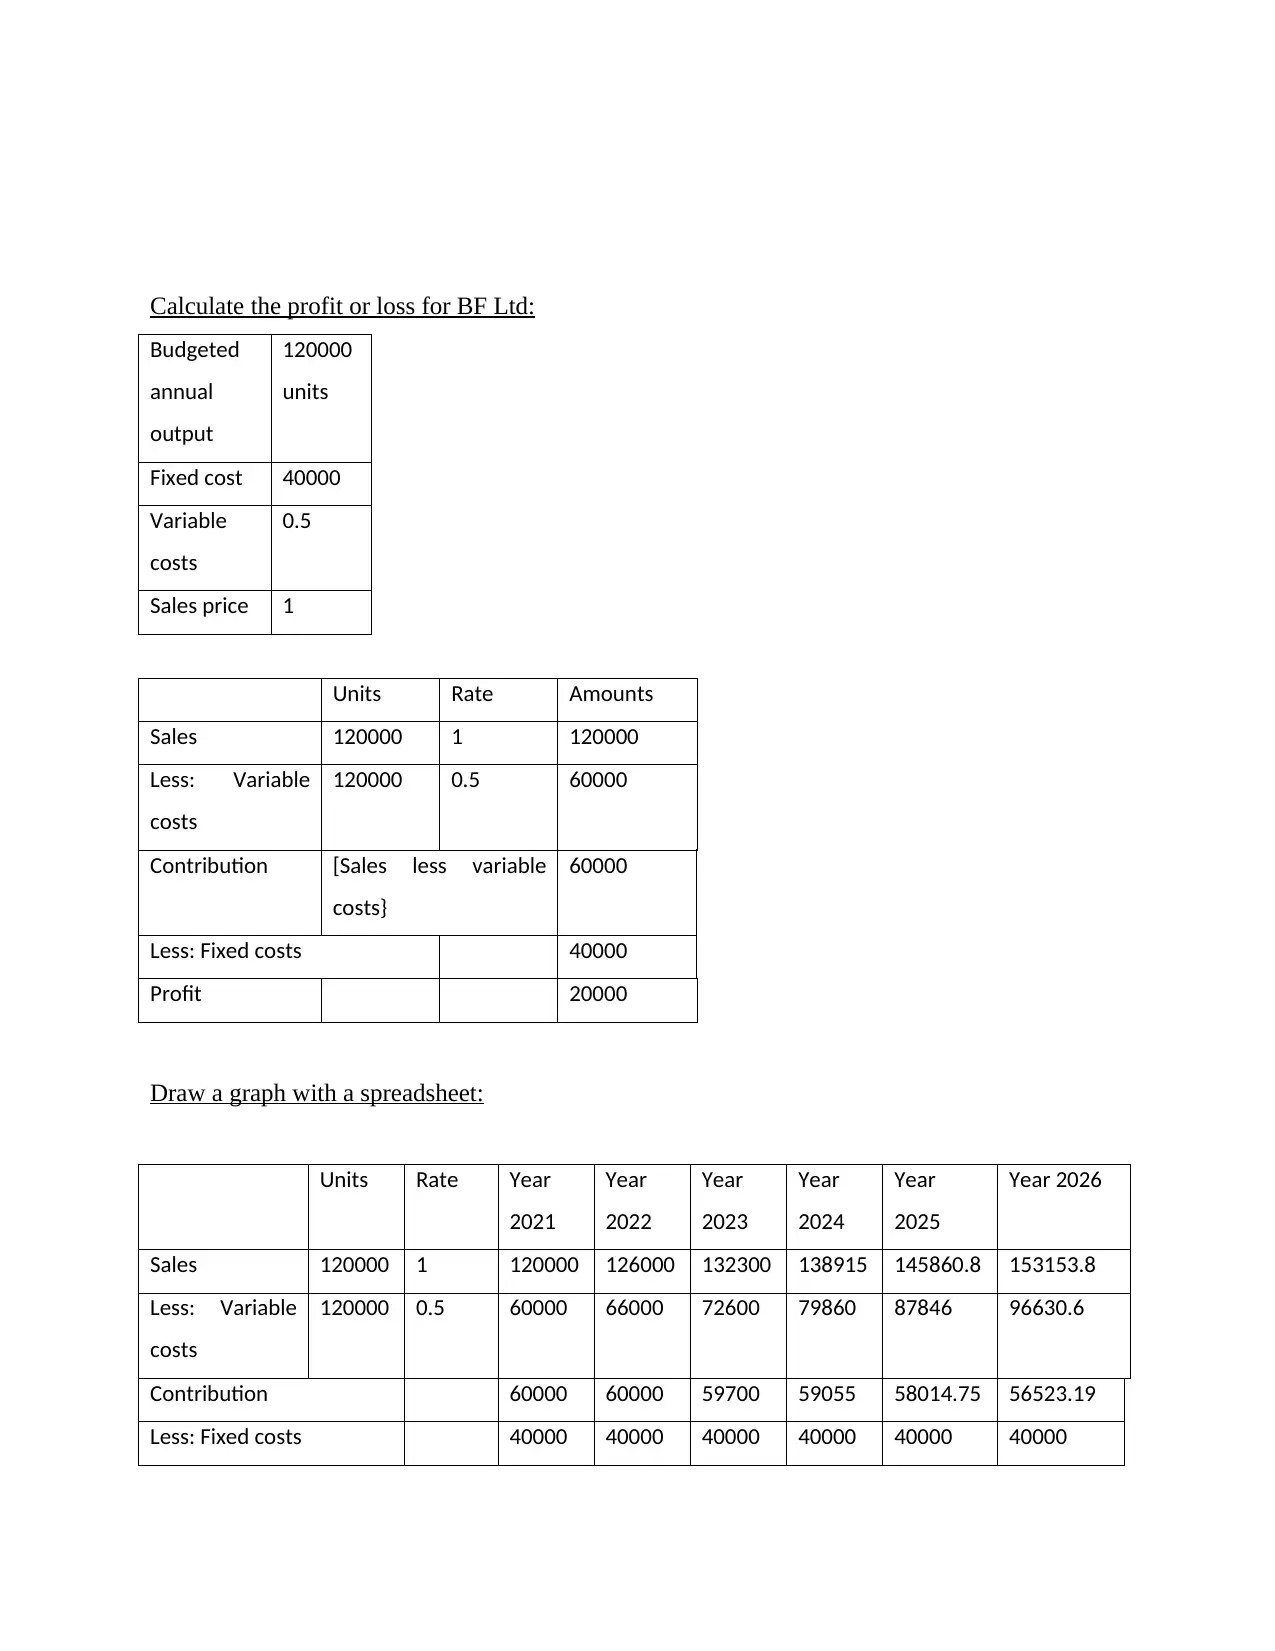
Calculate the profit or loss for BF Ltd:
Budgeted
annual
output
120000
units
Fixed cost 40000
Variable
costs
0.5
Sales price 1
Units Rate Amounts
Sales 120000 1 120000
Less: Variable
costs
120000 0.5 60000
Contribution [Sales less variable
costs}
60000
Less: Fixed costs 40000
Profit 20000
Draw a graph with a spreadsheet:
Units Rate Year
2021
Year
2022
Year
2023
Year
2024
Year
2025
Year 2026
Sales 120000 1 120000 126000 132300 138915 145860.8 153153.8
Less: Variable
costs
120000 0.5 60000 66000 72600 79860 87846 96630.6
Contribution 60000 60000 59700 59055 58014.75 56523.19
Less: Fixed costs 40000 40000 40000 40000 40000 40000
Paraphrase This Document
Need a fresh take? Get an instant paraphrase of this document with our AI Paraphraser
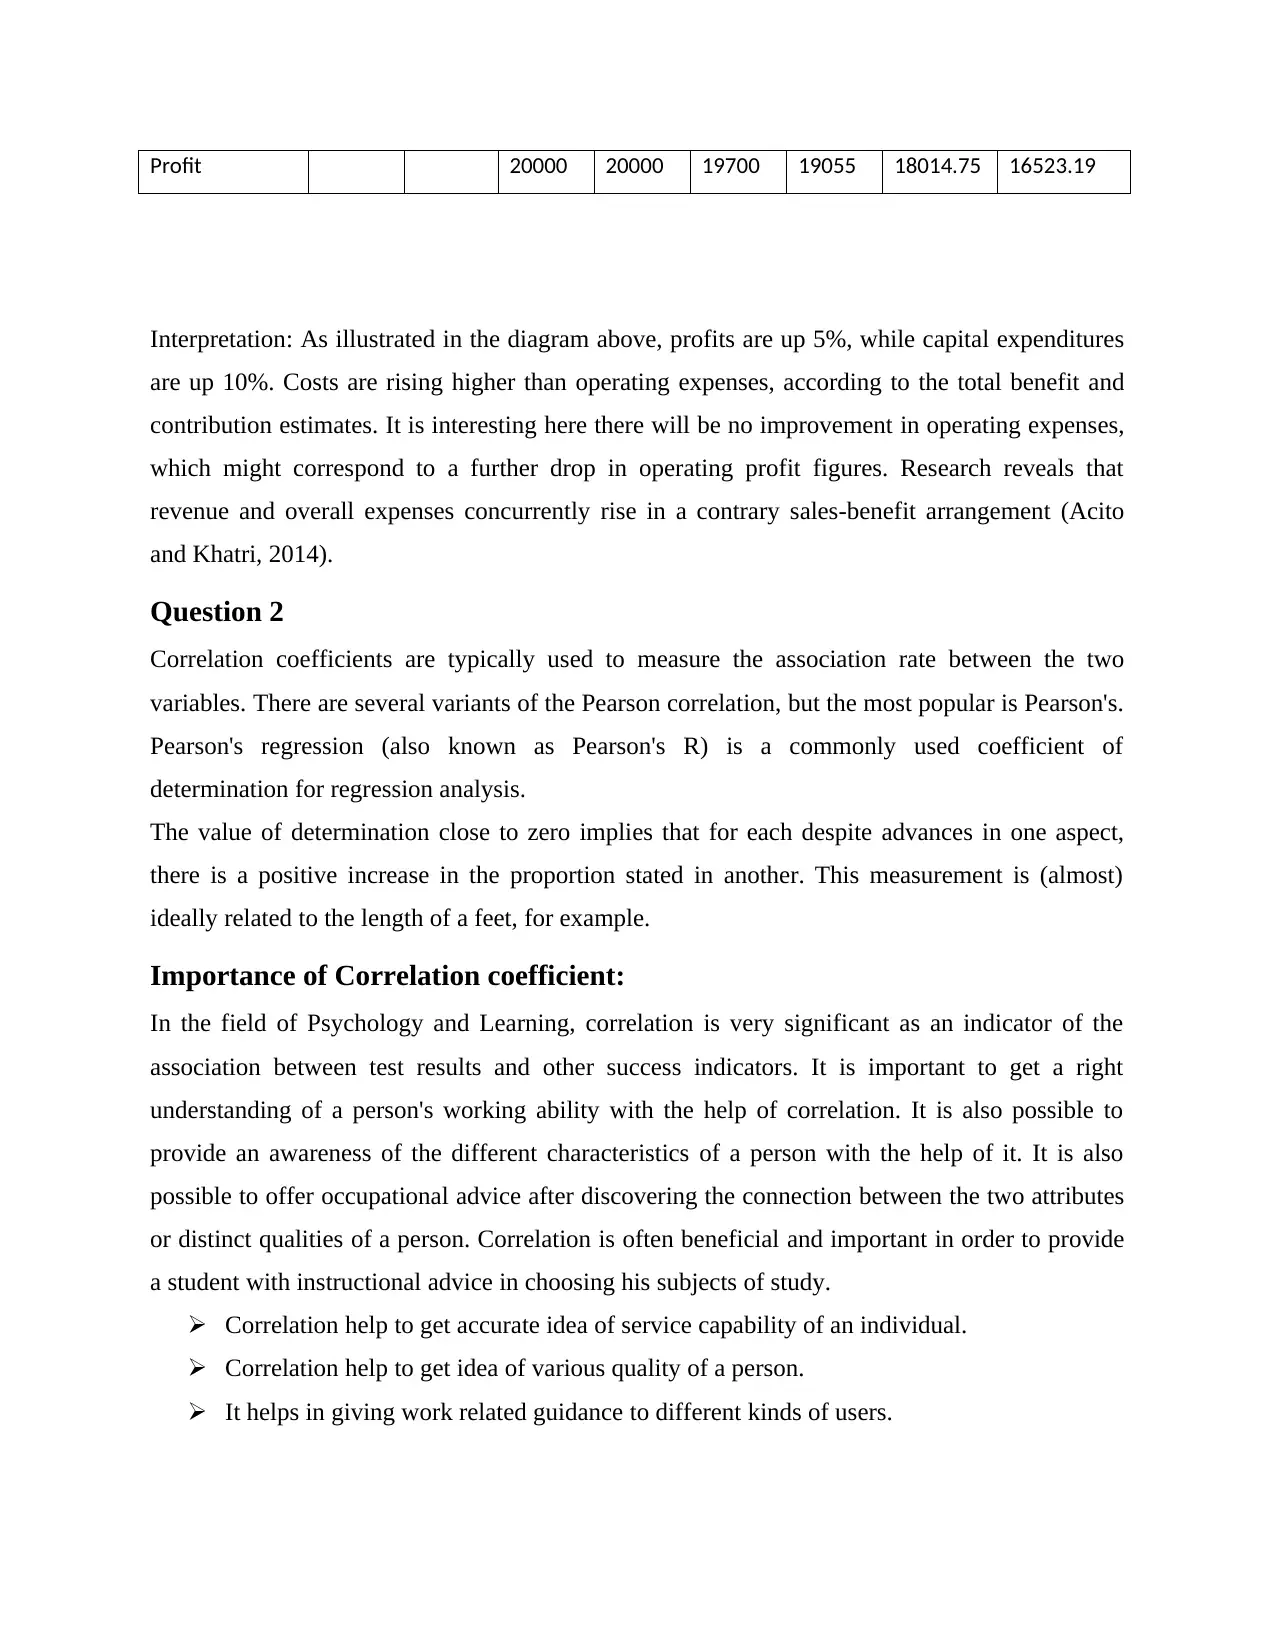
Profit 20000 20000 19700 19055 18014.75 16523.19
Interpretation: As illustrated in the diagram above, profits are up 5%, while capital expenditures
are up 10%. Costs are rising higher than operating expenses, according to the total benefit and
contribution estimates. It is interesting here there will be no improvement in operating expenses,
which might correspond to a further drop in operating profit figures. Research reveals that
revenue and overall expenses concurrently rise in a contrary sales-benefit arrangement (Acito
and Khatri, 2014).
Question 2
Correlation coefficients are typically used to measure the association rate between the two
variables. There are several variants of the Pearson correlation, but the most popular is Pearson's.
Pearson's regression (also known as Pearson's R) is a commonly used coefficient of
determination for regression analysis.
The value of determination close to zero implies that for each despite advances in one aspect,
there is a positive increase in the proportion stated in another. This measurement is (almost)
ideally related to the length of a feet, for example.
Importance of Correlation coefficient:
In the field of Psychology and Learning, correlation is very significant as an indicator of the
association between test results and other success indicators. It is important to get a right
understanding of a person's working ability with the help of correlation. It is also possible to
provide an awareness of the different characteristics of a person with the help of it. It is also
possible to offer occupational advice after discovering the connection between the two attributes
or distinct qualities of a person. Correlation is often beneficial and important in order to provide
a student with instructional advice in choosing his subjects of study.
Correlation help to get accurate idea of service capability of an individual.
Correlation help to get idea of various quality of a person.
It helps in giving work related guidance to different kinds of users.
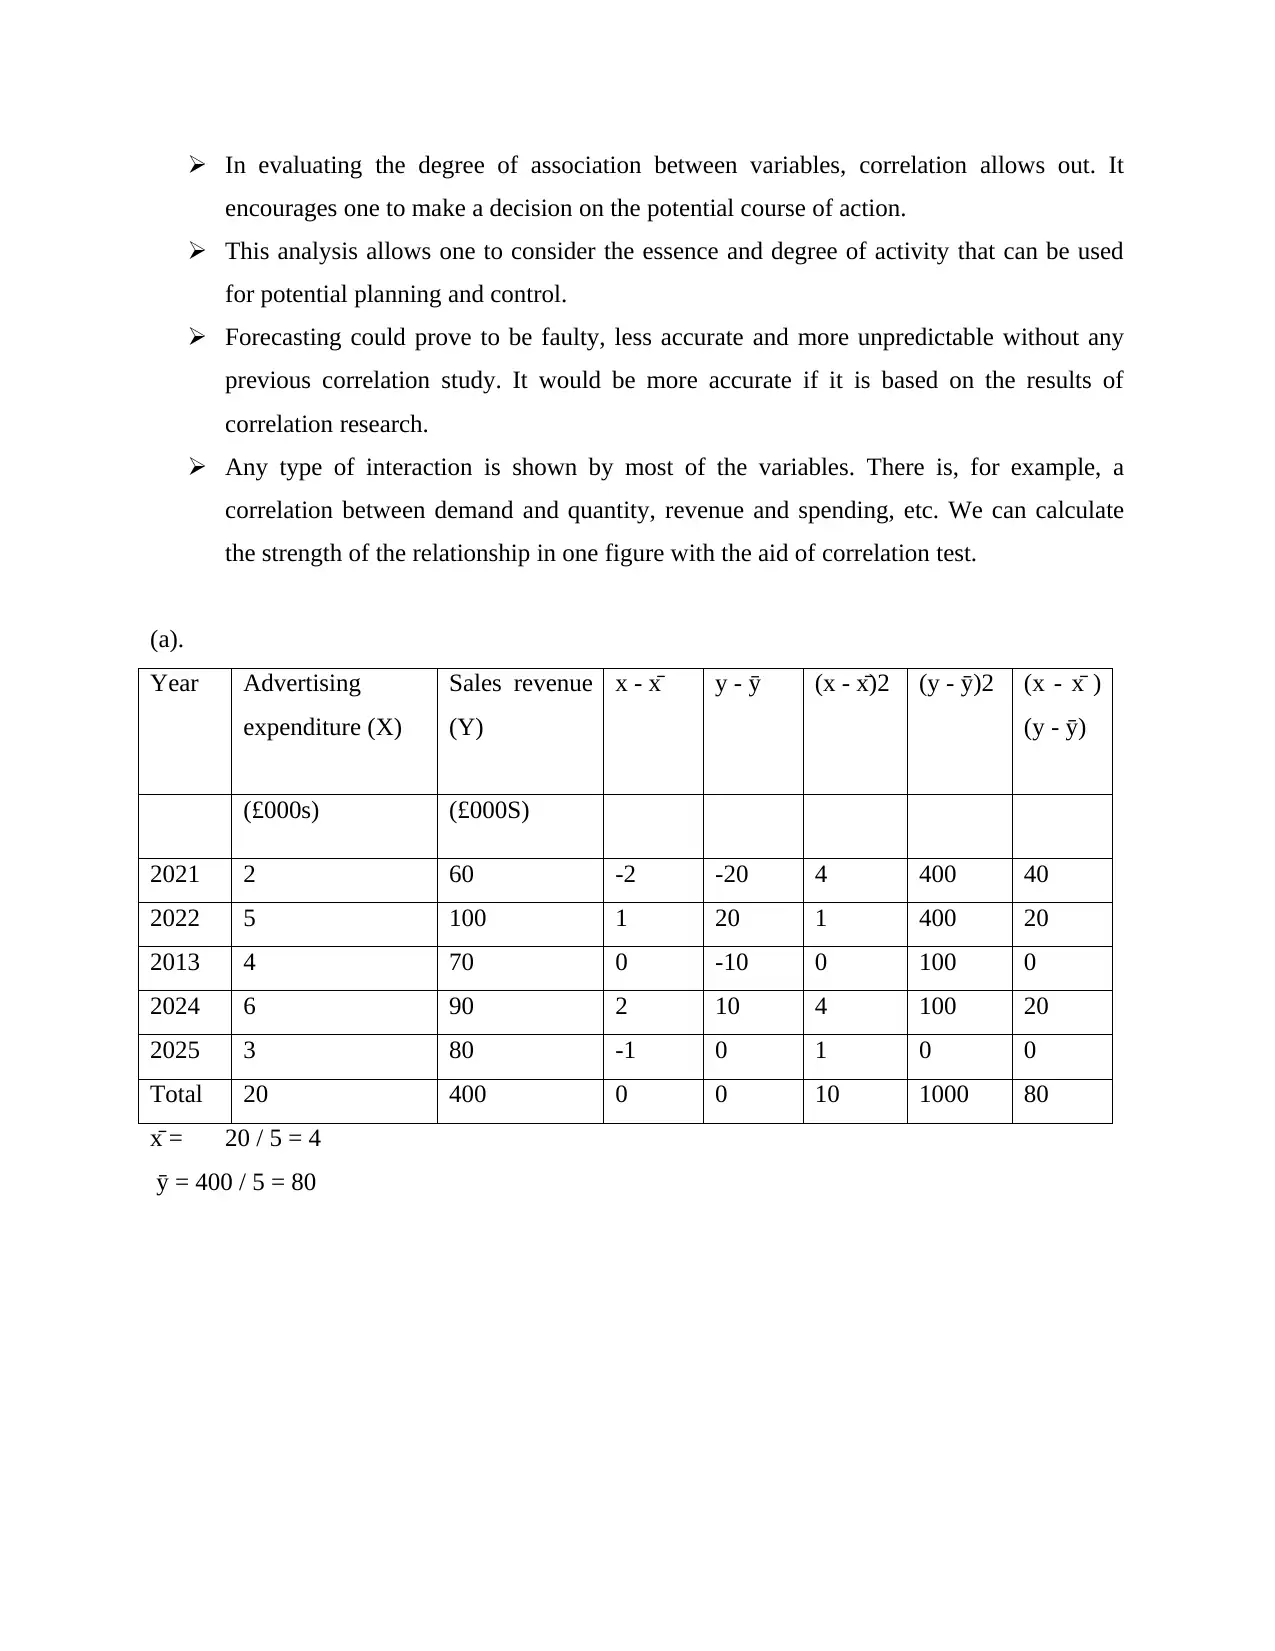
In evaluating the degree of association between variables, correlation allows out. It
encourages one to make a decision on the potential course of action.
This analysis allows one to consider the essence and degree of activity that can be used
for potential planning and control.
Forecasting could prove to be faulty, less accurate and more unpredictable without any
previous correlation study. It would be more accurate if it is based on the results of
correlation research.
Any type of interaction is shown by most of the variables. There is, for example, a
correlation between demand and quantity, revenue and spending, etc. We can calculate
the strength of the relationship in one figure with the aid of correlation test.
(a).
Year Advertising
expenditure (X)
Sales revenue
(Y)
x - x̄ y - ȳ (x - x̄)2 (y - ȳ)2 (x - x̄ )
(y - ȳ)
(£000s) (£000S)
2021 2 60 -2 -20 4 400 40
2022 5 100 1 20 1 400 20
2013 4 70 0 -10 0 100 0
2024 6 90 2 10 4 100 20
2025 3 80 -1 0 1 0 0
Total 20 400 0 0 10 1000 80
x̄ = 20 / 5 = 4
ȳ = 400 / 5 = 80
⊘ This is a preview!⊘
Do you want full access?
Subscribe today to unlock all pages.
Trusted by 1+ million students worldwide
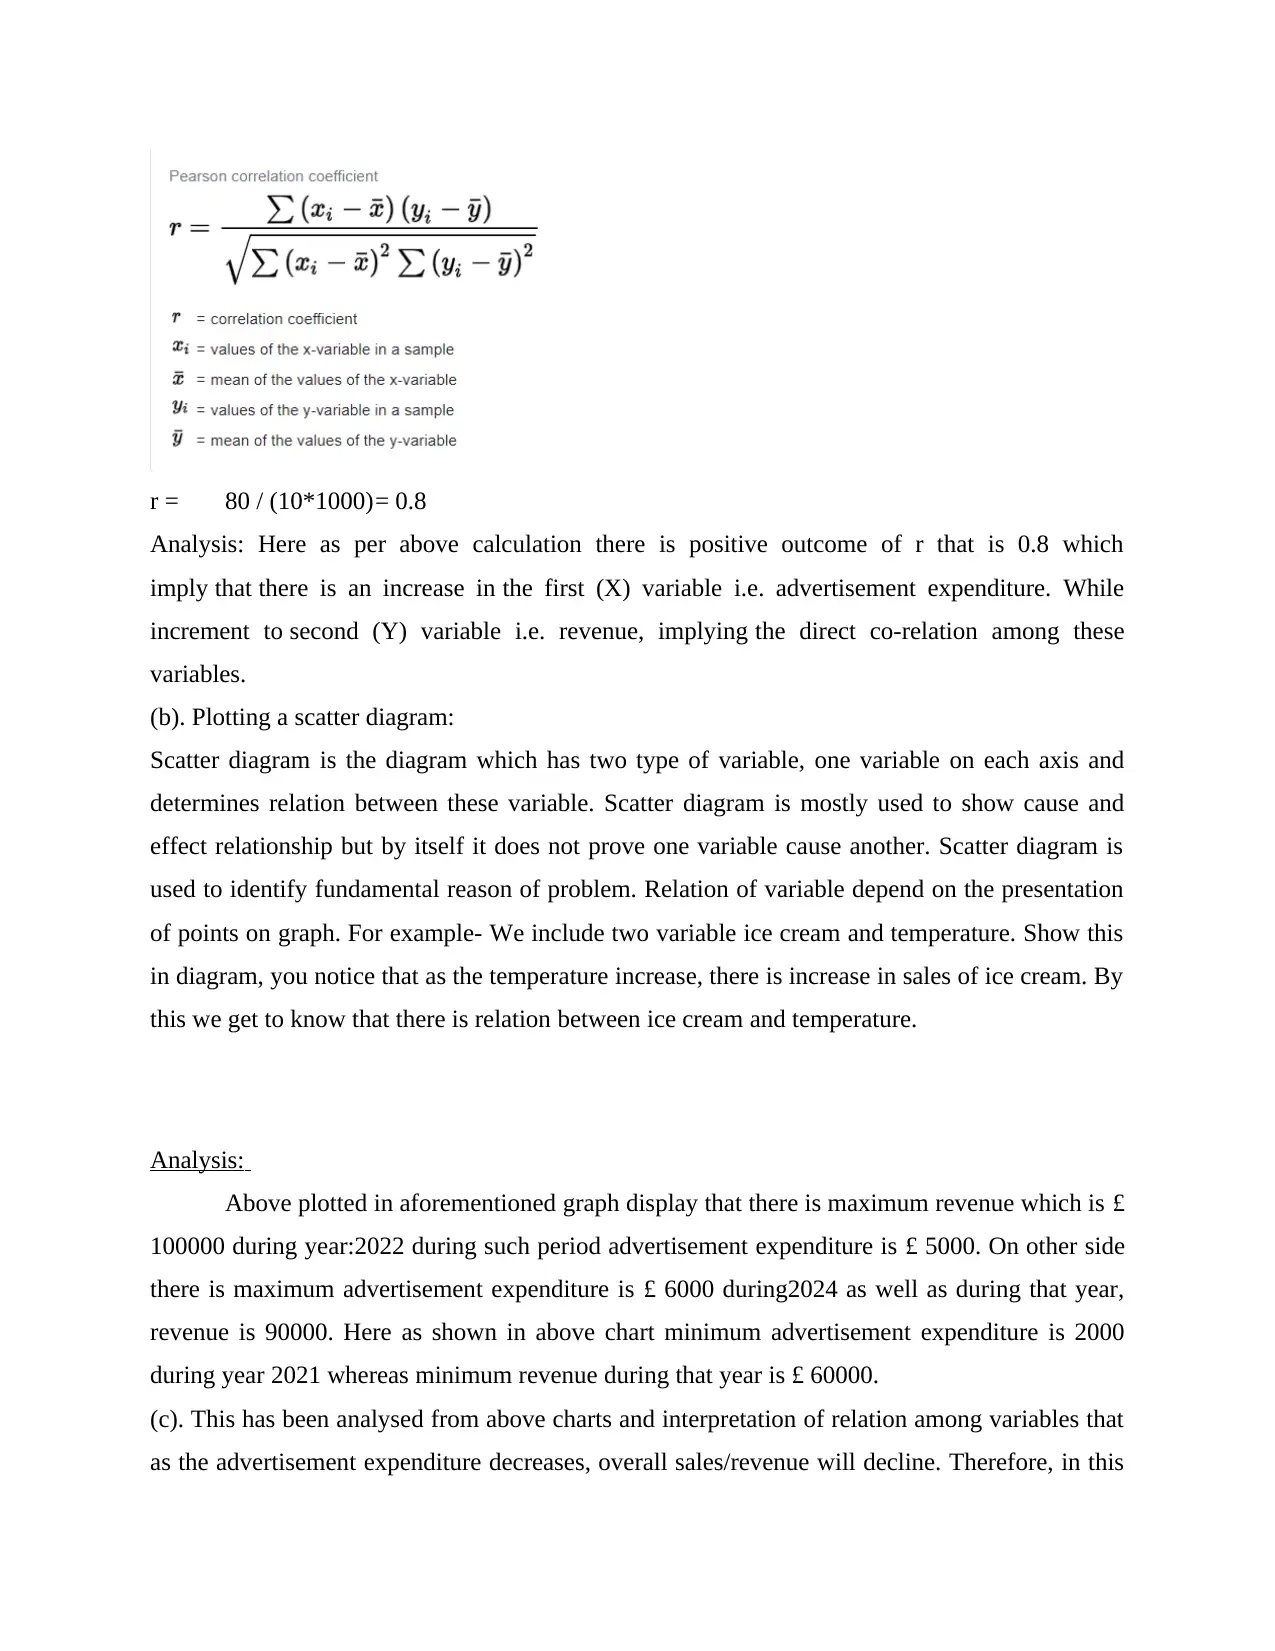
r = 80 / (10*1000)= 0.8
Analysis: Here as per above calculation there is positive outcome of r that is 0.8 which
imply that there is an increase in the first (X) variable i.e. advertisement expenditure. While
increment to second (Y) variable i.e. revenue, implying the direct co-relation among these
variables.
(b). Plotting a scatter diagram:
Scatter diagram is the diagram which has two type of variable, one variable on each axis and
determines relation between these variable. Scatter diagram is mostly used to show cause and
effect relationship but by itself it does not prove one variable cause another. Scatter diagram is
used to identify fundamental reason of problem. Relation of variable depend on the presentation
of points on graph. For example- We include two variable ice cream and temperature. Show this
in diagram, you notice that as the temperature increase, there is increase in sales of ice cream. By
this we get to know that there is relation between ice cream and temperature.
Analysis:
Above plotted in aforementioned graph display that there is maximum revenue which is £
100000 during year:2022 during such period advertisement expenditure is £ 5000. On other side
there is maximum advertisement expenditure is £ 6000 during2024 as well as during that year,
revenue is 90000. Here as shown in above chart minimum advertisement expenditure is 2000
during year 2021 whereas minimum revenue during that year is £ 60000.
(c). This has been analysed from above charts and interpretation of relation among variables that
as the advertisement expenditure decreases, overall sales/revenue will decline. Therefore, in this
Paraphrase This Document
Need a fresh take? Get an instant paraphrase of this document with our AI Paraphraser
case it would be suggested to company's marketing managers that they should emphasise over
controlling advertisement expenditures as well as focus towards replacing current or exiting
strategy of marketing of company in attempt to boost overall sales/revenue. So, Marketing
manager of company is advised to adapt other efficacious marketing tactics/strategy to achieve
competitive benefits/advantages since new marketing tactic/strategy based on above analyses
will assist to minimize their overall advertising expenditures as well as strengthen their
sales/revenue level.
Question 3
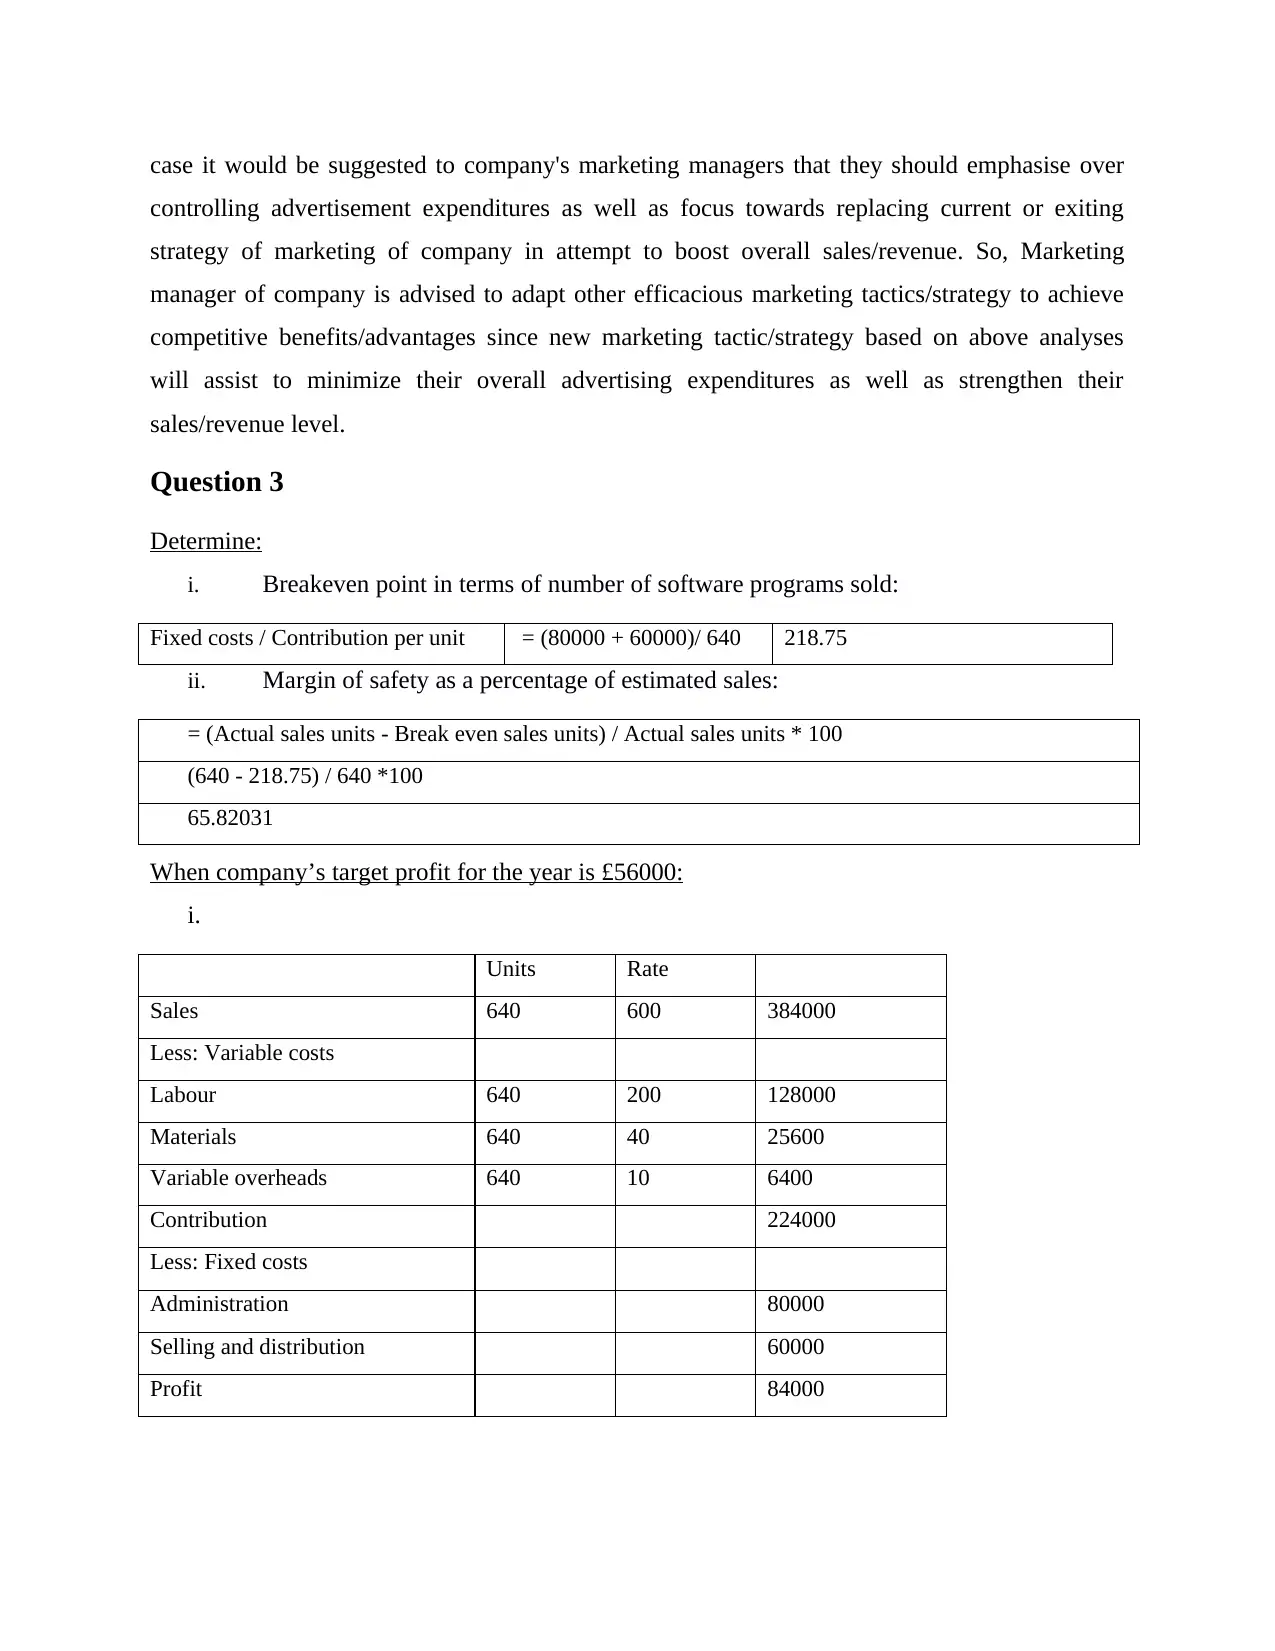
Determine:
i. Breakeven point in terms of number of software programs sold:
Fixed costs / Contribution per unit = (80000 + 60000)/ 640 218.75
ii. Margin of safety as a percentage of estimated sales:
= (Actual sales units - Break even sales units) / Actual sales units * 100
(640 - 218.75) / 640 *100
65.82031
When company’s target profit for the year is £56000:
i.
Units Rate
Sales 640 600 384000
Less: Variable costs
Labour 640 200 128000
Materials 640 40 25600
Variable overheads 640 10 6400
Contribution 224000
Less: Fixed costs
Administration 80000
Selling and distribution 60000
Profit 84000
controlling advertisement expenditures as well as focus towards replacing current or exiting
strategy of marketing of company in attempt to boost overall sales/revenue. So, Marketing
manager of company is advised to adapt other efficacious marketing tactics/strategy to achieve
competitive benefits/advantages since new marketing tactic/strategy based on above analyses
will assist to minimize their overall advertising expenditures as well as strengthen their
sales/revenue level.
Question 3
Determine:
i. Breakeven point in terms of number of software programs sold:
Fixed costs / Contribution per unit = (80000 + 60000)/ 640 218.75
ii. Margin of safety as a percentage of estimated sales:
= (Actual sales units - Break even sales units) / Actual sales units * 100
(640 - 218.75) / 640 *100
65.82031
When company’s target profit for the year is £56000:
i.
Units Rate
Sales 640 600 384000
Less: Variable costs
Labour 640 200 128000
Materials 640 40 25600
Variable overheads 640 10 6400
Contribution 224000
Less: Fixed costs
Administration 80000
Selling and distribution 60000
Profit 84000
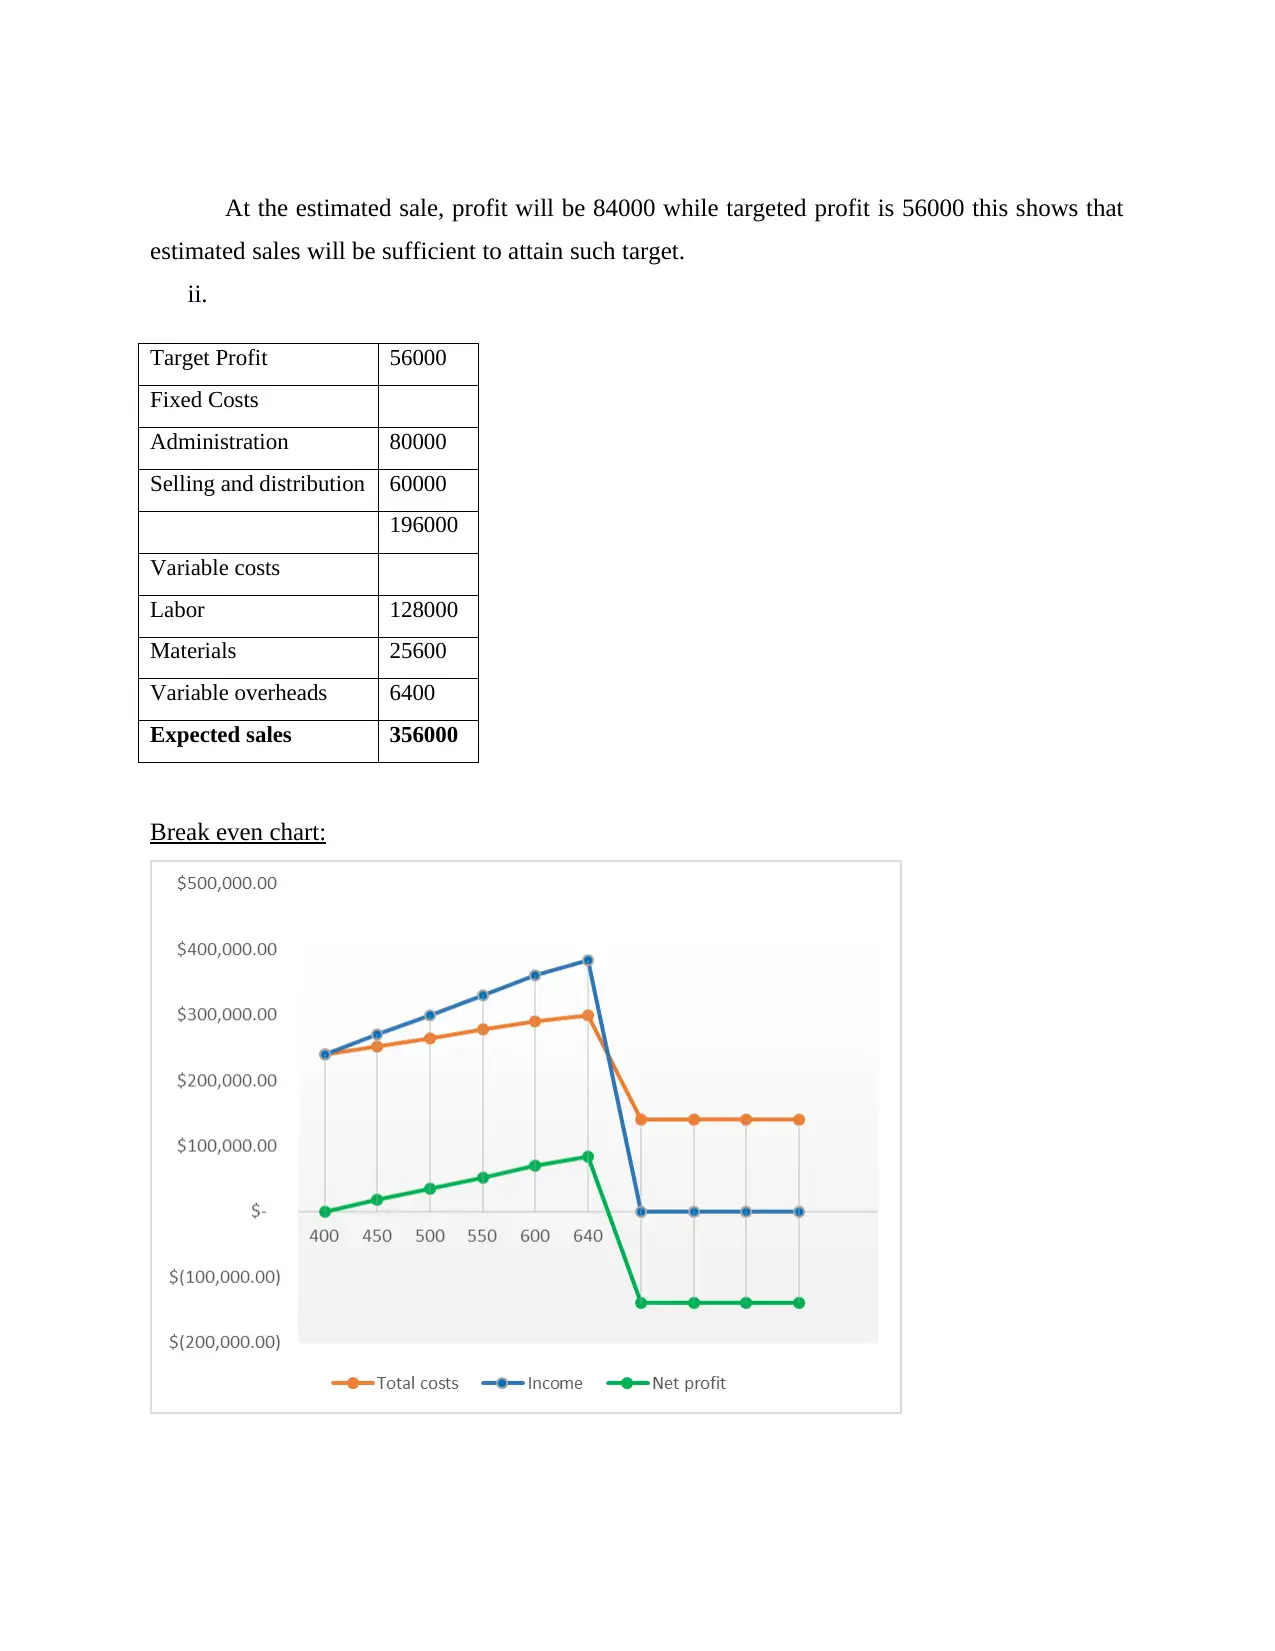
At the estimated sale, profit will be 84000 while targeted profit is 56000 this shows that
estimated sales will be sufficient to attain such target.
ii.
Target Profit 56000
Fixed Costs
Administration 80000
Selling and distribution 60000
196000
Variable costs
Labor 128000
Materials 25600
Variable overheads 6400
Expected sales 356000
Break even chart:
estimated sales will be sufficient to attain such target.
ii.
Target Profit 56000
Fixed Costs
Administration 80000
Selling and distribution 60000
196000
Variable costs
Labor 128000
Materials 25600
Variable overheads 6400
Expected sales 356000
Break even chart:
⊘ This is a preview!⊘
Do you want full access?
Subscribe today to unlock all pages.
Trusted by 1+ million students worldwide

Critically analyse the benefits and limitations of the breakeven model:
An analytical instrument for evaluating a company's cost organisation or the amount of
capital to sell in order to cover the expense is a break-even study. Break-even is a scenario in
which a systems create no income or expense but recoups all of the revenue that has been
invested. The relationship between fixed costs, variable costs and sales is analysed by a break-
even review. Usually, a lower mortgage cost company has a low sales point. Break-even
measurement is a very critical and useful way of reporting and tracking financially. In order to
minimise fraud, finance firms have continued to use analytics. One approach would be to use the
information on past consumer sales to detect possible unauthorised purchases. In order to analyse
consumer profiles and determine the risk intensity, these organisations often use prediction
analysis. This seeks to assess the risk presented by a given client in order to reduce risks and to
create better partnerships. Advertising is costly; advertisers also need to think about making the
highest investment return. Therefore, methodological approaches such as split-testing A / B and
C are used. Both email addresses, pop-ups and sometimes even product images are modified and
tested for the best performance in respect to online ads. In order to find the right spot for further
effort and revenue, only the way goods are placed mostly on website is analysed. Minimize or
delete the use of special offers and perhaps other cost reductions, given the increased income
from such promotions. Implementation of any technology that can improve business
performance and therefore increase capacity without additional costs. It may certainly help to
periodically monitor all operating expenses in order to check whether any can be eradicated.
Evaluate the variable costs to determine whether these can be removed. This analysis increases
the percentage and reduces the gap. Drive sales of the biggest amount (high contribution profit)
products to sales revenue and reduce breakthroughs.
These expenses are often referred to as capital expenses. Such costs occur when an economy
begins its business statements. Tax, salary, rent, depreciation, labour costs, interest and energy
costs are also included in the guaranteed rate. The cost varies, well according to the amount of
activity, decreases or increases. This cost includes of containers, raw materials, gasoline or other
manufacturing material. A break even test is a financial instrument that helps a corporation to
describe the validity of a profitability for the enterprise, a new positive addition. This is, in many
other words, a monetary measurement for the range of products as well as services that an
enterprise must sell or supply to finance its operations (particularly fixed costs). Break-even is
Paraphrase This Document
Need a fresh take? Get an instant paraphrase of this document with our AI Paraphraser
indeed a circumstance in which an institution does not make or lose money which was subject to
all costs.
The benefits of break-even evaluation are given in the following:
The business or owner knows how many units are to be delivered to cover the expense
with the aid of the breakdown report. In order to assess break-even analysis, certain
variable costs and sale price of a commodity and the overall costs are necessary.
Given that an organisation or owner knows how much an organisation will break down, it
allows for them both to made decisions and budget the business accordingly. It is also
used to evaluate a reasonable objective for an organisation. Sales of a business tend to fall
in the financial crisis. The break-even calculation allows the organisation to determine
the lowest amount of income. The management will make a high business option with the
parameter of the protection survey.
If there are shifts in the price of a commodity, a break-even stage may be impacted. If, for
instance, the demand for a good to be sold is increased, the amount would be decreased -
even. Similarly, a business must sell more goods to break-even if the sale price is cut.
This analysis allows two choices to be determined and bought. If variable costs are larger
than the amount payable to external suppliers, production can be less costly than
purchasing.
C-V-P aims at preparing goods production with the best benefit and fixed costs
contribution.
The C-V-P assessment can be used as a cost control method to track insidious upwards
cost shifts that are otherwise ignored (Wixom, Yen and Relich, 2013).
Study in break-even includes an interpretation of income-related practises for
development. This knowledge is important to the growth of the financial system of an
organisation.
The break-even analysis given valuable managers with knowledge, which is useful for
planning processes, where a reasonable basis with personal analysis is accessible.
By using this form, the following disadvantages in the break-even assessment must be taken
into account:
Some prices, and their components, are not adequately categorized into fixed or variable
cost types, since they include all sorts of functionality.
When a business sells a range of products, the accounting specialist needs to schedule
and analyze the amount of earnings from combined separate operations units.
A break-even map reveals a staggering short-term correlation between development and
expense and becomes very quickly obsolete.
Both phases of activities benefit from the link seen on the break-even diagram. The costs
are higher than the dynamic breaking even chart, although the production of the project is
approximately 100% of its effectiveness (Duan and Xiong, 2015).
Assumptions of BEP:
There are two types of cost in BEP which are fixed cost and variable cost.
Fixed cost should be same for all level of quantity of output.
Variable cost may vary at different level of output.
The selling price of product will be unchanged.
The product mix will be constant.
Volume of production and sales are equal as there is opening and closing inventory.
There is no change in technology.
There is no change in labour efficiency.
The factor price is remaining constant.
There is no change in input price.
CONCLUSION
From above study this has been analysed that Market analytics is a systematic, iterative
examination of business information with such an emphasis on mathematical modelling. The
intelligence of companies is used by companies which implement decision-making based on
research. It is not really just workers who are effective. Businesses should also evaluate other
⊘ This is a preview!⊘
Do you want full access?
Subscribe today to unlock all pages.
Trusted by 1+ million students worldwide
1 out of 14
Related Documents


Your All-in-One AI-Powered Toolkit for Academic Success.
+13062052269
info@desklib.com
Available 24*7 on WhatsApp / Email
![[object Object]](/_next/static/media/star-bottom.7253800d.svg)
Unlock your academic potential
Copyright © 2020–2026 A2Z Services. All Rights Reserved. Developed and managed by ZUCOL.