LUBM303 - Business Analytics: Costing, Revenue, and Data Correlation
VerifiedAdded on 2023/06/18
|16
|3752
|256
Report
AI Summary
This report provides a comprehensive analysis of various business analytics concepts. It includes a mathematical model for cost calculation, profit/loss analysis, and a 5-year projection using spreadsheets. The costing and revenue behavior of Marko farms limited (MK Ltd.) are analyzed, focusing on fixed and variable costs. Furthermore, the report calculates the correlation between advertising expenses and sales revenue for Jump-Well Limited (JWL), discussing the impact of advertising on organizational performance. Finally, it determines the break-even point and margin of safety for BAX Plc, providing insights into sales volume targets and profitability. Desklib offers a wide range of similar solved assignments and past papers for students.
Business Analytic
Paraphrase This Document
Need a fresh take? Get an instant paraphrase of this document with our AI Paraphraser
TABLE OF CONTENTS
QUESTION 1...................................................................................................................................3
a) Developing a mathematical model by using cost information................................................3
b) Calculating the profit or loss...................................................................................................3
c) Drawing graph with spreadsheet for 5-year projection...........................................................4
d) Analysing costing and revenue behaviour..............................................................................5
QUESTION 2...................................................................................................................................6
a)..................................................................................................................................................6
calculating correlation.................................................................................................................6
b).................................................................................................................................................7
c)..................................................................................................................................................9
QUESTION 3.................................................................................................................................10
a) Determining breakeven point & margin of safety................................................................10
b) Discussing sales volume to achieve target and evaluating sales volume that will neither
cause profit nor loss..................................................................................................................12
c.................................................................................................................................................12
e)................................................................................................................................................12
REFERENCES..............................................................................................................................15
QUESTION 1
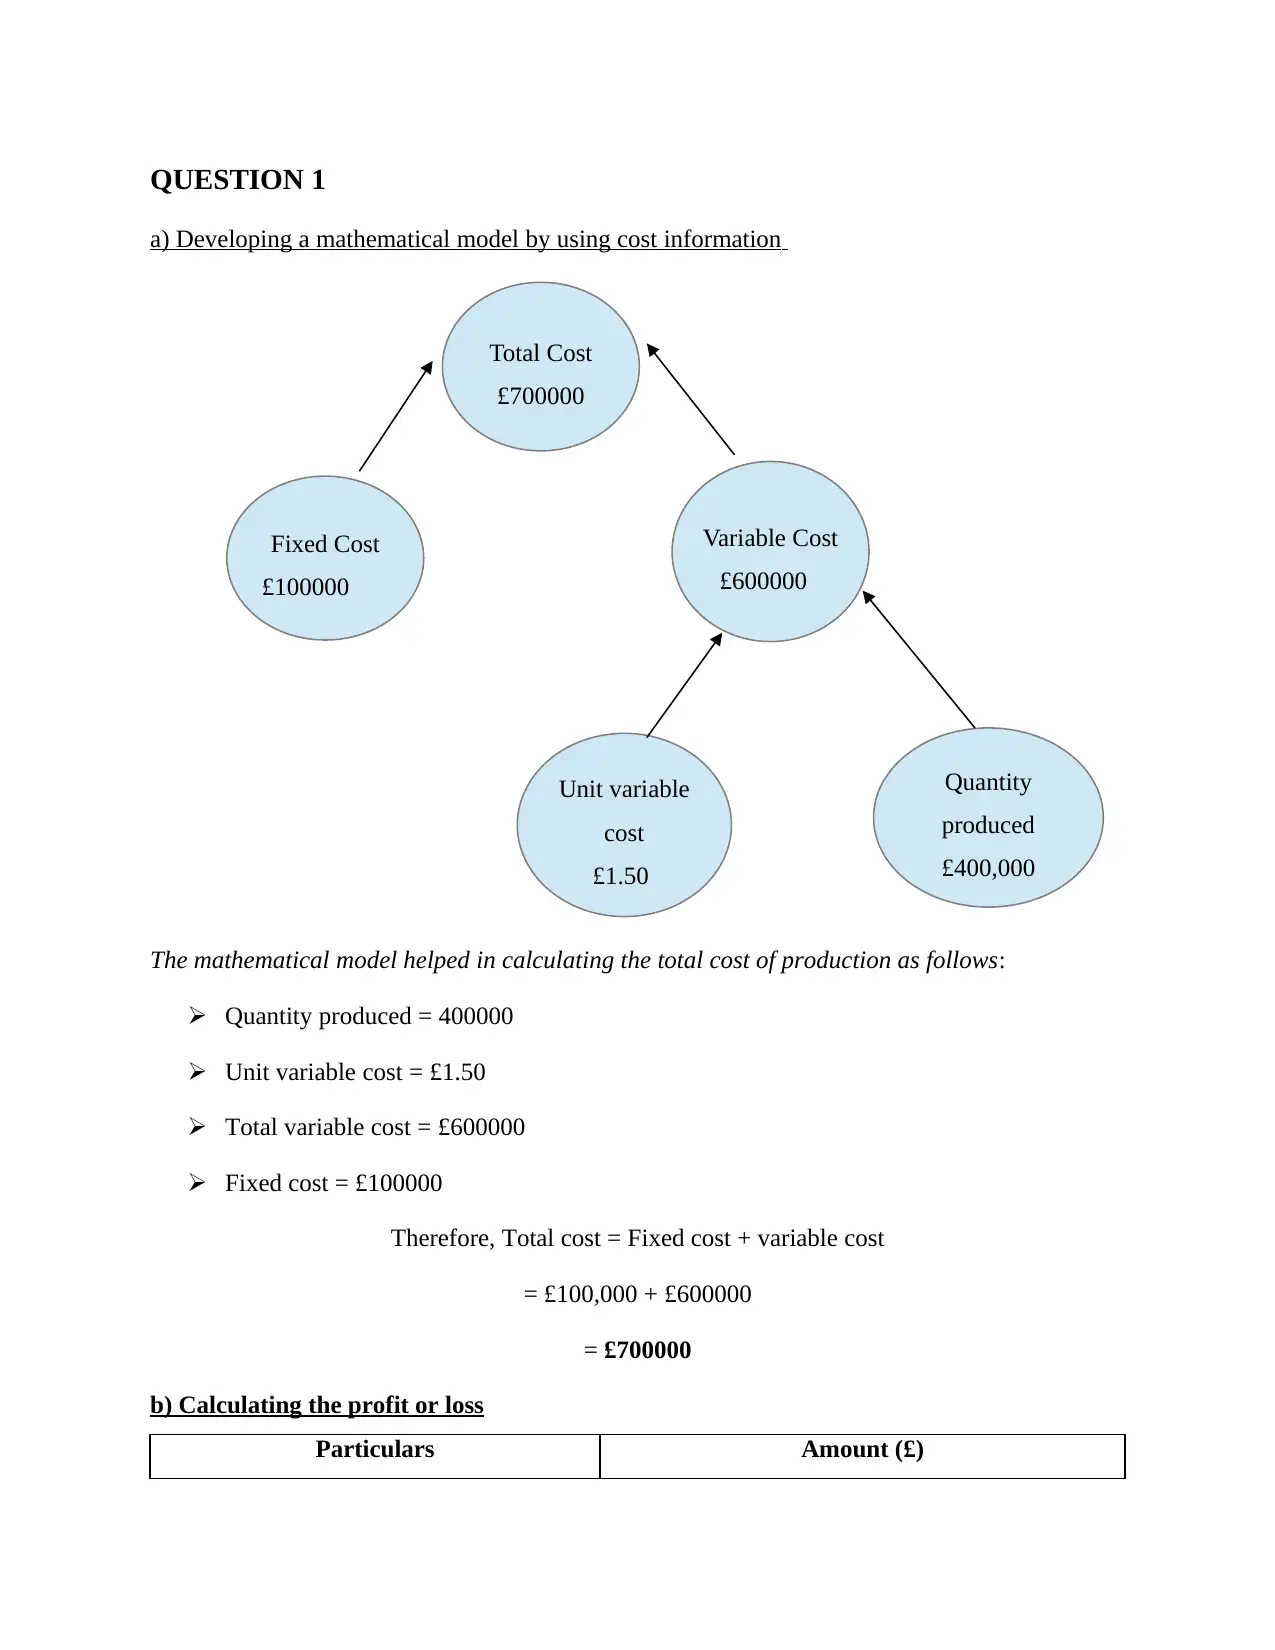
a) Developing a mathematical model by using cost information
The mathematical model helped in calculating the total cost of production as follows:
Quantity produced = 400000
Unit variable cost = £1.50
Total variable cost = £600000
Fixed cost = £100000
Therefore, Total cost = Fixed cost + variable cost
= £100,000 + £600000
= £700000
b) Calculating the profit or loss
Particulars Amount (£)
Total Cost
£700000
Unit variable
cost
£1.50
Fixed Cost
£100000
Quantity
produced
£400,000
Variable Cost
£600000
⊘ This is a preview!⊘
Do you want full access?
Subscribe today to unlock all pages.
Trusted by 1+ million students worldwide
Annual Output 400000
Fixed cost 100000
Variable cost 600000
Total cost 700000
Selling price 3
Total sales 1200000
Profit 500000
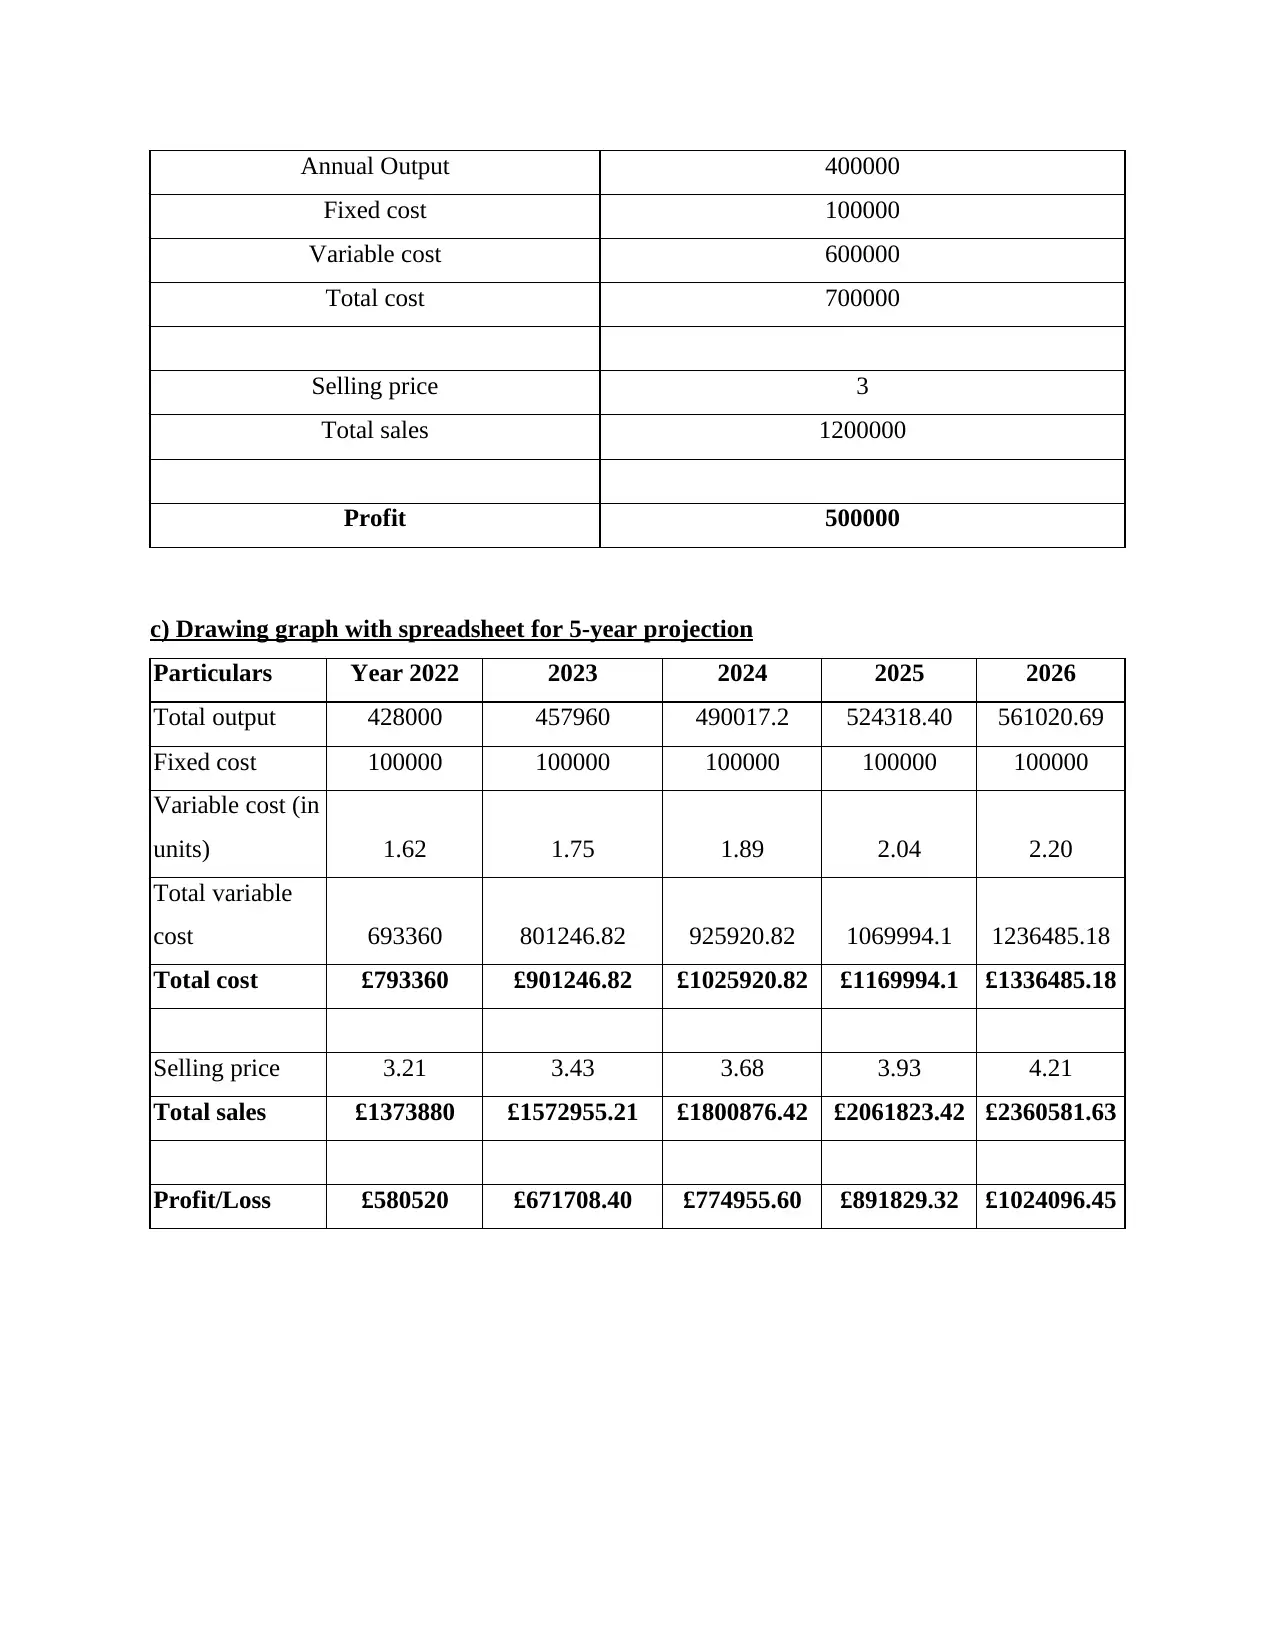
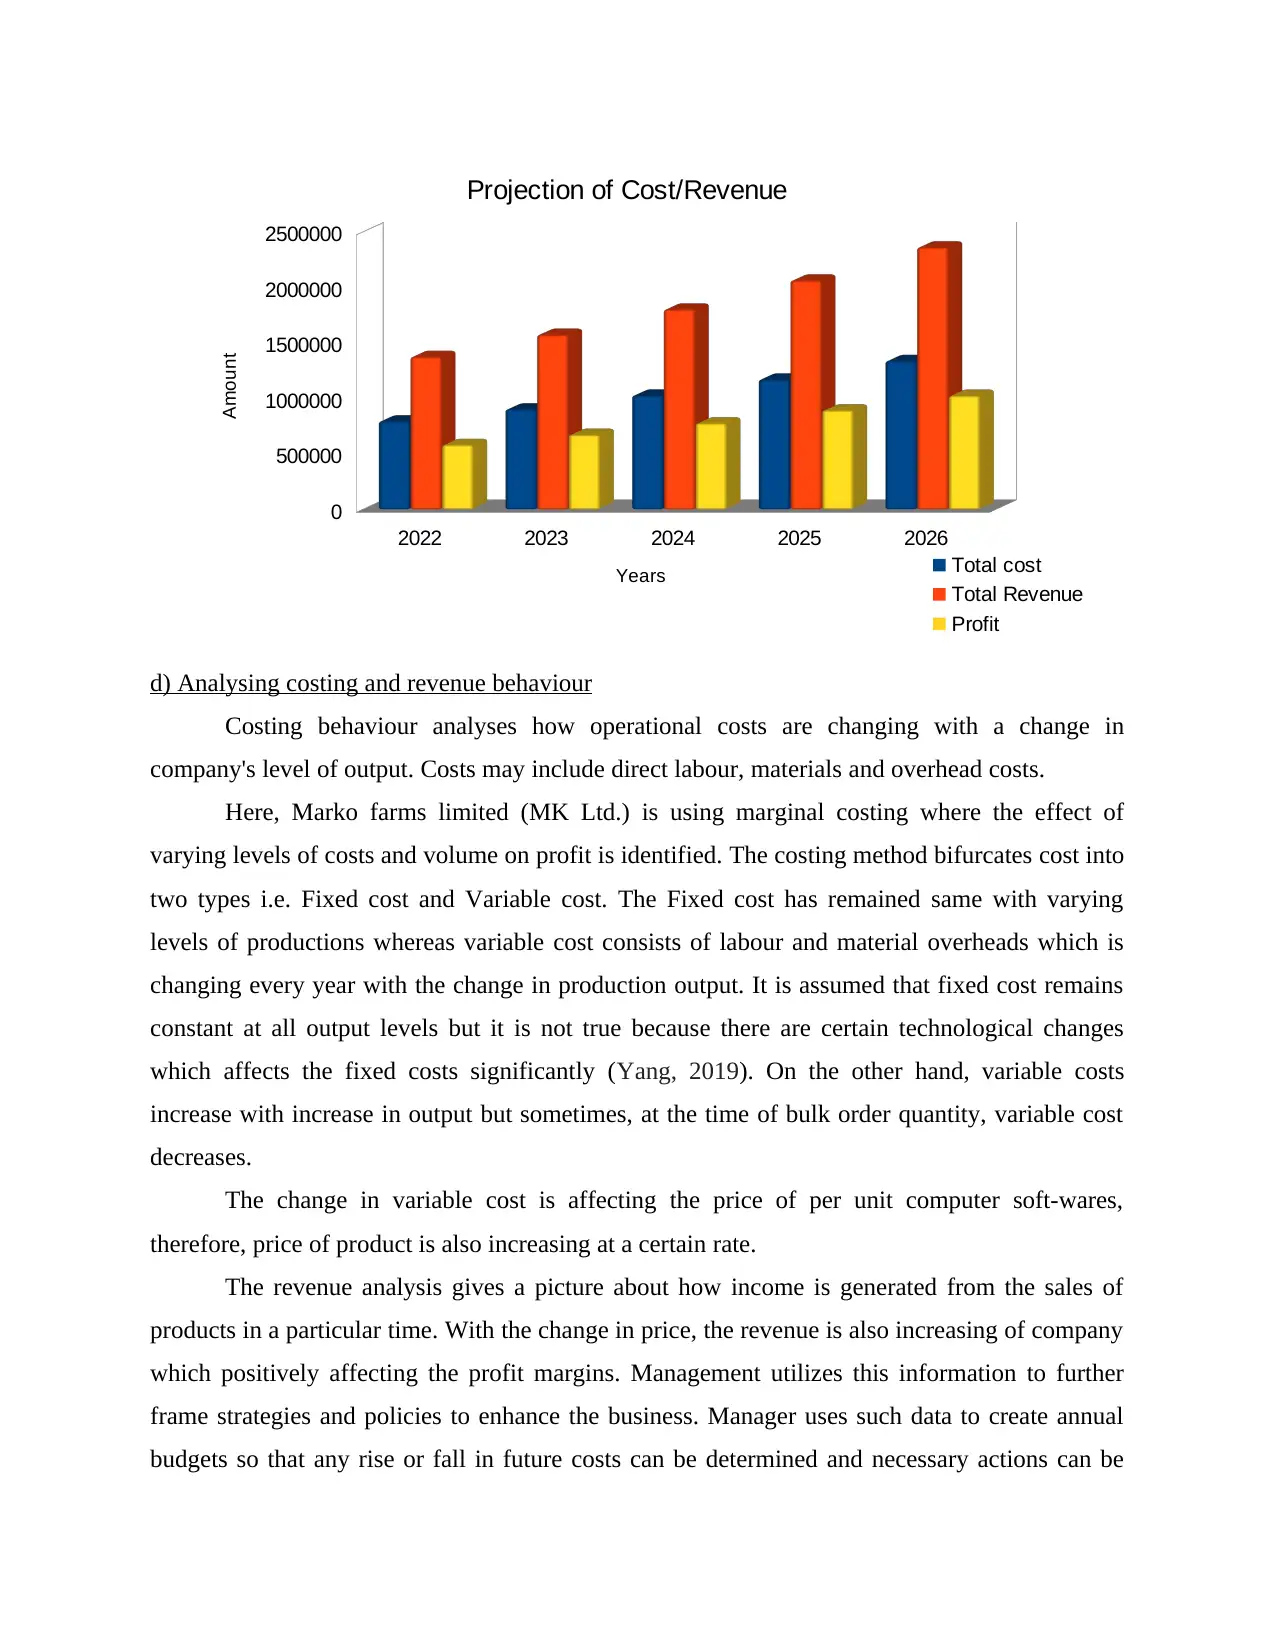
c) Drawing graph with spreadsheet for 5-year projection
Particulars Year 2022 2023 2024 2025 2026
Total output 428000 457960 490017.2 524318.40 561020.69
Fixed cost 100000 100000 100000 100000 100000
Variable cost (in
units) 1.62 1.75 1.89 2.04 2.20
Total variable
cost 693360 801246.82 925920.82 1069994.1 1236485.18
Total cost £793360 £901246.82 £1025920.82 £1169994.1 £1336485.18
Selling price 3.21 3.43 3.68 3.93 4.21
Total sales £1373880 £1572955.21 £1800876.42 £2061823.42 £2360581.63
Profit/Loss £580520 £671708.40 £774955.60 £891829.32 £1024096.45
Fixed cost 100000
Variable cost 600000
Total cost 700000
Selling price 3
Total sales 1200000
Profit 500000
c) Drawing graph with spreadsheet for 5-year projection
Particulars Year 2022 2023 2024 2025 2026
Total output 428000 457960 490017.2 524318.40 561020.69
Fixed cost 100000 100000 100000 100000 100000
Variable cost (in
units) 1.62 1.75 1.89 2.04 2.20
Total variable
cost 693360 801246.82 925920.82 1069994.1 1236485.18
Total cost £793360 £901246.82 £1025920.82 £1169994.1 £1336485.18
Selling price 3.21 3.43 3.68 3.93 4.21
Total sales £1373880 £1572955.21 £1800876.42 £2061823.42 £2360581.63
Profit/Loss £580520 £671708.40 £774955.60 £891829.32 £1024096.45
Paraphrase This Document
Need a fresh take? Get an instant paraphrase of this document with our AI Paraphraser
2022 2023 2024 2025 2026
0
500000
1000000
1500000
2000000
2500000
Projection of Cost/Revenue
Total cost
Total Revenue
Profit
Years
Amount
d) Analysing costing and revenue behaviour
Costing behaviour analyses how operational costs are changing with a change in
company's level of output. Costs may include direct labour, materials and overhead costs.
Here, Marko farms limited (MK Ltd.) is using marginal costing where the effect of
varying levels of costs and volume on profit is identified. The costing method bifurcates cost into
two types i.e. Fixed cost and Variable cost. The Fixed cost has remained same with varying
levels of productions whereas variable cost consists of labour and material overheads which is
changing every year with the change in production output. It is assumed that fixed cost remains
constant at all output levels but it is not true because there are certain technological changes
which affects the fixed costs significantly (Yang, 2019). On the other hand, variable costs
increase with increase in output but sometimes, at the time of bulk order quantity, variable cost
decreases.
The change in variable cost is affecting the price of per unit computer soft-wares,
therefore, price of product is also increasing at a certain rate.
The revenue analysis gives a picture about how income is generated from the sales of
products in a particular time. With the change in price, the revenue is also increasing of company
which positively affecting the profit margins. Management utilizes this information to further
frame strategies and policies to enhance the business. Manager uses such data to create annual
budgets so that any rise or fall in future costs can be determined and necessary actions can be
taken to solve issues. It is an important planning, forecasting and controlling tool which helps
business to avoid instability in operations.
QUESTION 2
a)
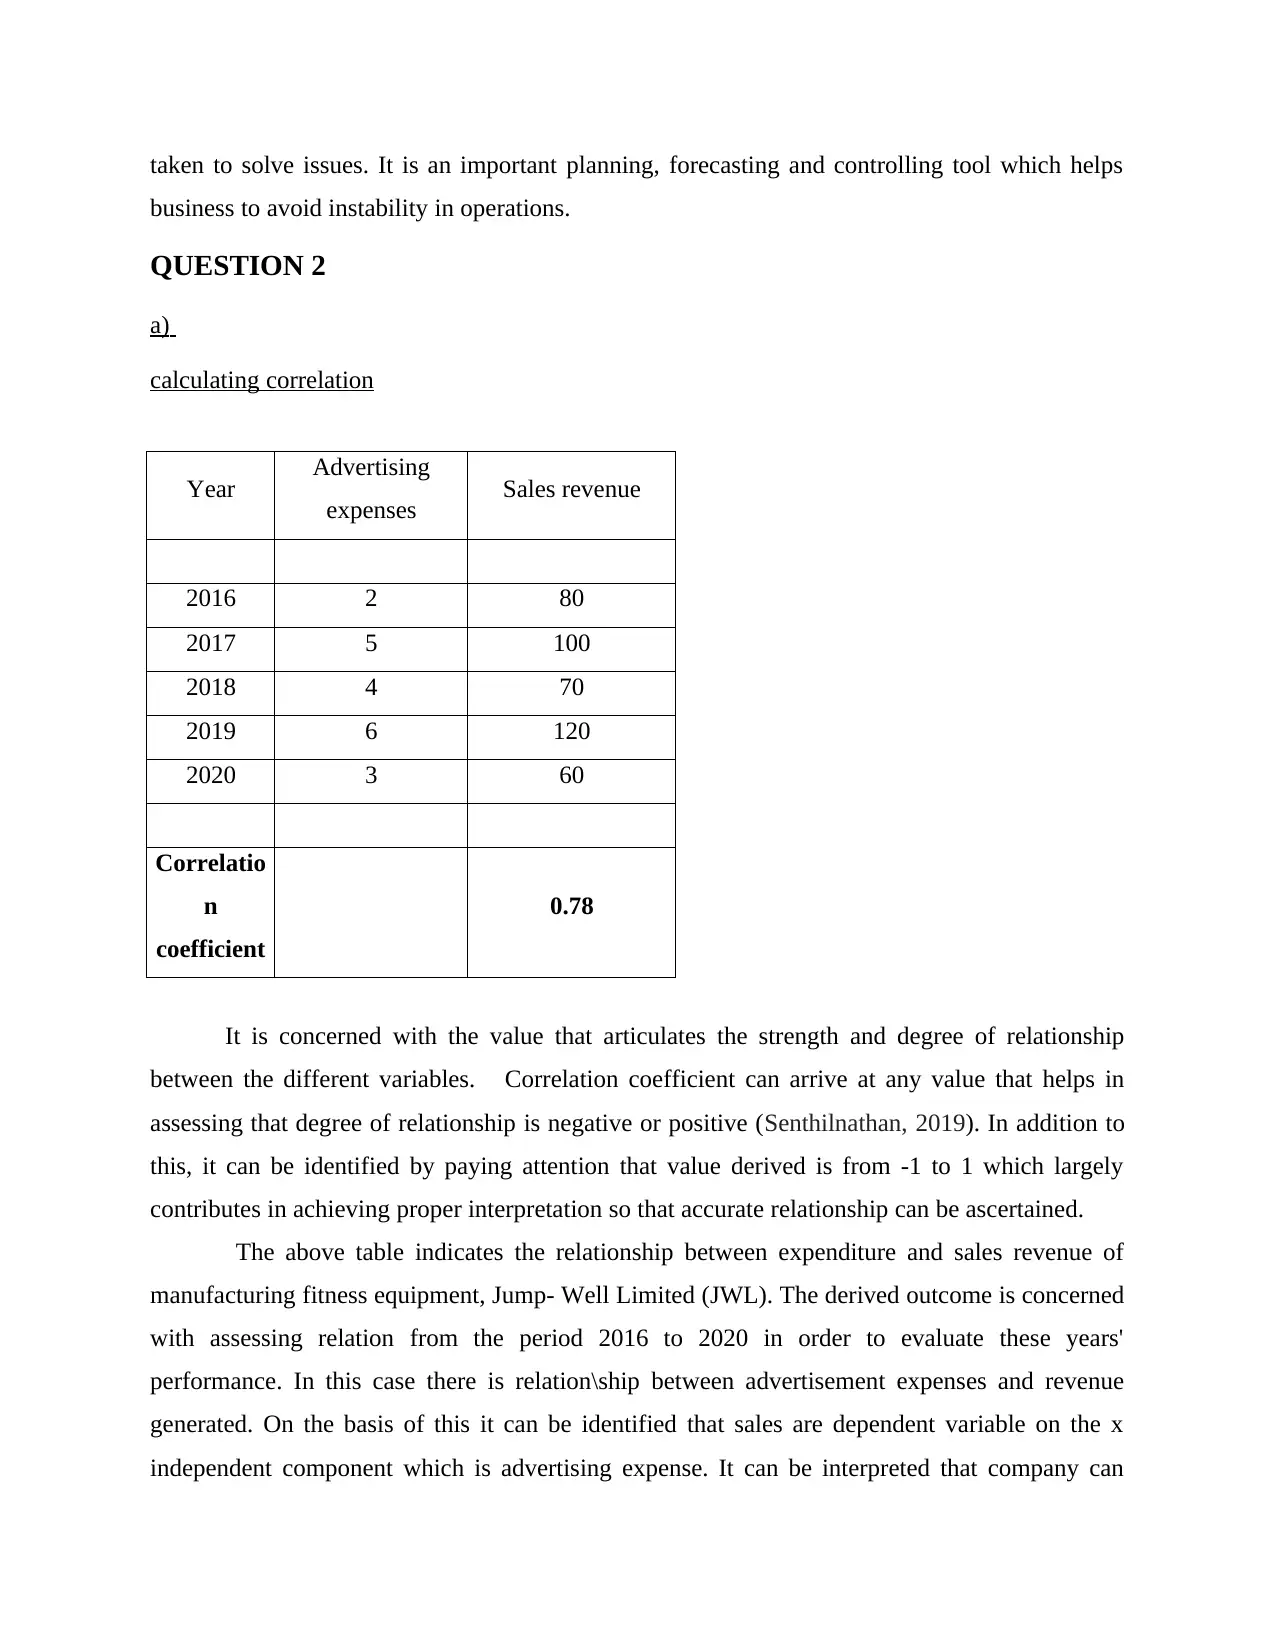
calculating correlation
Year Advertising
expenses Sales revenue
2016 2 80
2017 5 100
2018 4 70
2019 6 120
2020 3 60
Correlatio
n
coefficient
0.78
It is concerned with the value that articulates the strength and degree of relationship
between the different variables. Correlation coefficient can arrive at any value that helps in
assessing that degree of relationship is negative or positive (Senthilnathan, 2019). In addition to
this, it can be identified by paying attention that value derived is from -1 to 1 which largely
contributes in achieving proper interpretation so that accurate relationship can be ascertained.
The above table indicates the relationship between expenditure and sales revenue of
manufacturing fitness equipment, Jump- Well Limited (JWL). The derived outcome is concerned
with assessing relation from the period 2016 to 2020 in order to evaluate these years'
performance. In this case there is relation\ship between advertisement expenses and revenue
generated. On the basis of this it can be identified that sales are dependent variable on the x
independent component which is advertising expense. It can be interpreted that company can
business to avoid instability in operations.
QUESTION 2
a)
calculating correlation
Year Advertising
expenses Sales revenue
2016 2 80
2017 5 100
2018 4 70
2019 6 120
2020 3 60
Correlatio
n
coefficient
0.78
It is concerned with the value that articulates the strength and degree of relationship
between the different variables. Correlation coefficient can arrive at any value that helps in
assessing that degree of relationship is negative or positive (Senthilnathan, 2019). In addition to
this, it can be identified by paying attention that value derived is from -1 to 1 which largely
contributes in achieving proper interpretation so that accurate relationship can be ascertained.
The above table indicates the relationship between expenditure and sales revenue of
manufacturing fitness equipment, Jump- Well Limited (JWL). The derived outcome is concerned
with assessing relation from the period 2016 to 2020 in order to evaluate these years'
performance. In this case there is relation\ship between advertisement expenses and revenue
generated. On the basis of this it can be identified that sales are dependent variable on the x
independent component which is advertising expense. It can be interpreted that company can
⊘ This is a preview!⊘
Do you want full access?
Subscribe today to unlock all pages.
Trusted by 1+ million students worldwide
assess how effectively its advertising expenditure is assisting in obtaining positive level of
performance in terms of revenue. JWL can pay attention can quantify the linear dependency of
two variables.
On the basis of above computation of model, it can be interpreted that there is positive
relationship among the stated X and Y variable. This can be articulated on the basis of derived
outcome that these both mentioned components have positive directional growth. If the
advertisement expenses will go in upper direction, there is possibility of increasing sales (Tellis,
2019). Once Jump- Well Limited will decline its expenditure relation with independent variable
like advertisement cost, reduced revenue generating capacity will be obtained. The attained
result is more than zero which is positive indicator of relationship between these variable.
This can be articulated that specified organization as per the performance of 2016 to 2020,
when expenses are increasing, outcome in form of revenue will incline. It can be validated that
from 2016 to 2019 it has increased which forced the sales category to uplift the performance. On
the other side, in 2020 as compared to 2019, revenue generating capacity has decreased due to
reduce in stated expenditure. It is highly beneficial for the specified organization to pay attention
measuring the correlation in order to get higher productivity & sustainability in sector. The
obtained outcome will be largely useful in terms of taking decision regarding analysing,
allocating and controlling expenses for the advertising department in order to incline
organizational performance. This will aid firm to concentrate on applying proper actions to attain
greater outcome.
b)
Paraphrase This Document
Need a fresh take? Get an instant paraphrase of this document with our AI Paraphraser
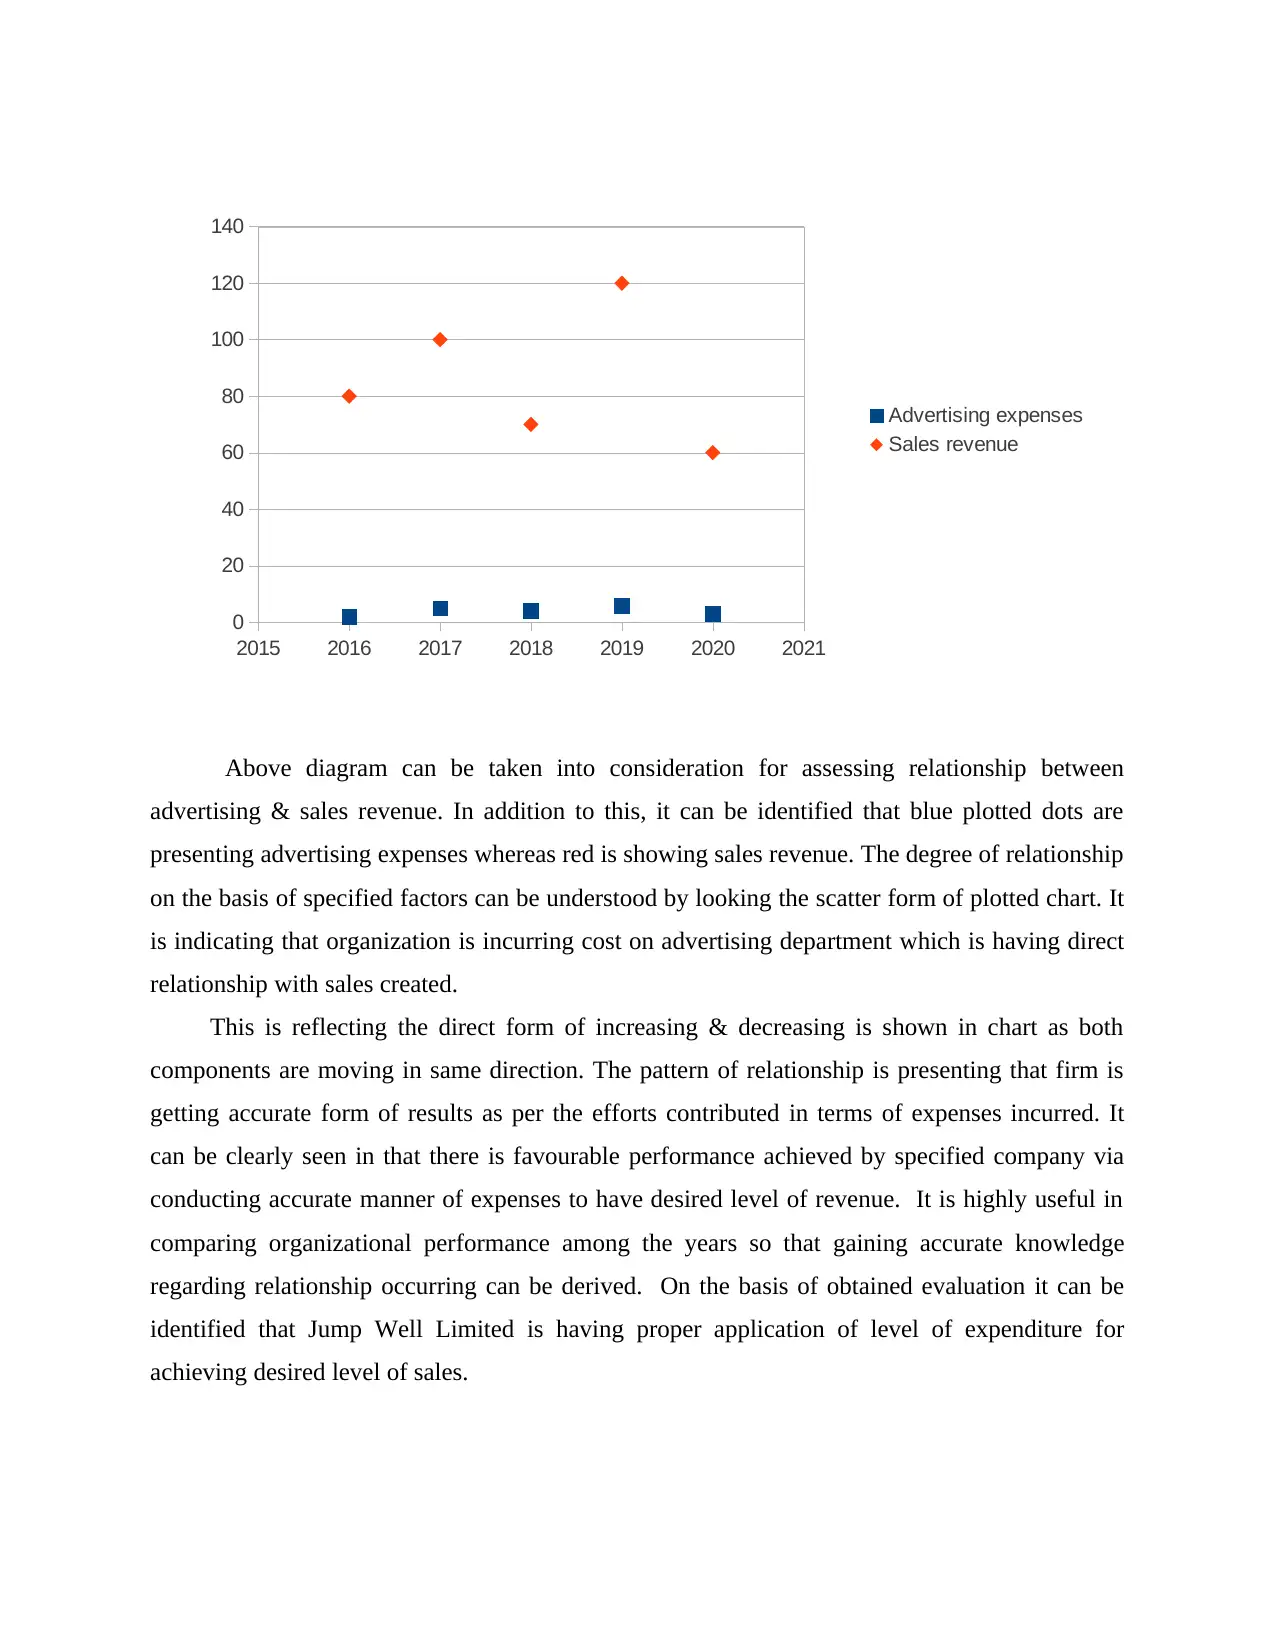
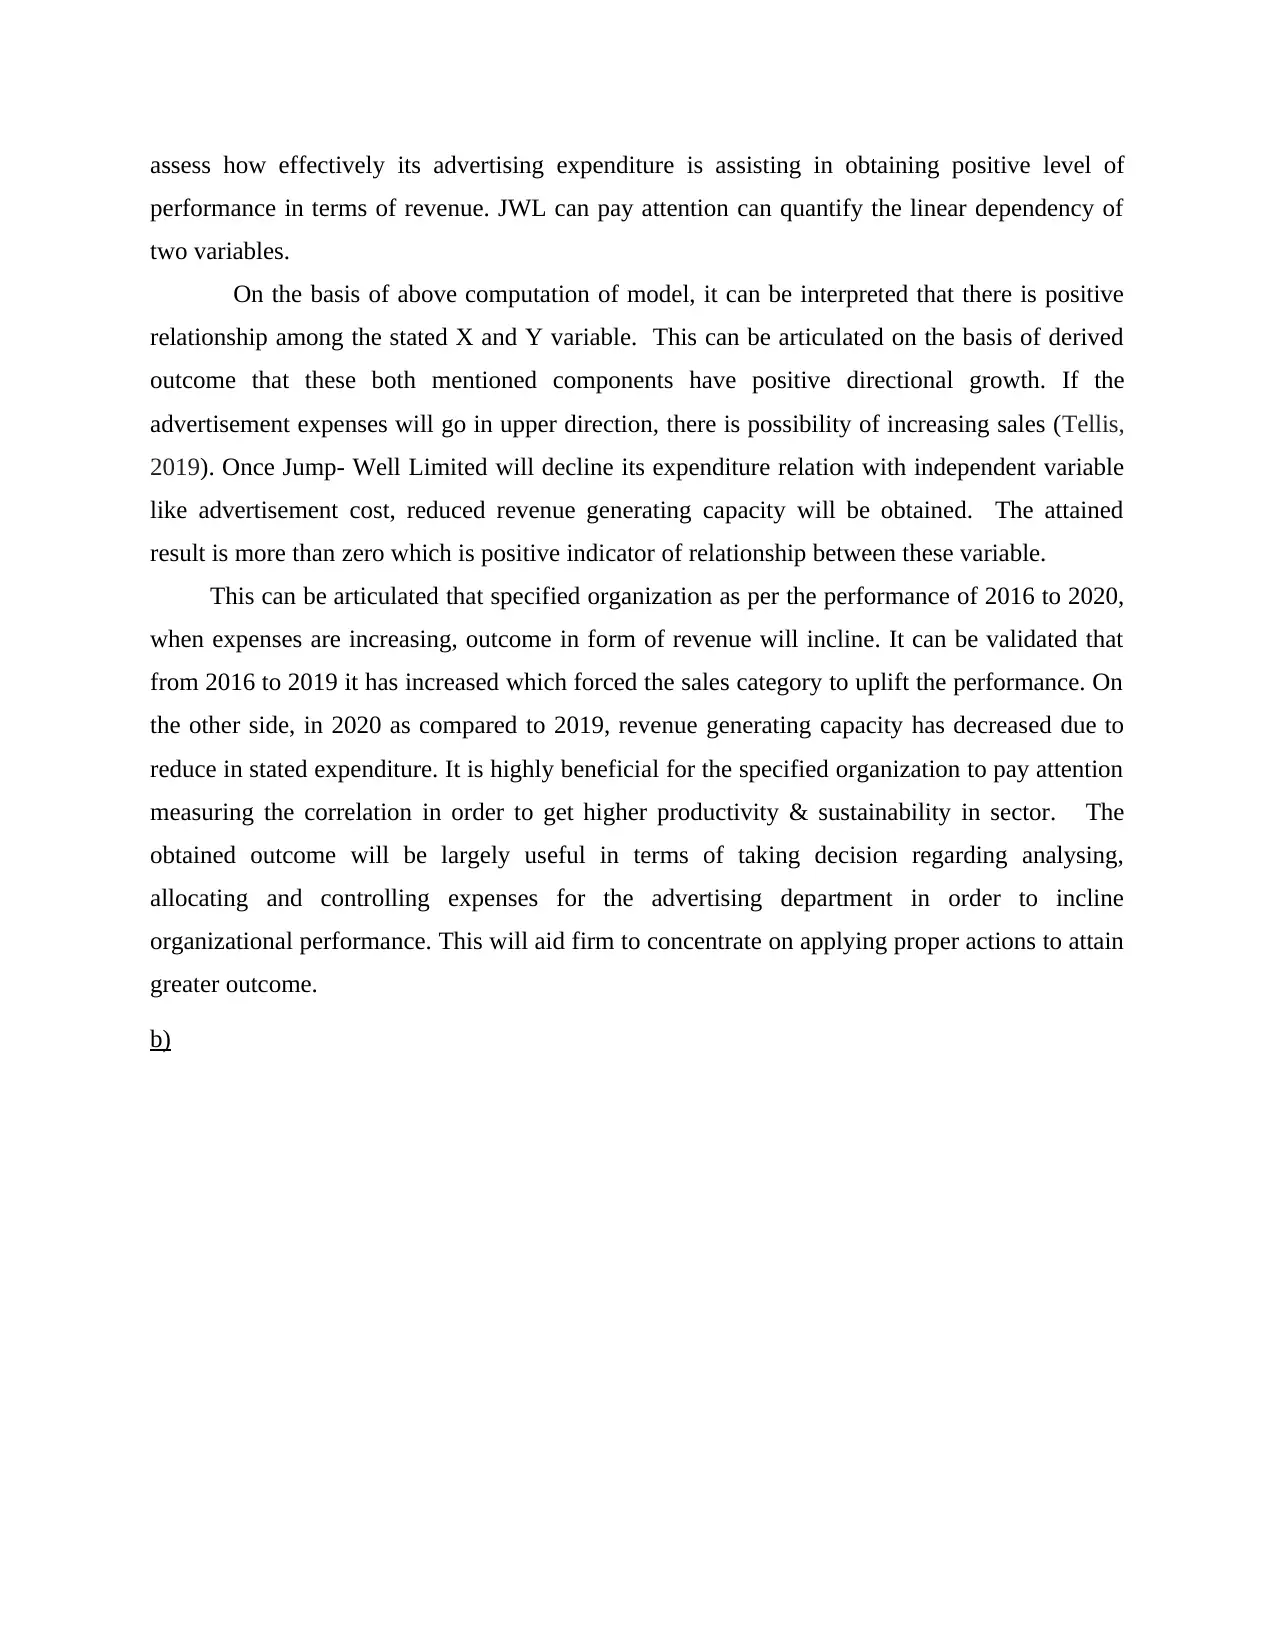
Above diagram can be taken into consideration for assessing relationship between
advertising & sales revenue. In addition to this, it can be identified that blue plotted dots are
presenting advertising expenses whereas red is showing sales revenue. The degree of relationship
on the basis of specified factors can be understood by looking the scatter form of plotted chart. It
is indicating that organization is incurring cost on advertising department which is having direct
relationship with sales created.
This is reflecting the direct form of increasing & decreasing is shown in chart as both
components are moving in same direction. The pattern of relationship is presenting that firm is
getting accurate form of results as per the efforts contributed in terms of expenses incurred. It
can be clearly seen in that there is favourable performance achieved by specified company via
conducting accurate manner of expenses to have desired level of revenue. It is highly useful in
comparing organizational performance among the years so that gaining accurate knowledge
regarding relationship occurring can be derived. On the basis of obtained evaluation it can be
identified that Jump Well Limited is having proper application of level of expenditure for
achieving desired level of sales.
2015 2016 2017 2018 2019 2020 2021
0
20
40
60
80
100
120
140
Advertising expenses
Sales revenue
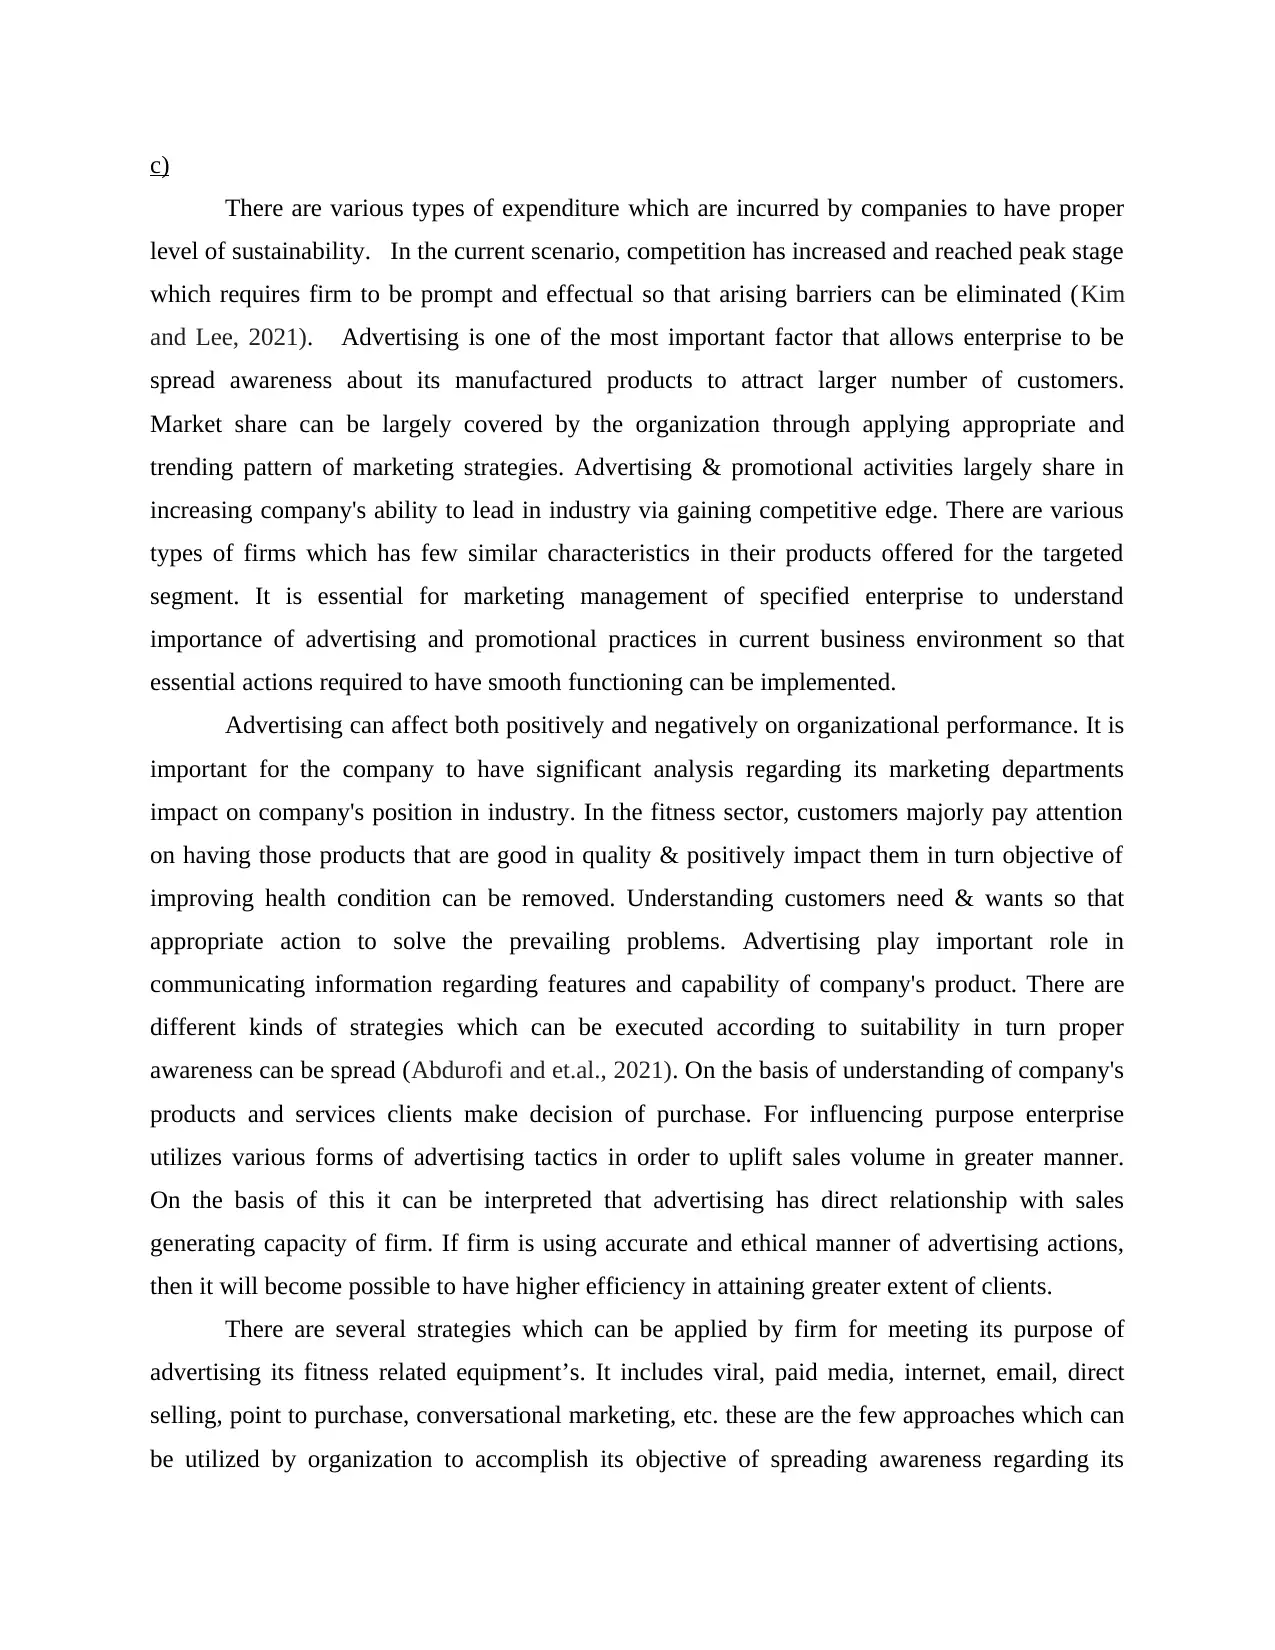
c)
There are various types of expenditure which are incurred by companies to have proper
level of sustainability. In the current scenario, competition has increased and reached peak stage
which requires firm to be prompt and effectual so that arising barriers can be eliminated (Kim
and Lee, 2021). Advertising is one of the most important factor that allows enterprise to be
spread awareness about its manufactured products to attract larger number of customers.
Market share can be largely covered by the organization through applying appropriate and
trending pattern of marketing strategies. Advertising & promotional activities largely share in
increasing company's ability to lead in industry via gaining competitive edge. There are various
types of firms which has few similar characteristics in their products offered for the targeted
segment. It is essential for marketing management of specified enterprise to understand
importance of advertising and promotional practices in current business environment so that
essential actions required to have smooth functioning can be implemented.
Advertising can affect both positively and negatively on organizational performance. It is
important for the company to have significant analysis regarding its marketing departments
impact on company's position in industry. In the fitness sector, customers majorly pay attention
on having those products that are good in quality & positively impact them in turn objective of
improving health condition can be removed. Understanding customers need & wants so that
appropriate action to solve the prevailing problems. Advertising play important role in
communicating information regarding features and capability of company's product. There are
different kinds of strategies which can be executed according to suitability in turn proper
awareness can be spread (Abdurofi and et.al., 2021). On the basis of understanding of company's
products and services clients make decision of purchase. For influencing purpose enterprise
utilizes various forms of advertising tactics in order to uplift sales volume in greater manner.
On the basis of this it can be interpreted that advertising has direct relationship with sales
generating capacity of firm. If firm is using accurate and ethical manner of advertising actions,
then it will become possible to have higher efficiency in attaining greater extent of clients.
There are several strategies which can be applied by firm for meeting its purpose of
advertising its fitness related equipment’s. It includes viral, paid media, internet, email, direct
selling, point to purchase, conversational marketing, etc. these are the few approaches which can
be utilized by organization to accomplish its objective of spreading awareness regarding its
⊘ This is a preview!⊘
Do you want full access?
Subscribe today to unlock all pages.
Trusted by 1+ million students worldwide
offered products benefits to make buyer positively influenced and take decision in favour of
organization (Ndidi and Etebo, 2021). The targeted audience of the fitness industry is usually
persons who are health conscious & have objective of good physical appearance. This comprises
youngsters, middle age group people, etc. with respect to this, it can be recognized that for
having higher attention of clients, fitness based enterprise can use digital marketing practices,
conducting campaigns, etc. Social media, email, display, etc. are those approaches which can be
largely useful in having distinct competitive advantages in terms of higher transparency, proper
clarity of features, etc. that can permit to building trustworthiness relationship among customers.
It will as well provide assistance in having two-way communication which is useful in solving
queries and issues to positively impact clients and create positive working atmosphere. The
mentioned organization will become positively affected by adopting these marketing practices
through identifying suitable market segment to obtain growth in sector. Marketing strategies is
important to choose wisely so that favourable impact can be implemented by eliminating
irrelevant aspects in order to reach desirable position in industry.
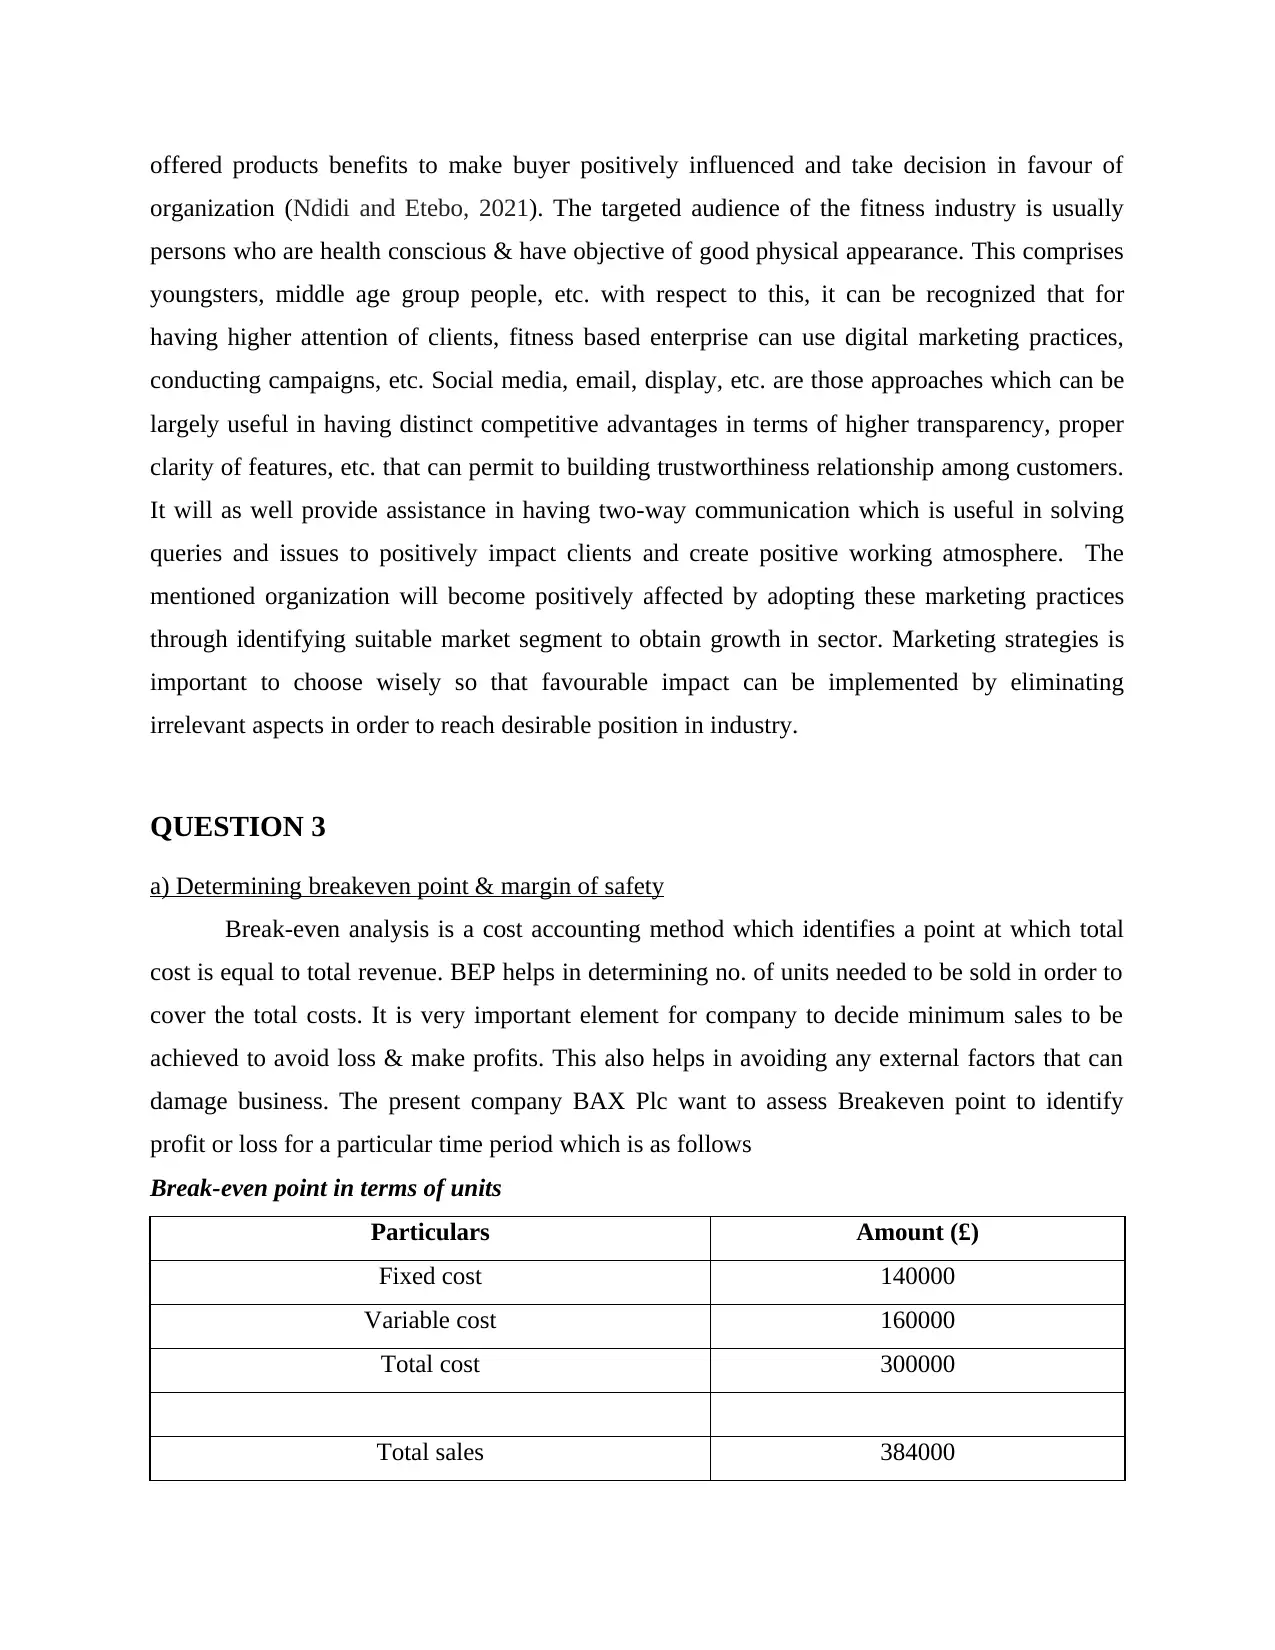
QUESTION 3
a) Determining breakeven point & margin of safety
Break-even analysis is a cost accounting method which identifies a point at which total
cost is equal to total revenue. BEP helps in determining no. of units needed to be sold in order to
cover the total costs. It is very important element for company to decide minimum sales to be
achieved to avoid loss & make profits. This also helps in avoiding any external factors that can
damage business. The present company BAX Plc want to assess Breakeven point to identify
profit or loss for a particular time period which is as follows
Break-even point in terms of units
Particulars Amount (£)
Fixed cost 140000
Variable cost 160000
Total cost 300000
Total sales 384000
organization (Ndidi and Etebo, 2021). The targeted audience of the fitness industry is usually
persons who are health conscious & have objective of good physical appearance. This comprises
youngsters, middle age group people, etc. with respect to this, it can be recognized that for
having higher attention of clients, fitness based enterprise can use digital marketing practices,
conducting campaigns, etc. Social media, email, display, etc. are those approaches which can be
largely useful in having distinct competitive advantages in terms of higher transparency, proper
clarity of features, etc. that can permit to building trustworthiness relationship among customers.
It will as well provide assistance in having two-way communication which is useful in solving
queries and issues to positively impact clients and create positive working atmosphere. The
mentioned organization will become positively affected by adopting these marketing practices
through identifying suitable market segment to obtain growth in sector. Marketing strategies is
important to choose wisely so that favourable impact can be implemented by eliminating
irrelevant aspects in order to reach desirable position in industry.
QUESTION 3
a) Determining breakeven point & margin of safety
Break-even analysis is a cost accounting method which identifies a point at which total
cost is equal to total revenue. BEP helps in determining no. of units needed to be sold in order to
cover the total costs. It is very important element for company to decide minimum sales to be
achieved to avoid loss & make profits. This also helps in avoiding any external factors that can
damage business. The present company BAX Plc want to assess Breakeven point to identify
profit or loss for a particular time period which is as follows
Break-even point in terms of units
Particulars Amount (£)
Fixed cost 140000
Variable cost 160000
Total cost 300000
Total sales 384000
Paraphrase This Document
Need a fresh take? Get an instant paraphrase of this document with our AI Paraphraser
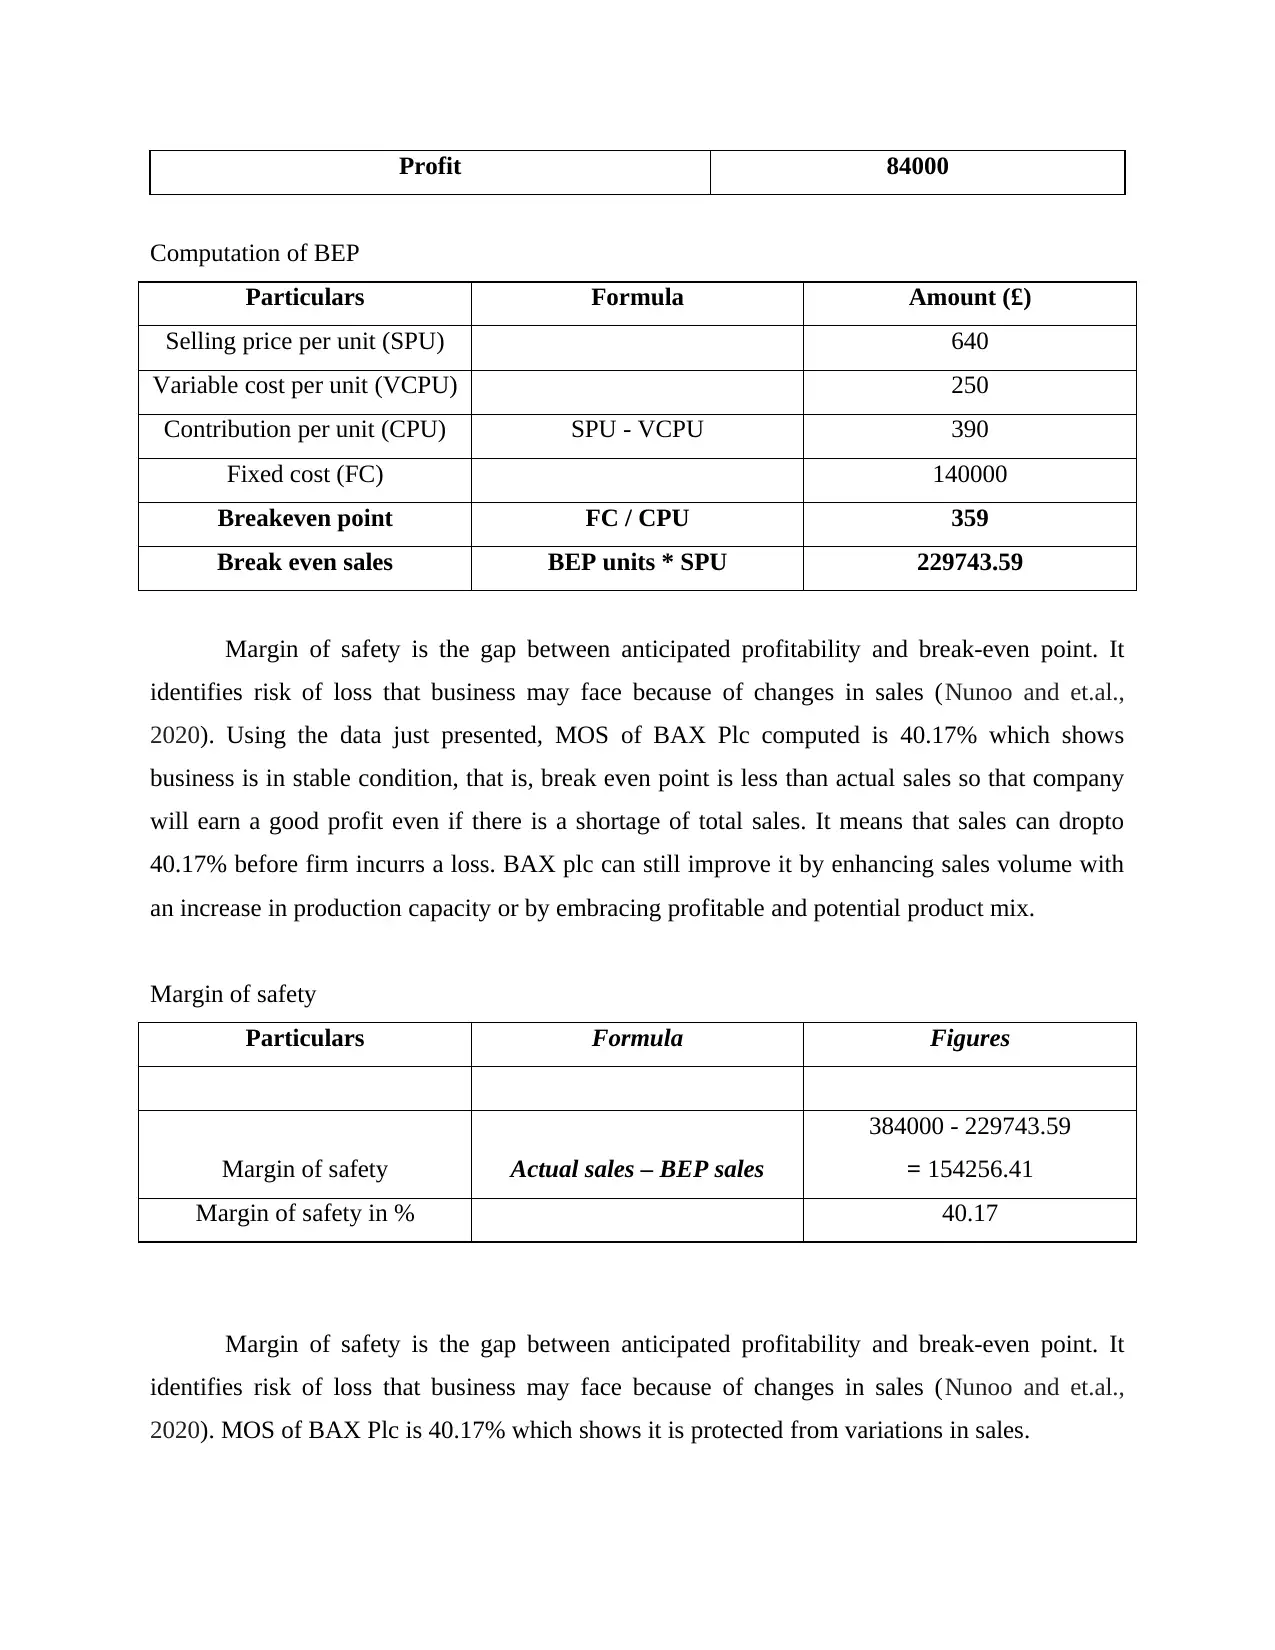
Profit 84000
Computation of BEP
Particulars Formula Amount (£)
Selling price per unit (SPU) 640
Variable cost per unit (VCPU) 250
Contribution per unit (CPU) SPU - VCPU 390
Fixed cost (FC) 140000
Breakeven point FC / CPU 359
Break even sales BEP units * SPU 229743.59
Margin of safety is the gap between anticipated profitability and break-even point. It
identifies risk of loss that business may face because of changes in sales (Nunoo and et.al.,
2020). Using the data just presented, MOS of BAX Plc computed is 40.17% which shows
business is in stable condition, that is, break even point is less than actual sales so that company
will earn a good profit even if there is a shortage of total sales. It means that sales can dropto
40.17% before firm incurrs a loss. BAX plc can still improve it by enhancing sales volume with
an increase in production capacity or by embracing profitable and potential product mix.
Margin of safety
Particulars Formula Figures
Margin of safety Actual sales – BEP sales
384000 - 229743.59
= 154256.41
Margin of safety in % 40.17
Margin of safety is the gap between anticipated profitability and break-even point. It
identifies risk of loss that business may face because of changes in sales (Nunoo and et.al.,
2020). MOS of BAX Plc is 40.17% which shows it is protected from variations in sales.
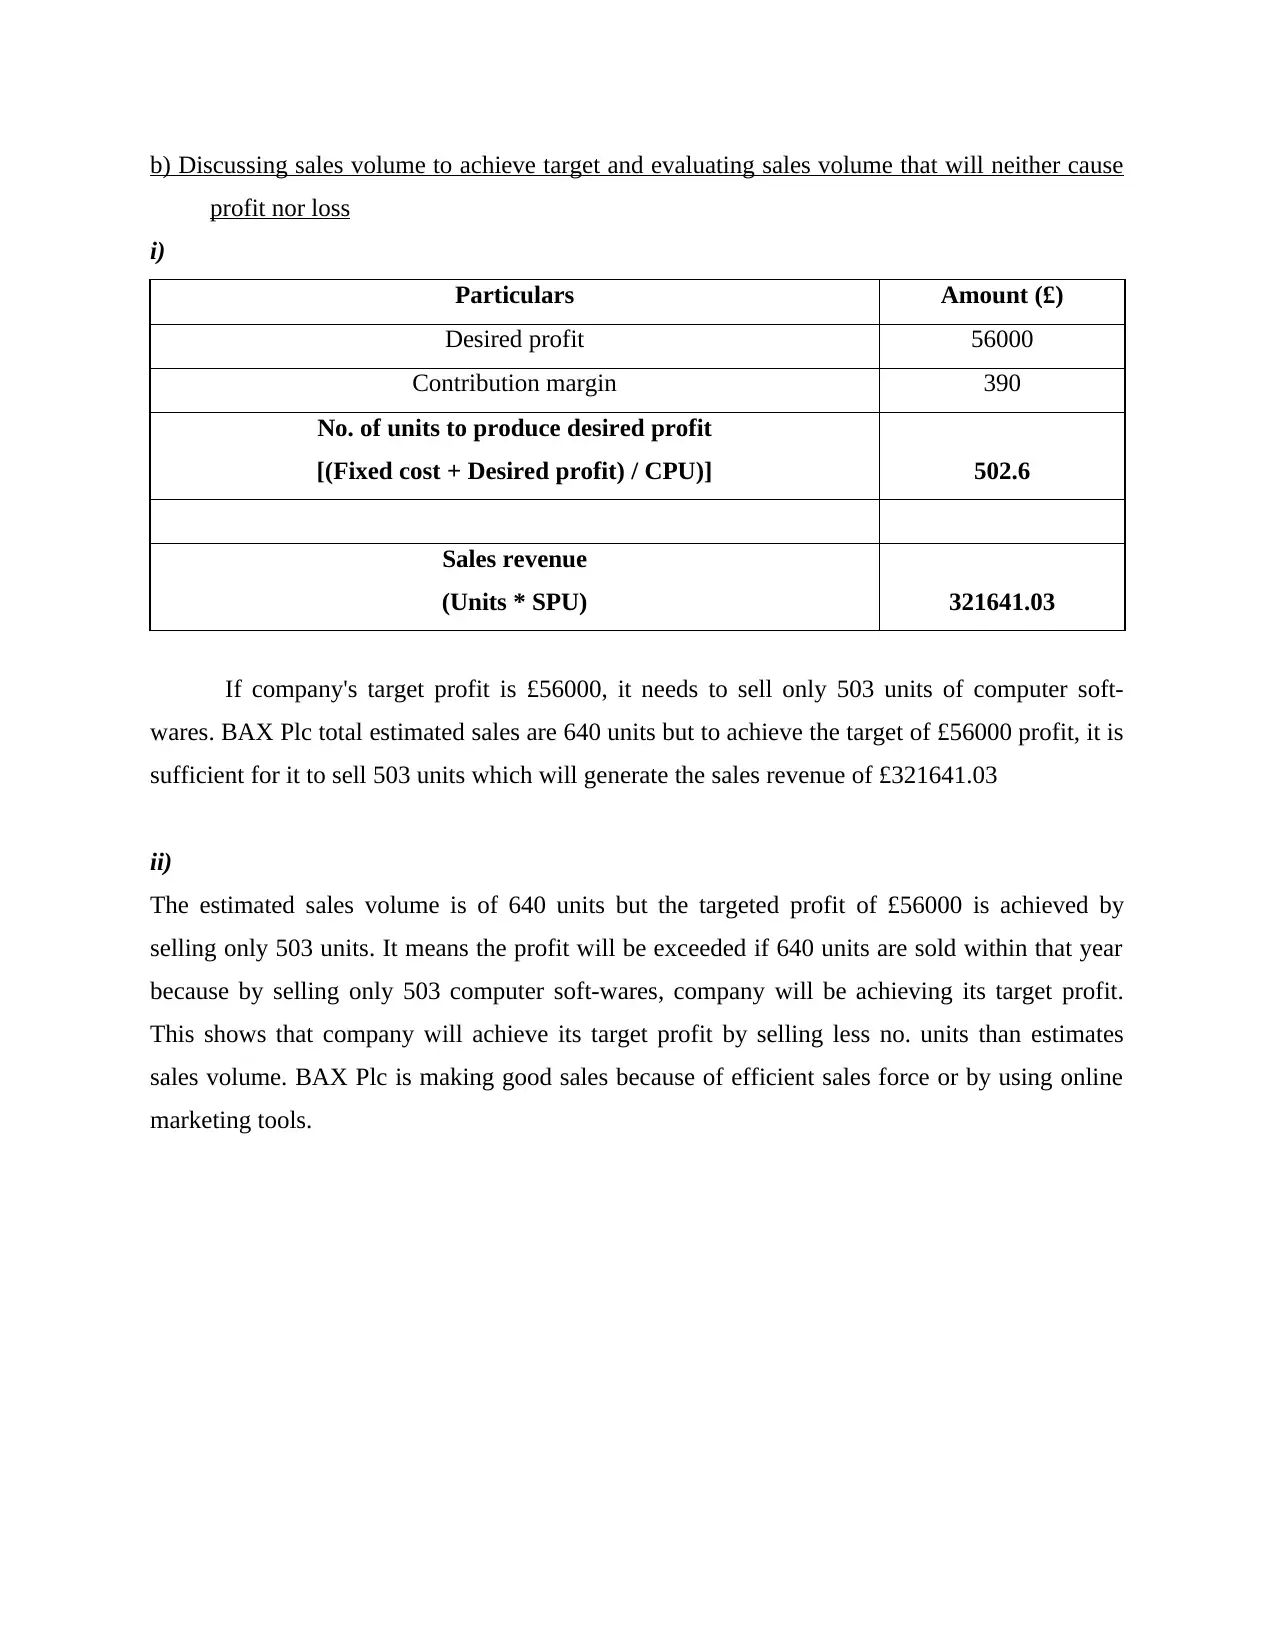
b) Discussing sales volume to achieve target and evaluating sales volume that will neither cause
profit nor loss
i)
Particulars Amount (£)
Desired profit 56000
Contribution margin 390
No. of units to produce desired profit
[(Fixed cost + Desired profit) / CPU)] 502.6
Sales revenue
(Units * SPU) 321641.03
If company's target profit is £56000, it needs to sell only 503 units of computer soft-
wares. BAX Plc total estimated sales are 640 units but to achieve the target of £56000 profit, it is
sufficient for it to sell 503 units which will generate the sales revenue of £321641.03
ii)
The estimated sales volume is of 640 units but the targeted profit of £56000 is achieved by
selling only 503 units. It means the profit will be exceeded if 640 units are sold within that year
because by selling only 503 computer soft-wares, company will be achieving its target profit.
This shows that company will achieve its target profit by selling less no. units than estimates
sales volume. BAX Plc is making good sales because of efficient sales force or by using online
marketing tools.
⊘ This is a preview!⊘
Do you want full access?
Subscribe today to unlock all pages.
Trusted by 1+ million students worldwide
1 out of 16
Related Documents


Your All-in-One AI-Powered Toolkit for Academic Success.
+13062052269
info@desklib.com
Available 24*7 on WhatsApp / Email
![[object Object]](/_next/static/media/star-bottom.7253800d.svg)
Unlock your academic potential
Copyright © 2020–2026 A2Z Services. All Rights Reserved. Developed and managed by ZUCOL.