Statistical Analysis of Cunningham Holdings Accommodation Data
VerifiedAdded on  2023/01/11
|11
|1371
|79
Report
AI Summary
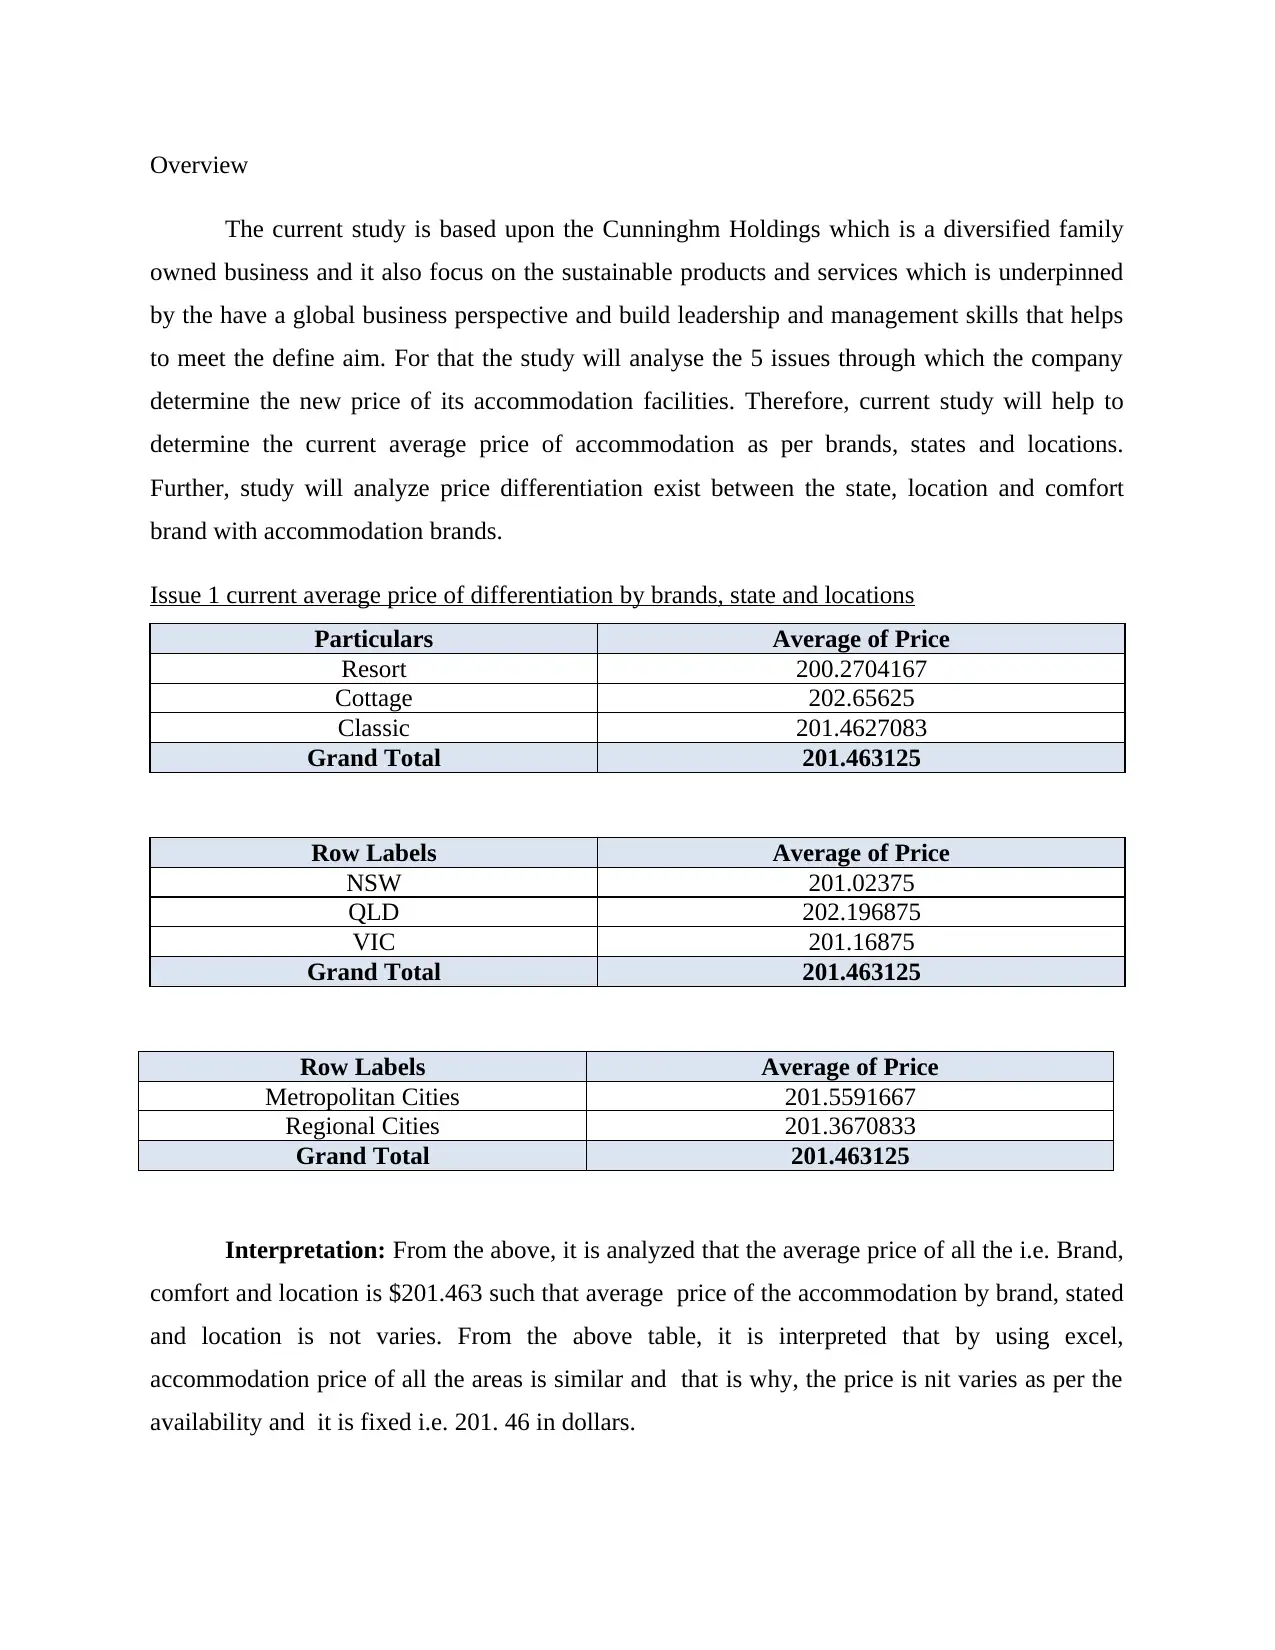
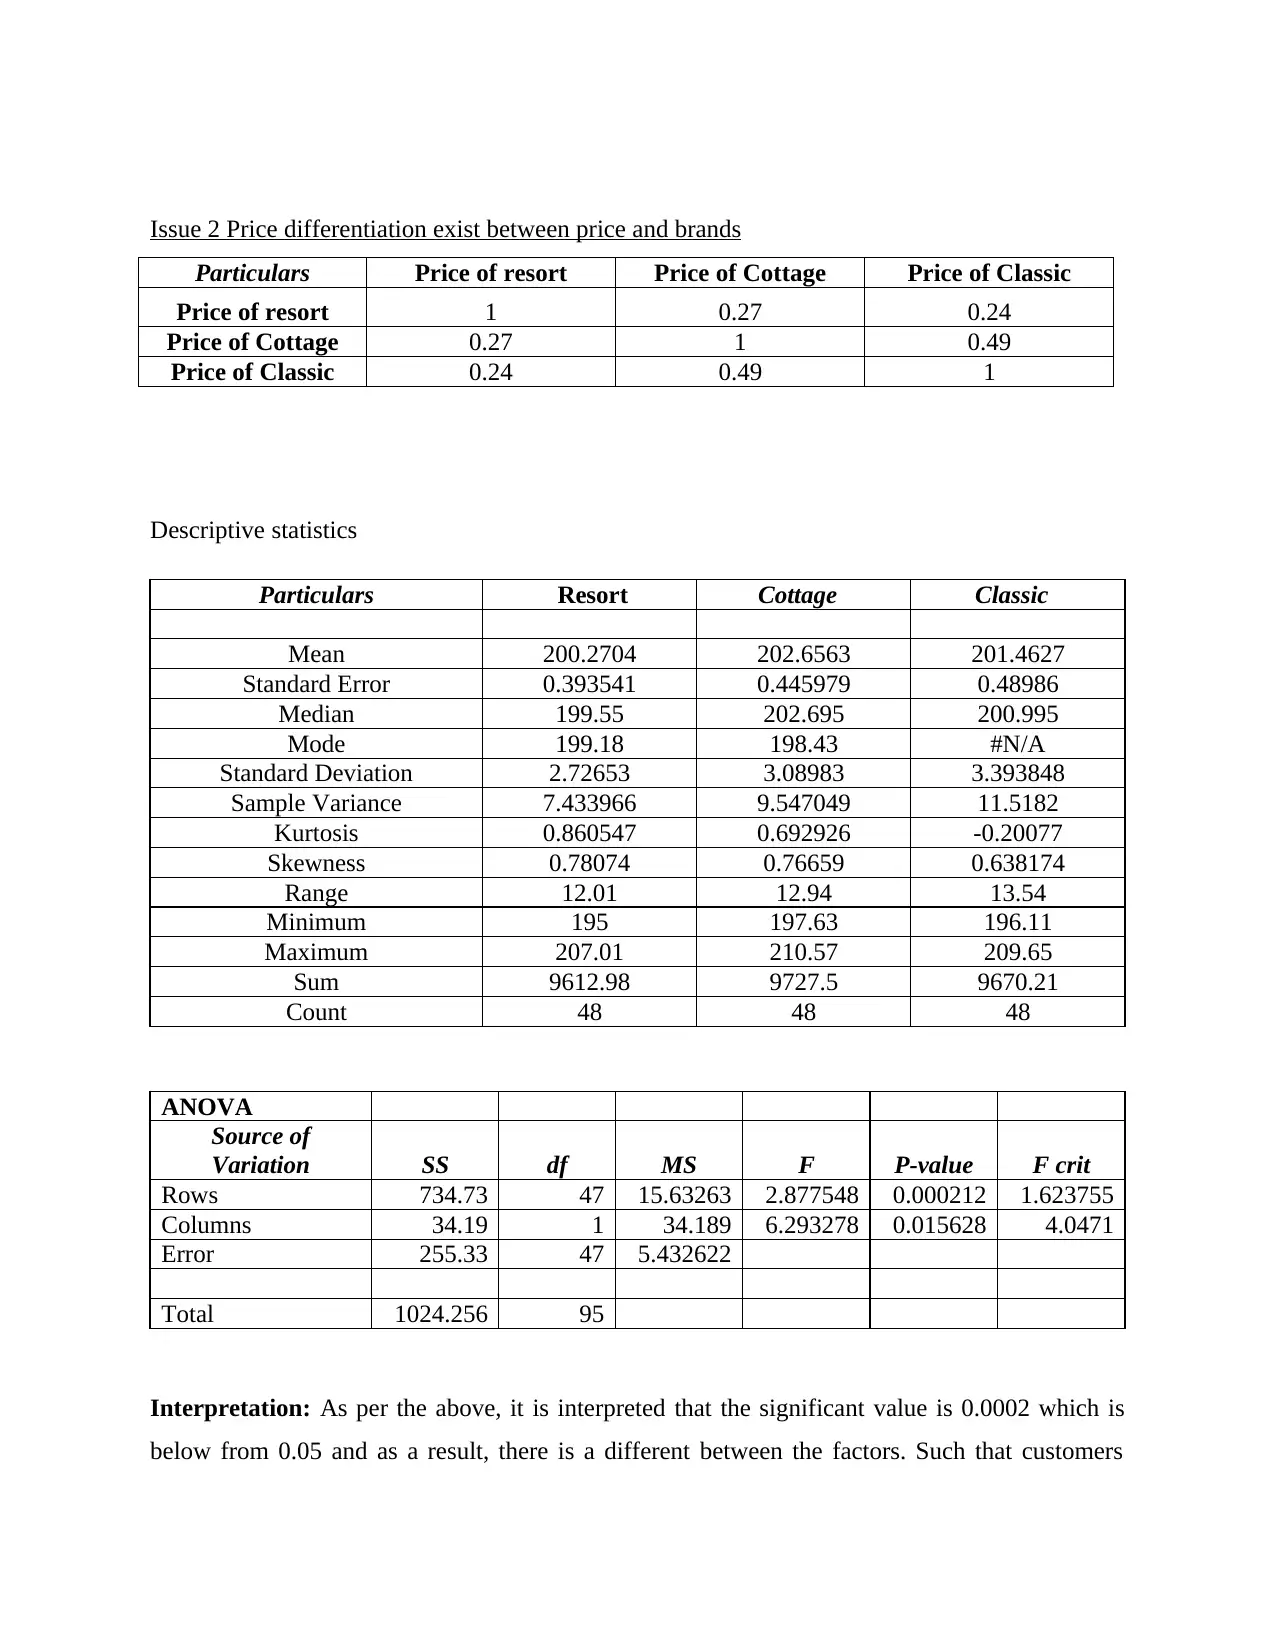
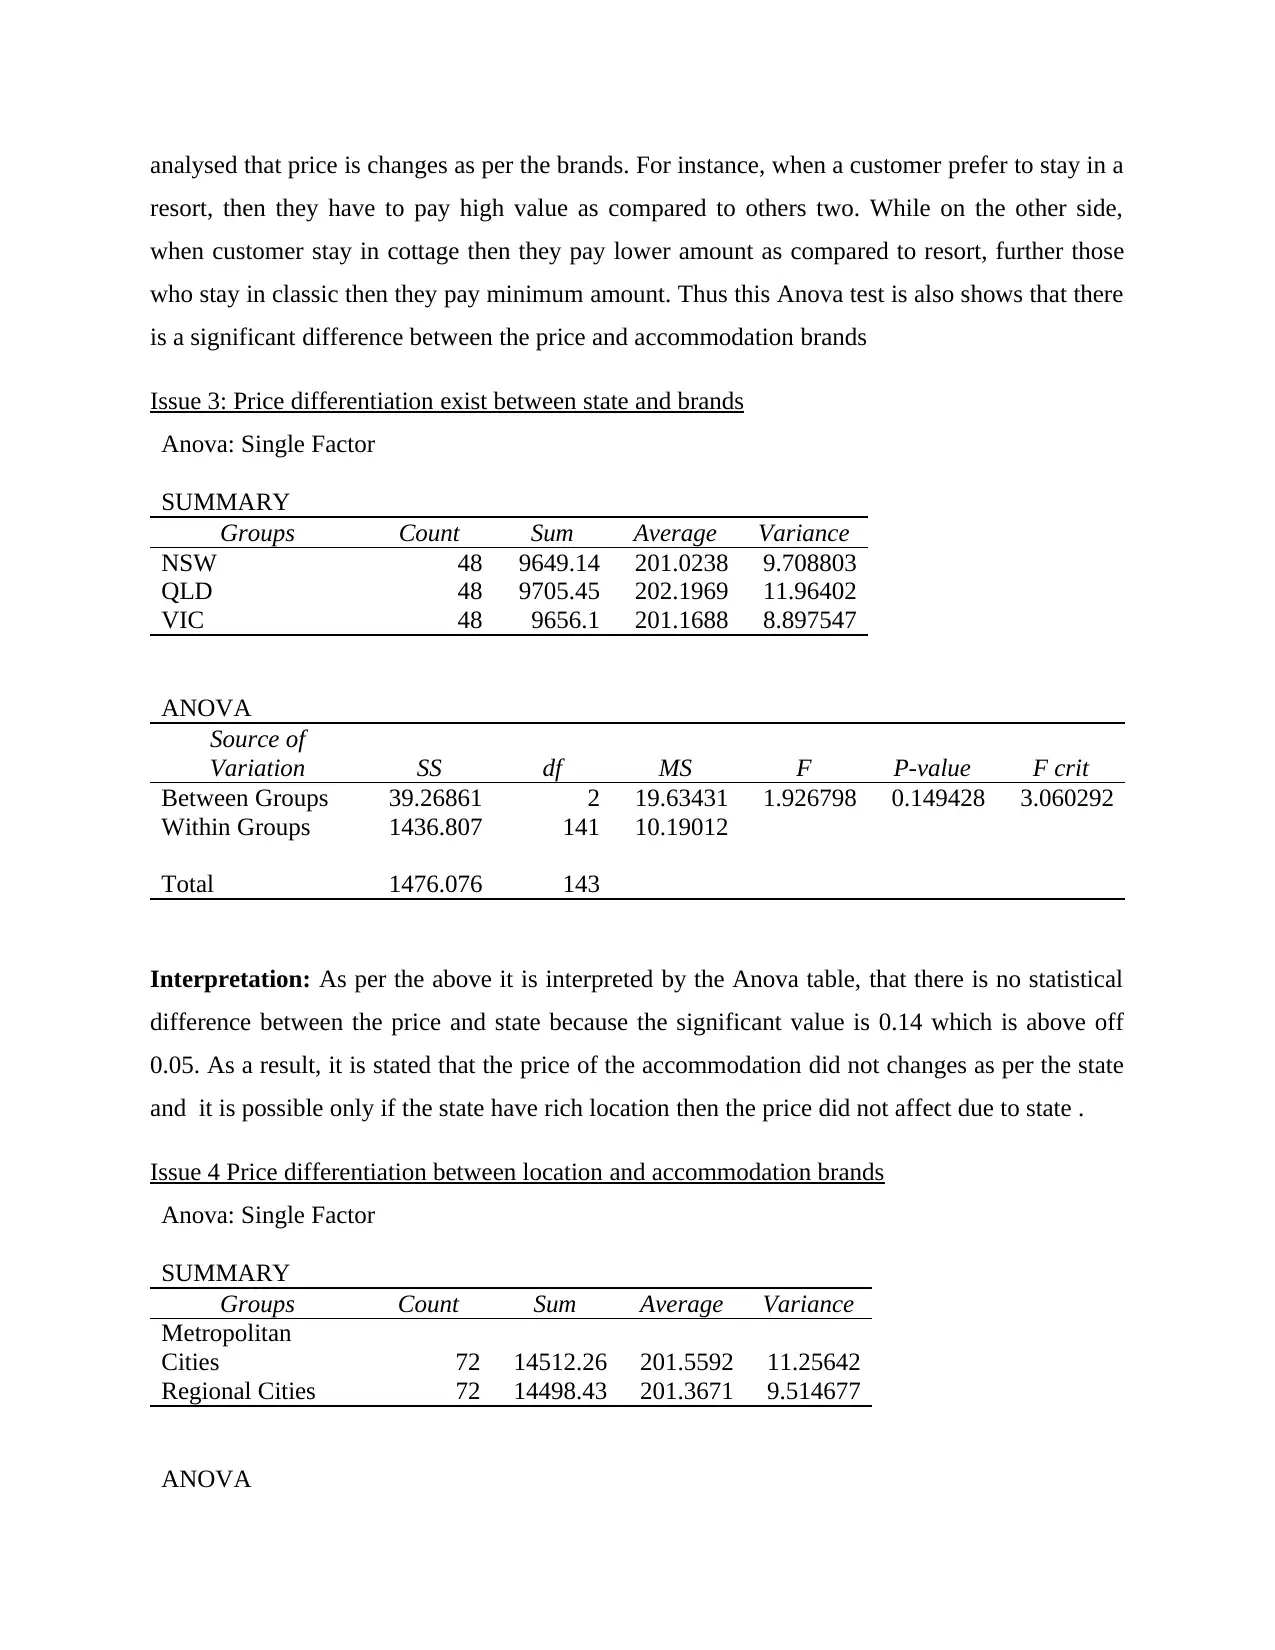
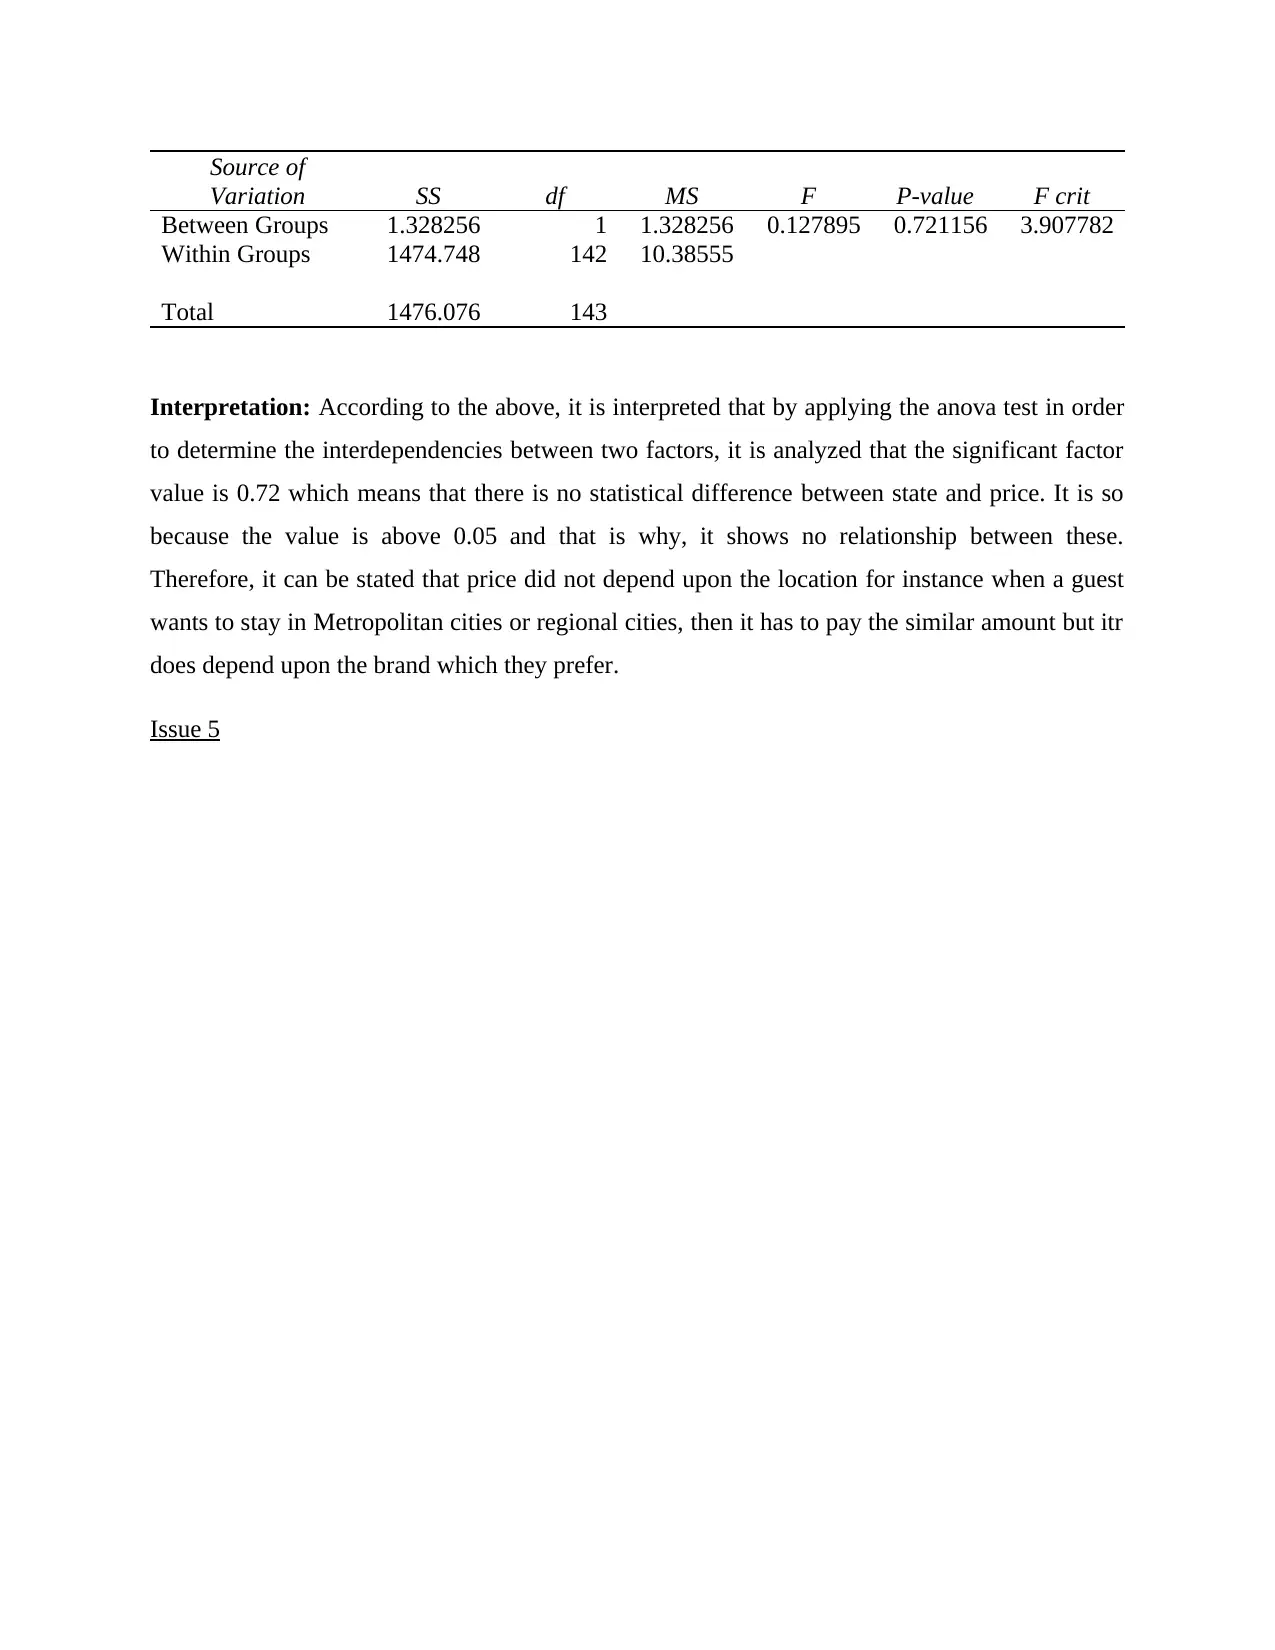
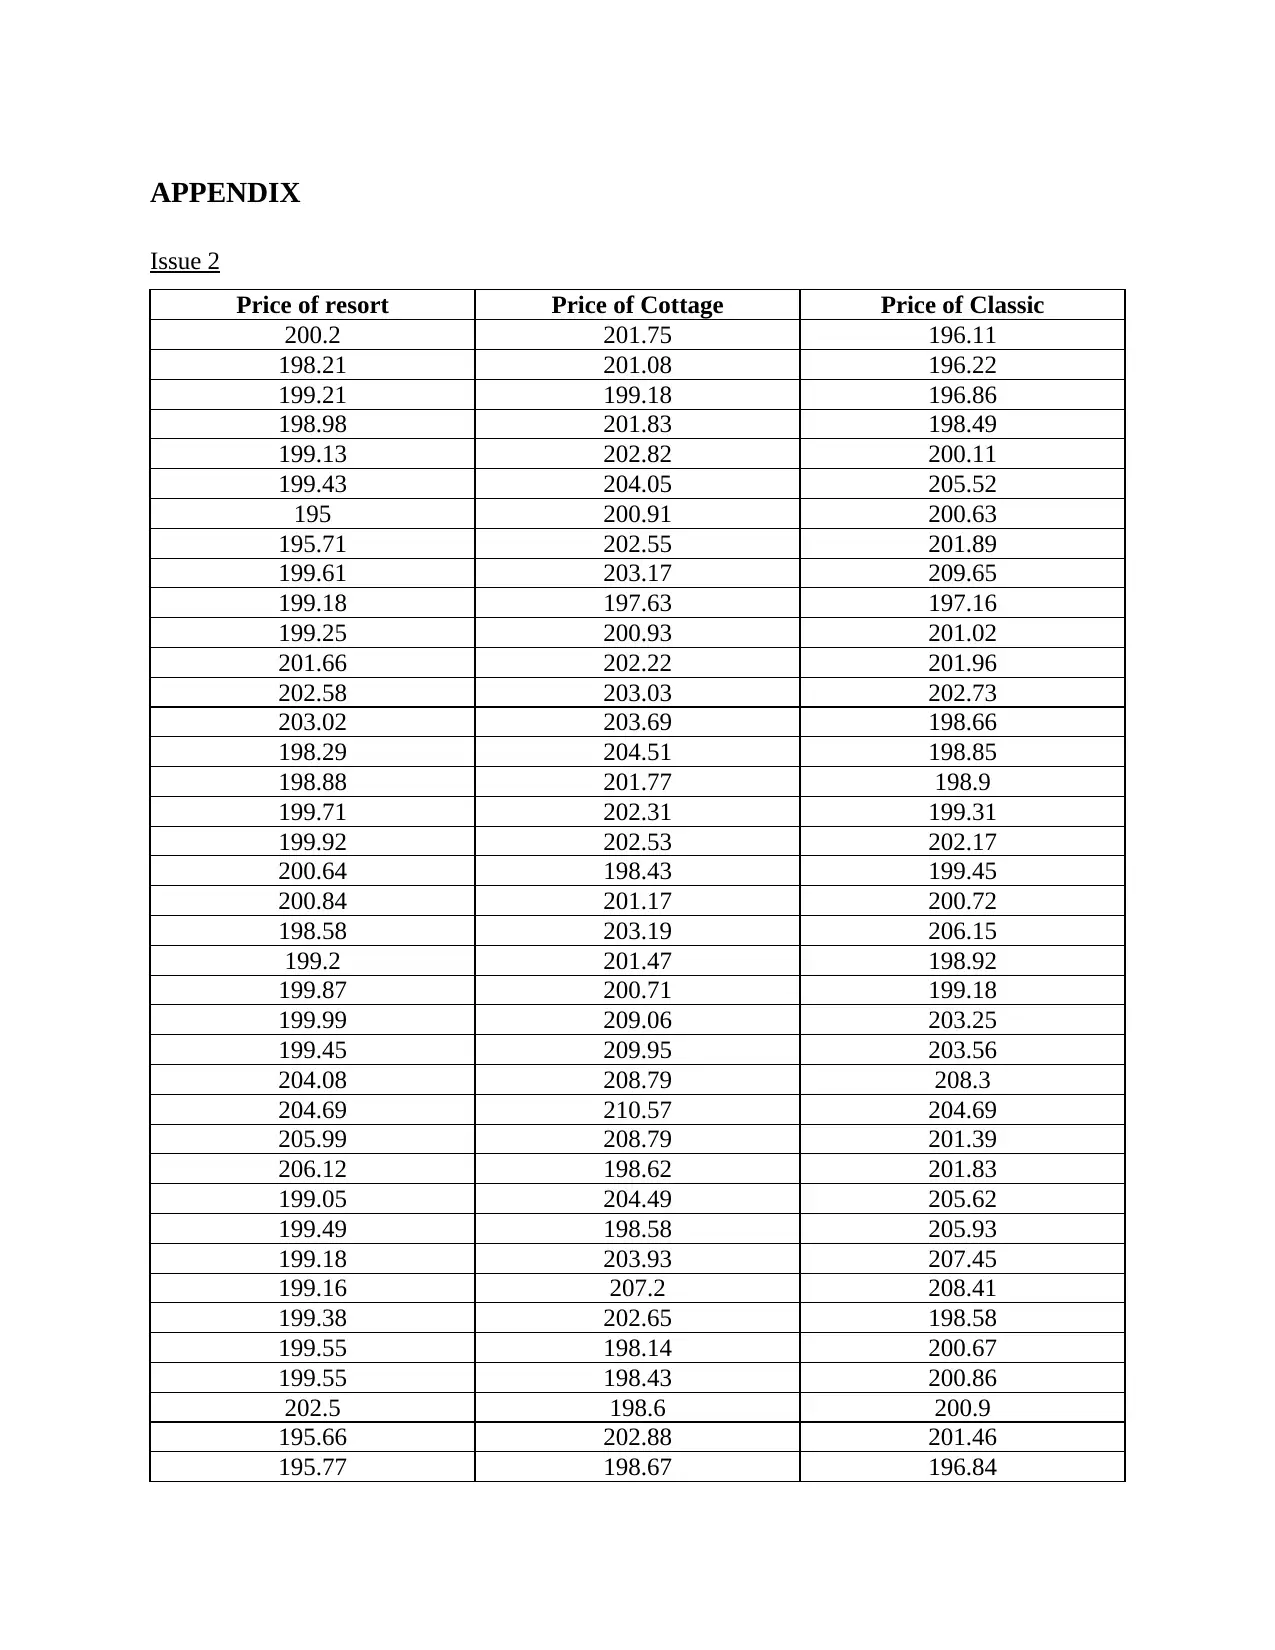
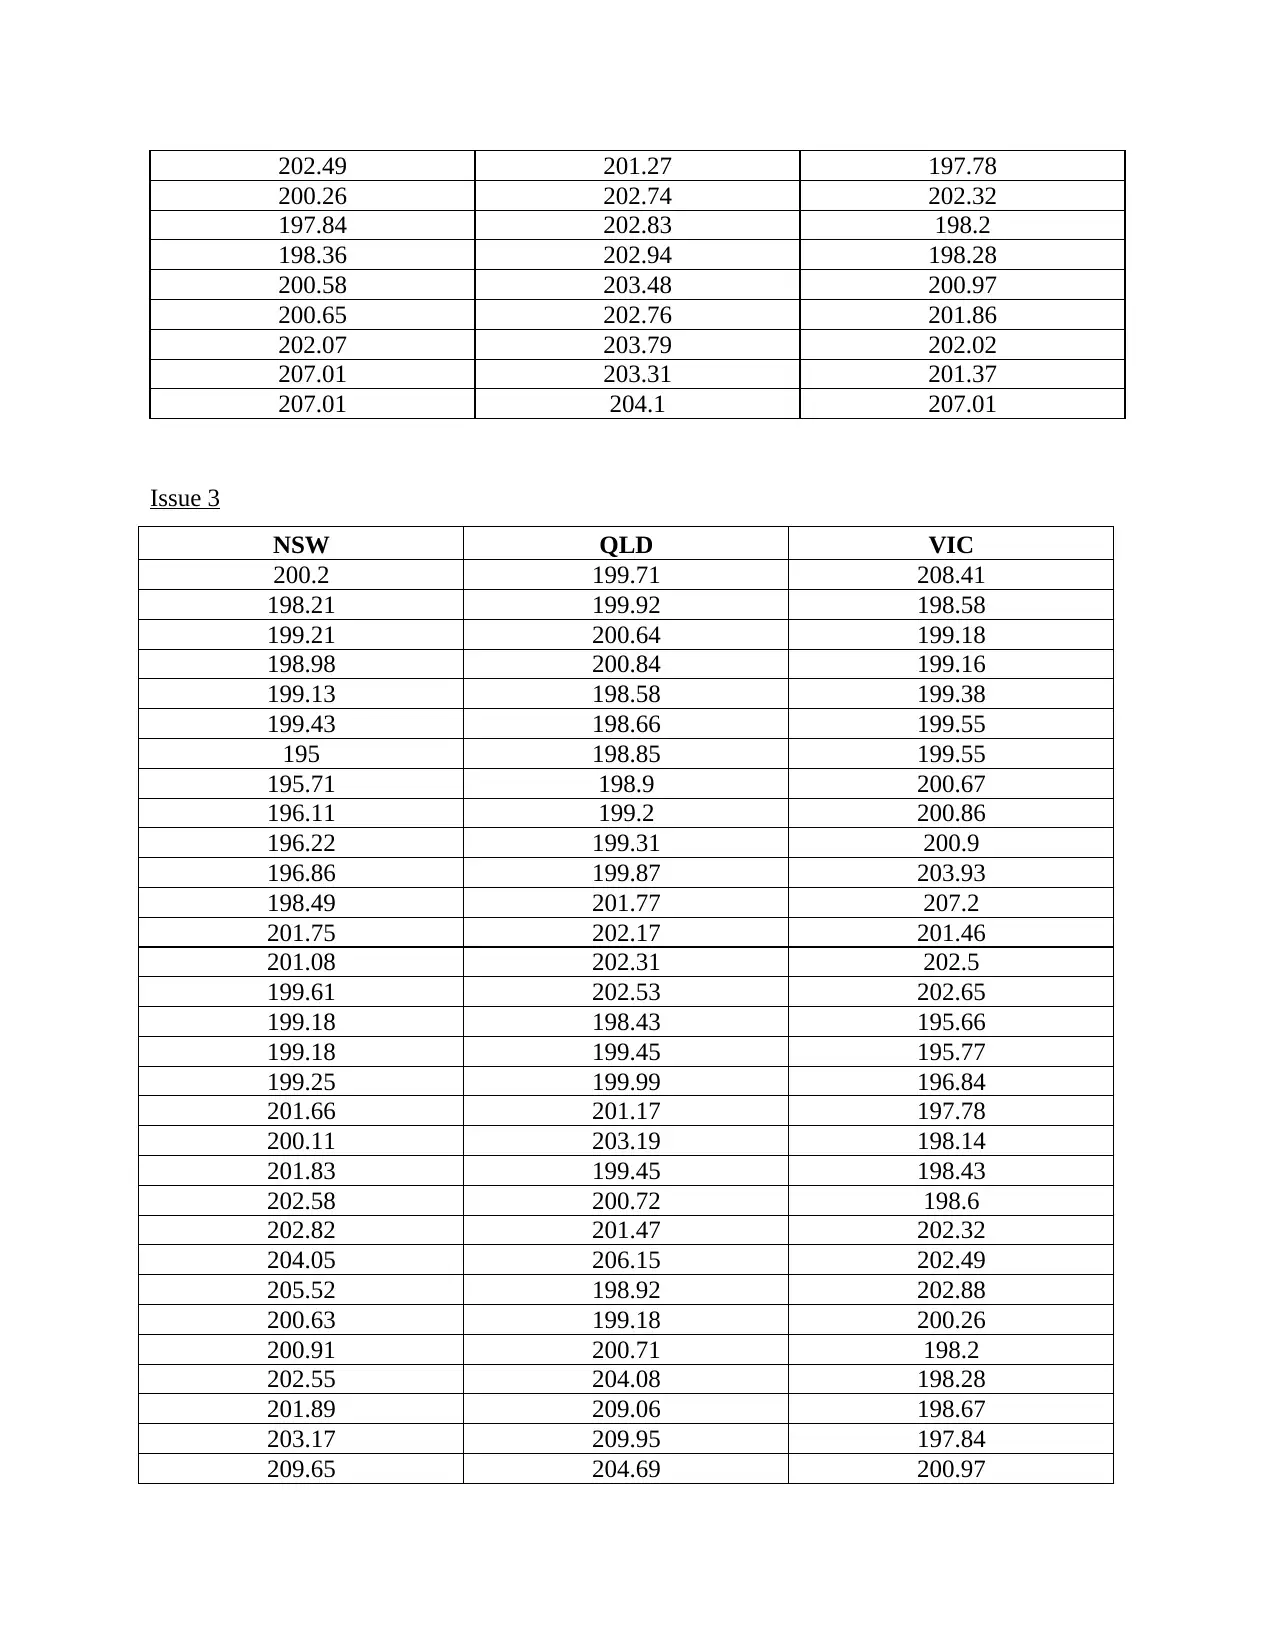
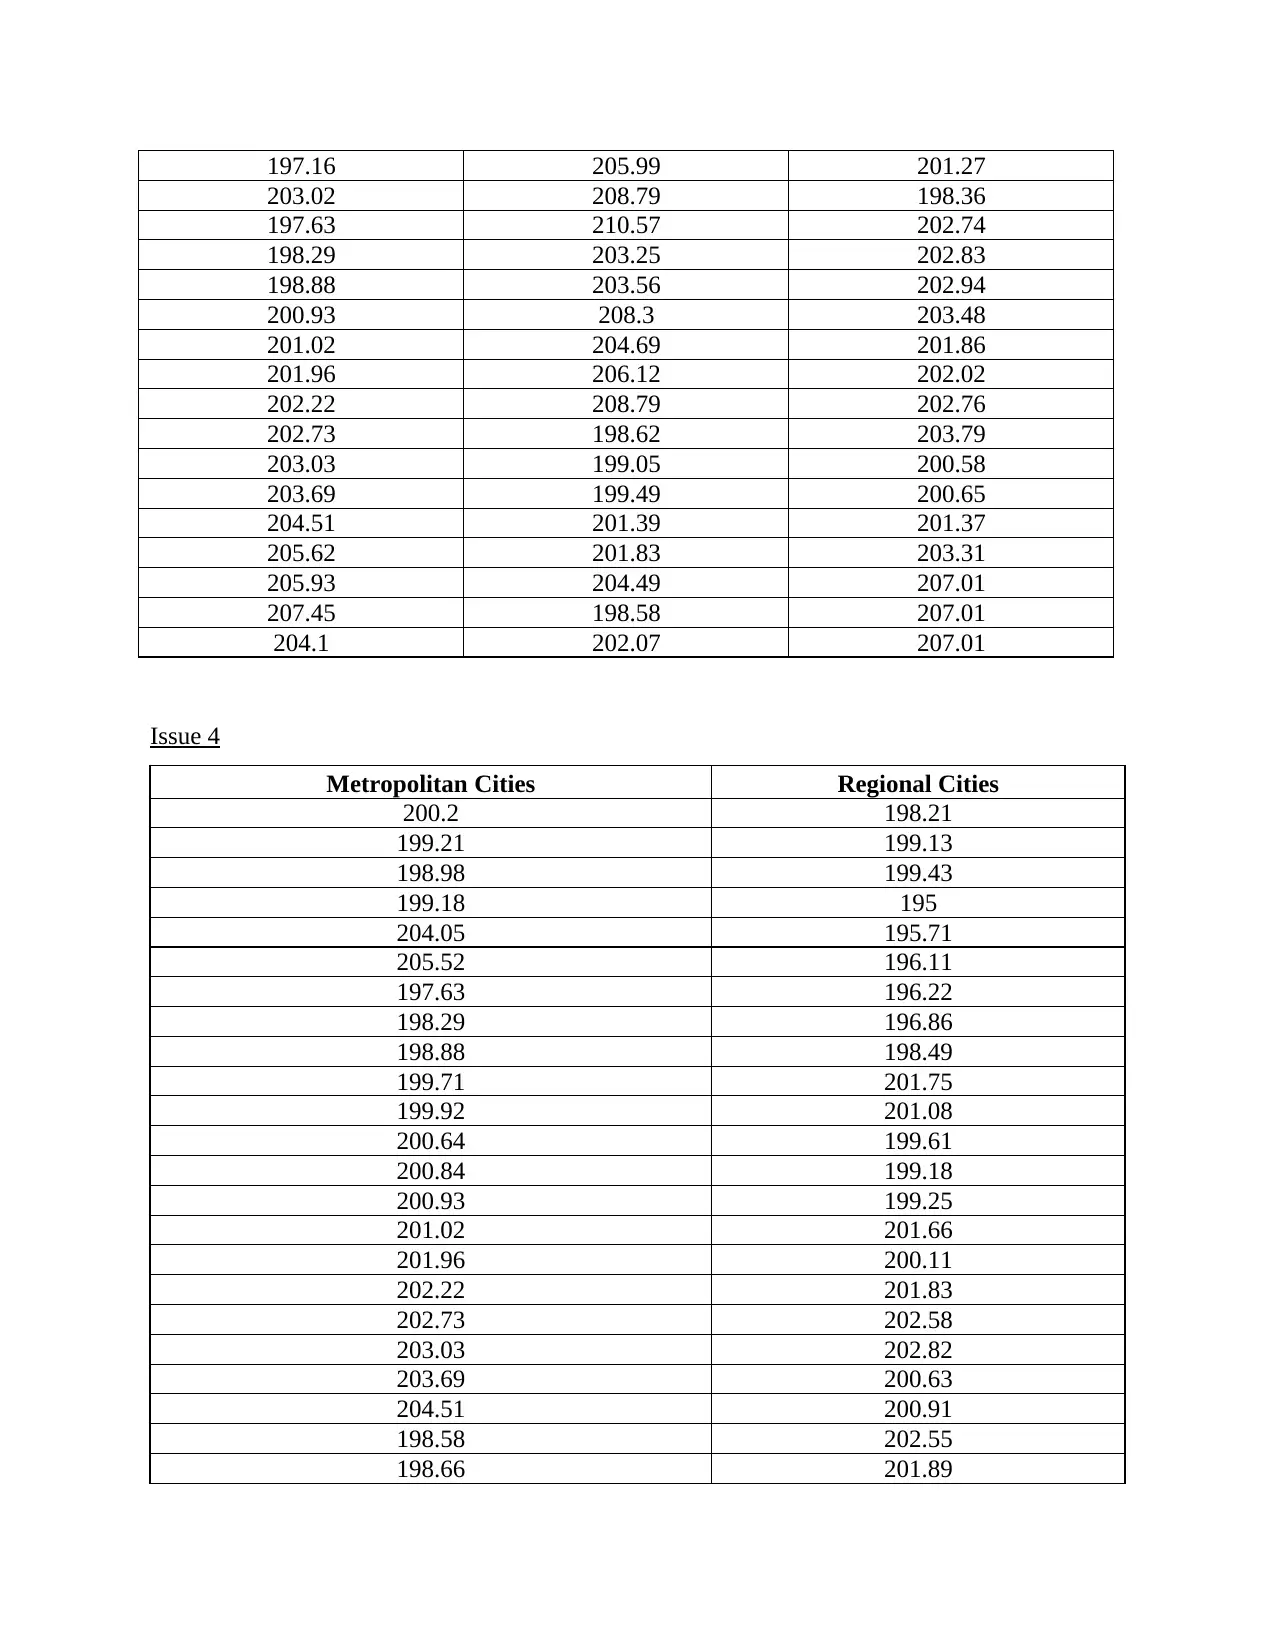
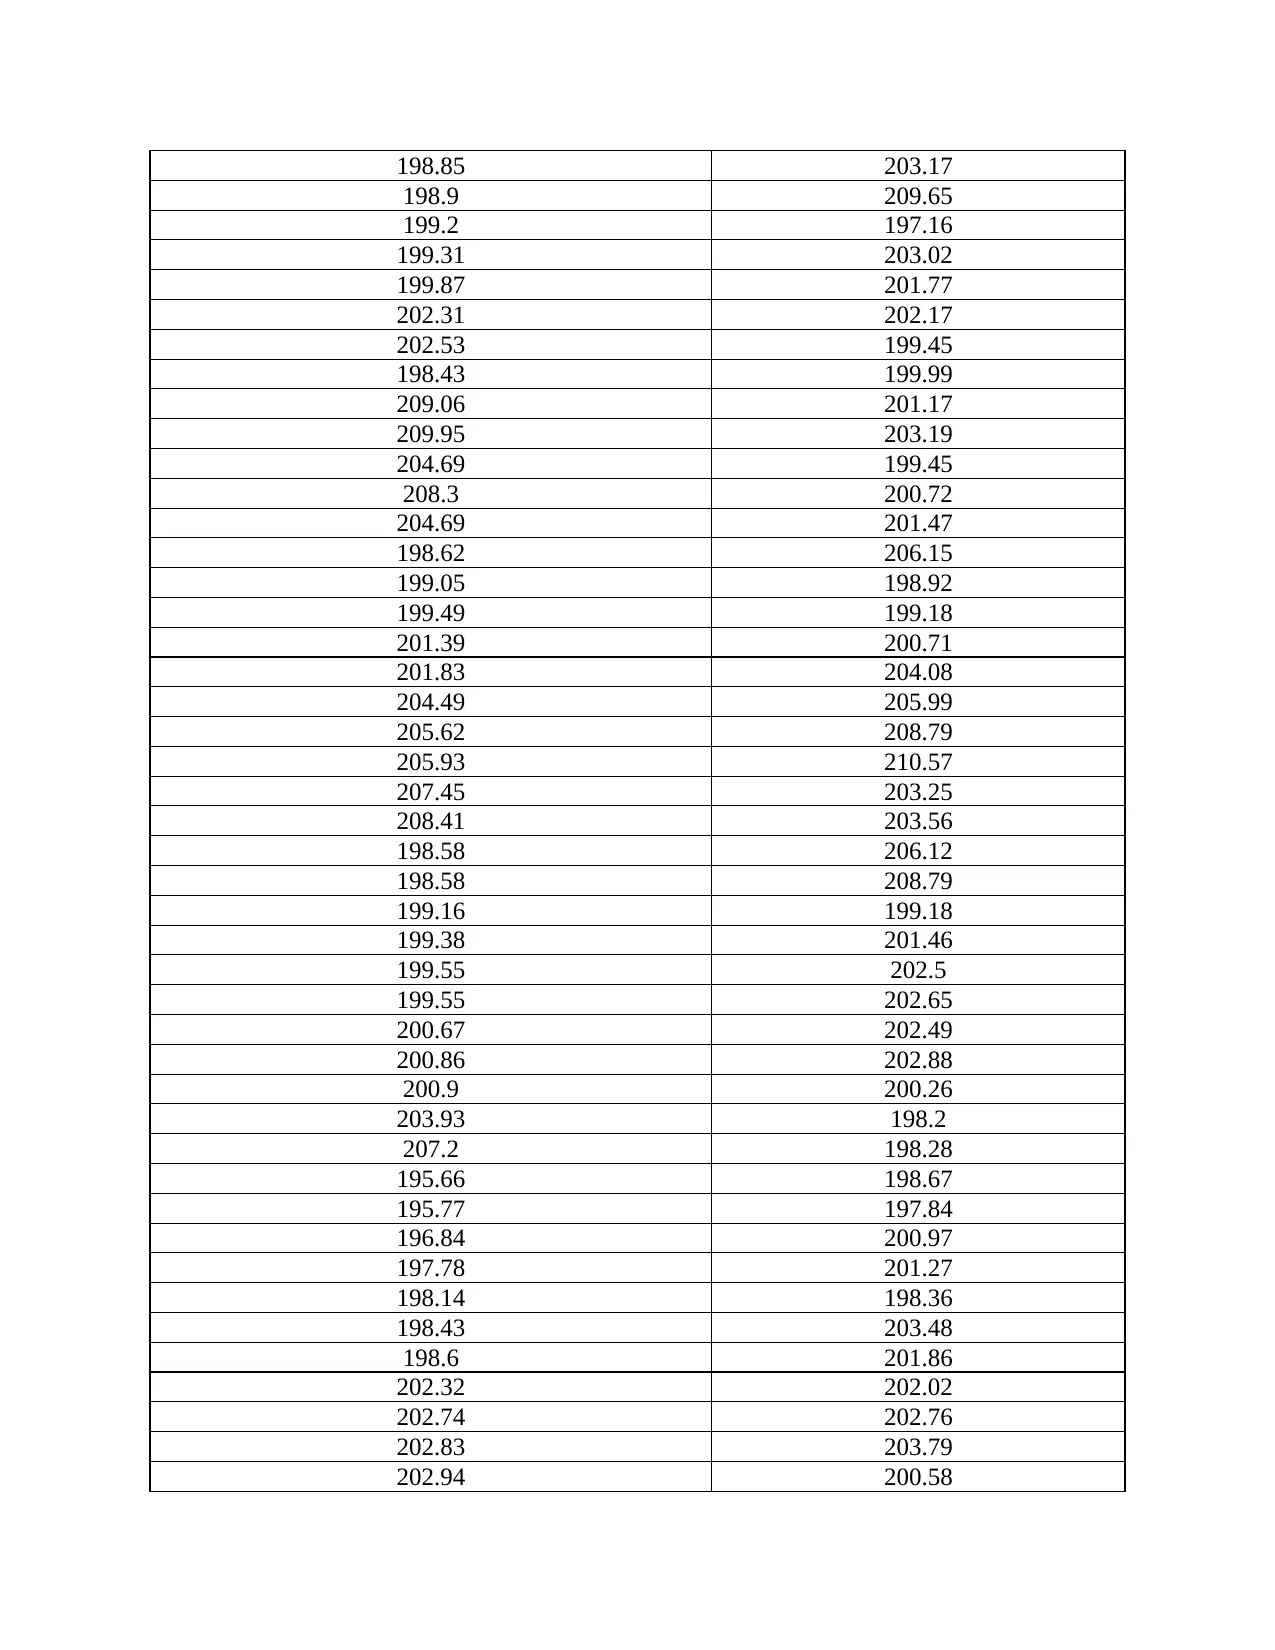
This report presents a business analytics analysis of Cunningham Holdings' accommodation data, focusing on pricing, brands, and locations. The study addresses five key issues: determining average pricing by brand, state, and location; analyzing price differentiation among accommodation brands, states, and locations; and assessing the impact of the Comfort brand on internal competition. The analysis utilizes Excel's pivot tables, analysis tools, and PHStat to derive statistical insights. The findings indicate that average pricing is consistent across brands, states, and locations. However, price differentiation exists among accommodation brands. The report concludes that there is no statistical difference between the price and state and also between the location and price. The appendix provides detailed data tables supporting the analysis.

Analytical case study of Cunningham
Holdings
Holdings
Secure Best Marks with AI Grader
Need help grading? Try our AI Grader for instant feedback on your assignments.

Table of Contents
Issue 1 current average price of differentiation by brands, state and locations...........................2
Issue 2 Price differentiation exist between price and brands.......................................................3
Issue 3: Price differentiation exist between state and brands......................................................4
Issue 4 Price differentiation between location and accommodation brands................................4
Issue 5..........................................................................................................................................5
APPENDIX......................................................................................................................................6
Issue 2..........................................................................................................................................6
Issue 3..........................................................................................................................................7
Issue 4..........................................................................................................................................8
Issue 5........................................................................................................................................10

Overview
The current study is based upon the Cunninghm Holdings which is a diversified family
owned business and it also focus on the sustainable products and services which is underpinned
by the have a global business perspective and build leadership and management skills that helps
to meet the define aim. For that the study will analyse the 5 issues through which the company
determine the new price of its accommodation facilities. Therefore, current study will help to
determine the current average price of accommodation as per brands, states and locations.
Further, study will analyze price differentiation exist between the state, location and comfort
brand with accommodation brands.
Issue 1 current average price of differentiation by brands, state and locations
Particulars Average of Price
Resort 200.2704167
Cottage 202.65625
Classic 201.4627083
Grand Total 201.463125
Row Labels Average of Price
NSW 201.02375
QLD 202.196875
VIC 201.16875
Grand Total 201.463125
Row Labels Average of Price
Metropolitan Cities 201.5591667
Regional Cities 201.3670833
Grand Total 201.463125
Interpretation: From the above, it is analyzed that the average price of all the i.e. Brand,
comfort and location is $201.463 such that average price of the accommodation by brand, stated
and location is not varies. From the above table, it is interpreted that by using excel,
accommodation price of all the areas is similar and that is why, the price is nit varies as per the
availability and it is fixed i.e. 201. 46 in dollars.

Issue 2 Price differentiation exist between price and brands
Particulars Price of resort Price of Cottage Price of Classic
Price of resort 1 0.27 0.24
Price of Cottage 0.27 1 0.49
Price of Classic 0.24 0.49 1
Descriptive statistics
Particulars Resort Cottage Classic
Mean 200.2704 202.6563 201.4627
Standard Error 0.393541 0.445979 0.48986
Median 199.55 202.695 200.995
Mode 199.18 198.43 #N/A
Standard Deviation 2.72653 3.08983 3.393848
Sample Variance 7.433966 9.547049 11.5182
Kurtosis 0.860547 0.692926 -0.20077
Skewness 0.78074 0.76659 0.638174
Range 12.01 12.94 13.54
Minimum 195 197.63 196.11
Maximum 207.01 210.57 209.65
Sum 9612.98 9727.5 9670.21
Count 48 48 48
ANOVA
Source of
Variation SS df MS F P-value F crit
Rows 734.73 47 15.63263 2.877548 0.000212 1.623755
Columns 34.19 1 34.189 6.293278 0.015628 4.0471
Error 255.33 47 5.432622
Total 1024.256 95
Interpretation: As per the above, it is interpreted that the significant value is 0.0002 which is
below from 0.05 and as a result, there is a different between the factors. Such that customers
Secure Best Marks with AI Grader
Need help grading? Try our AI Grader for instant feedback on your assignments.

analysed that price is changes as per the brands. For instance, when a customer prefer to stay in a
resort, then they have to pay high value as compared to others two. While on the other side,
when customer stay in cottage then they pay lower amount as compared to resort, further those
who stay in classic then they pay minimum amount. Thus this Anova test is also shows that there
is a significant difference between the price and accommodation brands
Issue 3: Price differentiation exist between state and brands
Anova: Single Factor
SUMMARY
Groups Count Sum Average Variance
NSW 48 9649.14 201.0238 9.708803
QLD 48 9705.45 202.1969 11.96402
VIC 48 9656.1 201.1688 8.897547
ANOVA
Source of
Variation SS df MS F P-value F crit
Between Groups 39.26861 2 19.63431 1.926798 0.149428 3.060292
Within Groups 1436.807 141 10.19012
Total 1476.076 143
Interpretation: As per the above it is interpreted by the Anova table, that there is no statistical
difference between the price and state because the significant value is 0.14 which is above off
0.05. As a result, it is stated that the price of the accommodation did not changes as per the state
and it is possible only if the state have rich location then the price did not affect due to state .
Issue 4 Price differentiation between location and accommodation brands
Anova: Single Factor
SUMMARY
Groups Count Sum Average Variance
Metropolitan
Cities 72 14512.26 201.5592 11.25642
Regional Cities 72 14498.43 201.3671 9.514677
ANOVA

Source of
Variation SS df MS F P-value F crit
Between Groups 1.328256 1 1.328256 0.127895 0.721156 3.907782
Within Groups 1474.748 142 10.38555
Total 1476.076 143
Interpretation: According to the above, it is interpreted that by applying the anova test in order
to determine the interdependencies between two factors, it is analyzed that the significant factor
value is 0.72 which means that there is no statistical difference between state and price. It is so
because the value is above 0.05 and that is why, it shows no relationship between these.
Therefore, it can be stated that price did not depend upon the location for instance when a guest
wants to stay in Metropolitan cities or regional cities, then it has to pay the similar amount but itr
does depend upon the brand which they prefer.
Issue 5

APPENDIX
Issue 2
Price of resort Price of Cottage Price of Classic
200.2 201.75 196.11
198.21 201.08 196.22
199.21 199.18 196.86
198.98 201.83 198.49
199.13 202.82 200.11
199.43 204.05 205.52
195 200.91 200.63
195.71 202.55 201.89
199.61 203.17 209.65
199.18 197.63 197.16
199.25 200.93 201.02
201.66 202.22 201.96
202.58 203.03 202.73
203.02 203.69 198.66
198.29 204.51 198.85
198.88 201.77 198.9
199.71 202.31 199.31
199.92 202.53 202.17
200.64 198.43 199.45
200.84 201.17 200.72
198.58 203.19 206.15
199.2 201.47 198.92
199.87 200.71 199.18
199.99 209.06 203.25
199.45 209.95 203.56
204.08 208.79 208.3
204.69 210.57 204.69
205.99 208.79 201.39
206.12 198.62 201.83
199.05 204.49 205.62
199.49 198.58 205.93
199.18 203.93 207.45
199.16 207.2 208.41
199.38 202.65 198.58
199.55 198.14 200.67
199.55 198.43 200.86
202.5 198.6 200.9
195.66 202.88 201.46
195.77 198.67 196.84
Paraphrase This Document
Need a fresh take? Get an instant paraphrase of this document with our AI Paraphraser

202.49 201.27 197.78
200.26 202.74 202.32
197.84 202.83 198.2
198.36 202.94 198.28
200.58 203.48 200.97
200.65 202.76 201.86
202.07 203.79 202.02
207.01 203.31 201.37
207.01 204.1 207.01
Issue 3
NSW QLD VIC
200.2 199.71 208.41
198.21 199.92 198.58
199.21 200.64 199.18
198.98 200.84 199.16
199.13 198.58 199.38
199.43 198.66 199.55
195 198.85 199.55
195.71 198.9 200.67
196.11 199.2 200.86
196.22 199.31 200.9
196.86 199.87 203.93
198.49 201.77 207.2
201.75 202.17 201.46
201.08 202.31 202.5
199.61 202.53 202.65
199.18 198.43 195.66
199.18 199.45 195.77
199.25 199.99 196.84
201.66 201.17 197.78
200.11 203.19 198.14
201.83 199.45 198.43
202.58 200.72 198.6
202.82 201.47 202.32
204.05 206.15 202.49
205.52 198.92 202.88
200.63 199.18 200.26
200.91 200.71 198.2
202.55 204.08 198.28
201.89 209.06 198.67
203.17 209.95 197.84
209.65 204.69 200.97

197.16 205.99 201.27
203.02 208.79 198.36
197.63 210.57 202.74
198.29 203.25 202.83
198.88 203.56 202.94
200.93 208.3 203.48
201.02 204.69 201.86
201.96 206.12 202.02
202.22 208.79 202.76
202.73 198.62 203.79
203.03 199.05 200.58
203.69 199.49 200.65
204.51 201.39 201.37
205.62 201.83 203.31
205.93 204.49 207.01
207.45 198.58 207.01
204.1 202.07 207.01
Issue 4
Metropolitan Cities Regional Cities
200.2 198.21
199.21 199.13
198.98 199.43
199.18 195
204.05 195.71
205.52 196.11
197.63 196.22
198.29 196.86
198.88 198.49
199.71 201.75
199.92 201.08
200.64 199.61
200.84 199.18
200.93 199.25
201.02 201.66
201.96 200.11
202.22 201.83
202.73 202.58
203.03 202.82
203.69 200.63
204.51 200.91
198.58 202.55
198.66 201.89

198.85 203.17
198.9 209.65
199.2 197.16
199.31 203.02
199.87 201.77
202.31 202.17
202.53 199.45
198.43 199.99
209.06 201.17
209.95 203.19
204.69 199.45
208.3 200.72
204.69 201.47
198.62 206.15
199.05 198.92
199.49 199.18
201.39 200.71
201.83 204.08
204.49 205.99
205.62 208.79
205.93 210.57
207.45 203.25
208.41 203.56
198.58 206.12
198.58 208.79
199.16 199.18
199.38 201.46
199.55 202.5
199.55 202.65
200.67 202.49
200.86 202.88
200.9 200.26
203.93 198.2
207.2 198.28
195.66 198.67
195.77 197.84
196.84 200.97
197.78 201.27
198.14 198.36
198.43 203.48
198.6 201.86
202.32 202.02
202.74 202.76
202.83 203.79
202.94 200.58
Secure Best Marks with AI Grader
Need help grading? Try our AI Grader for instant feedback on your assignments.

202.07 200.65
207.01 201.37
207.01 203.31
207.01 204.1
Issue 5
207.01 201.37
207.01 203.31
207.01 204.1
Issue 5
1 out of 11
Related Documents

Your All-in-One AI-Powered Toolkit for Academic Success.
 +13062052269
info@desklib.com
Available 24*7 on WhatsApp / Email
Unlock your academic potential
© 2024  |  Zucol Services PVT LTD  |  All rights reserved.