Data Driven Decisions: A Business Analytics Report for BIJ and WFTT
VerifiedAdded on 2023/02/07
|15
|3224
|296
Report
AI Summary
This report provides a comprehensive analysis of data-driven decision-making in business, focusing on the case of Bangles Worldwide Jewelers (BIJ) and the consultancy firm Woods out from Tree (WFTT). The report begins with an introduction to the importance of data analytics in business, highlighting its role in predictive analytics and business intelligence. It outlines a project plan, including data collection, cleaning, analysis, and visualization. Key data quality issues, such as duplicate entries and missing data, are identified along with their respective remedies. The report then delves into data analysis, presenting sales data for Japan, the USA, and the UK, and analyzing the impact of a promotional campaign. Data charting and commentary are used to visualize the data and identify trends. The report concludes with recommendations for BIJ based on the findings, emphasizing the importance of Key Performance Indicators (KPIs) and data-driven strategies for business growth and efficiency. The report showcases the practical application of data analysis in a real-world business scenario, offering valuable insights into how data can be used to inform strategic decisions and improve business outcomes. The report covers a range of topics, including data collection, cleaning, integration, analysis, visualization, and proposing decisions, demonstrating a holistic approach to data-driven business insights.

1
Data Driven Decisions for Business
Name:
Institution:
Date:
Data Driven Decisions for Business
Name:
Institution:
Date:
Paraphrase This Document
Need a fresh take? Get an instant paraphrase of this document with our AI Paraphraser
2
Table of Contents
Introduction......................................................................................................................................3
Task 1: Introduction and Project Plan..............................................................................................4
Task 2: Data quality issues and remedies........................................................................................6
Task 3: Data analysis and commentary...........................................................................................8
Task 4 Data charting and commentary..........................................................................................10
Task 5 Conclusions and Recommendations..................................................................................13
3
Introduction
Businesses willing the advice and protection provided by data insights might be helpful
for businesses looking to take preemptive action. Companies may fully manage their decision-
making process using predictive analytics, allowing them to act quickly when needed. A
corporation may benefit directly from business intelligence in terms of worker productivity. Ever
since inception, analytics has aided businesses in promoting growth. Business analytics quickly
and easily collects a sizable volume of data for examination. As just a result, businesses may
make decisions more quickly and effectively. Risks can be reduced with the aid of business
intelligence. Companies may lessen both short- and long-term risk by assisting them in taking
the often these informed decisions feasible using information such customer patterns, habits, as
well as other knowledge that really is readily available (Mikalef, 2020). to take preventative
action can indeed benefit from the guidance and covering that data analytics offers. Businesses
can use business intelligence to completely manage their judgment call procedure, which enables
them to respond in timely manner when necessary. Data analytics may directly help a company
in the area of productivity. Analytics has helped organisations increase their productivity ever
since it was first used. Business analytics gathers a significant amount of information quickly
and simply for analysis. As a result, firms may decide more swiftly and with greater quality.
Data analytics can help to minimise threats. By supporting them in making the most effective
choices possible based on information like consumer trends, tendencies, and other data that is
accessible, it can help businesses decrease both short-term and long-term danger (Mikalef,
2020). The main goal of a systems administrator is to help organisations make better choices.
WFTT data analysts gather, manage, and analyse data to offer market intelligence using methods
from a range of fields, including math, analytics, and coding. The ability of the organisation to
⊘ This is a preview!⊘
Do you want full access?
Subscribe today to unlock all pages.
Trusted by 1+ million students worldwide
4
make decisions is aided by analysts' extraction of data from various sources and interpretation of
the findings. For the average person, drawing conclusions out from original information is
exceedingly difficult. Utilizing the right software speeds up the analysis of the data. WFTT
analysts predict any trends by comparing the firm's productivity throughout the reporting quarter
to that over the prior quarters. Business analytics consists of analyzing data to build predictive
models, implementing strategies, and sharing the outcomes with staff and clients. By utilising
analytics and simulation models to produce market intelligence, it brings a data-driven approach
to the corporate environment (Conboy, 2020). Business intelligence is a tool used by
organisations to make data-driven choices. Organizations may improve their efficiency with the
use of data analytics, and these insight will enable these companies to streamline and optimize
their operations. It is not surprising that data-driven companies frequently surpass their rivals in
terms of corporate intelligence.
Task 1: Introduction and Project Plan
Most successful companies base their decisions on information. Researching technique
gives businesses insight into their customers, allowing them to tailor customer service to their
needs, offer the most personalization, and forge lasting relations with customers. The modern era
has seen a substantial corporate growth in data analytics. The technique of data analysis is
regarded as the most important corporate strategy for sensible decision-making. Collecting data
skills must be utilised in the economic, commercial, scientific, and healthcare sectors. The
consultancy Woods out from Tree (WFTT), whose main client is the globally active business
Bangles Worldwide Jewelers (BIJ), is unable to evaluate data that would assist in financial
decisions, based on the circumstances. The financial analyst must genuinely make
recommendations based on knowledge of both the customer and company regulations
Paraphrase This Document
Need a fresh take? Get an instant paraphrase of this document with our AI Paraphraser
5
(Kristoffersen, 2021). Before doing data-driven study, the person is required to seek data on the
UK promotional campaign. Throughout this way, industry experts can assess the existing
situation and assist in determining the best course of action.
This evaluative report would assess the submitted material using statistics and statistics.
This article must first discuss common data problems and the required remedies. A summary of
both the basic data issues found in the BIJ collection would be presented in the for another
paragraph. The outcomes of a condensed computation using the study's information would be
shown. These information charting and understanding skills will be used to produce graphical
images of the results. The outcome will then be reviewed, and the BIJ Boards must in fact be
given some tactical recommendations. Using their knowledge of the data cleansing, the systems
analyst will decide whether the marketing campaign had a favorable, unfavorable, or balanced
influence on revenue development within the UK (Mikalef, 2020).
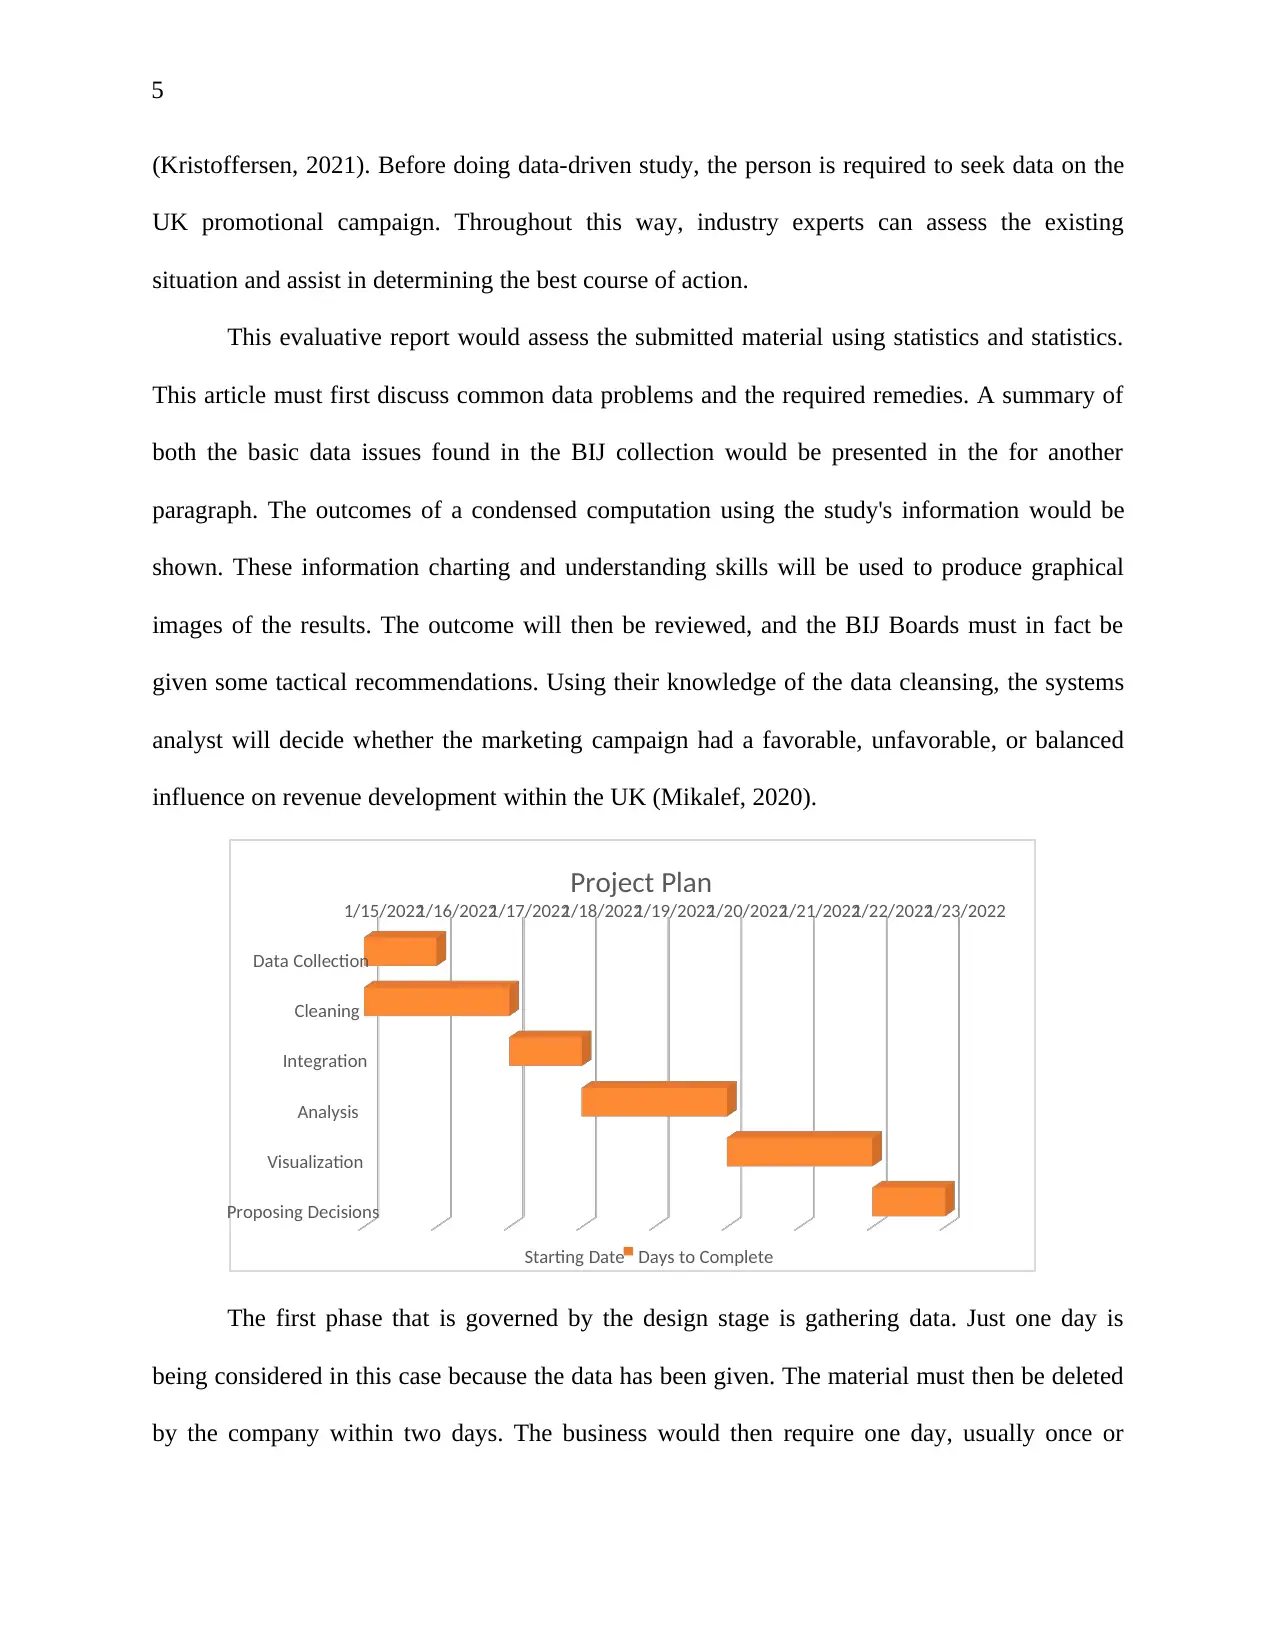
The first phase that is governed by the design stage is gathering data. Just one day is
being considered in this case because the data has been given. The material must then be deleted
by the company within two days. The business would then require one day, usually once or
Data Collection
Cleaning
Integration
Analysis
Visualization
Proposing Decisions
1/15/20221/16/20221/17/20221/18/20221/19/20221/20/20221/21/20221/22/20221/23/2022
Project Plan
Starting Date Days to Complete
(Kristoffersen, 2021). Before doing data-driven study, the person is required to seek data on the
UK promotional campaign. Throughout this way, industry experts can assess the existing
situation and assist in determining the best course of action.
This evaluative report would assess the submitted material using statistics and statistics.
This article must first discuss common data problems and the required remedies. A summary of
both the basic data issues found in the BIJ collection would be presented in the for another
paragraph. The outcomes of a condensed computation using the study's information would be
shown. These information charting and understanding skills will be used to produce graphical
images of the results. The outcome will then be reviewed, and the BIJ Boards must in fact be
given some tactical recommendations. Using their knowledge of the data cleansing, the systems
analyst will decide whether the marketing campaign had a favorable, unfavorable, or balanced
influence on revenue development within the UK (Mikalef, 2020).
The first phase that is governed by the design stage is gathering data. Just one day is
being considered in this case because the data has been given. The material must then be deleted
by the company within two days. The business would then require one day, usually once or
Data Collection
Cleaning
Integration
Analysis
Visualization
Proposing Decisions
1/15/20221/16/20221/17/20221/18/20221/19/20221/20/20221/21/20221/22/20221/23/2022
Project Plan
Starting Date Days to Complete
6
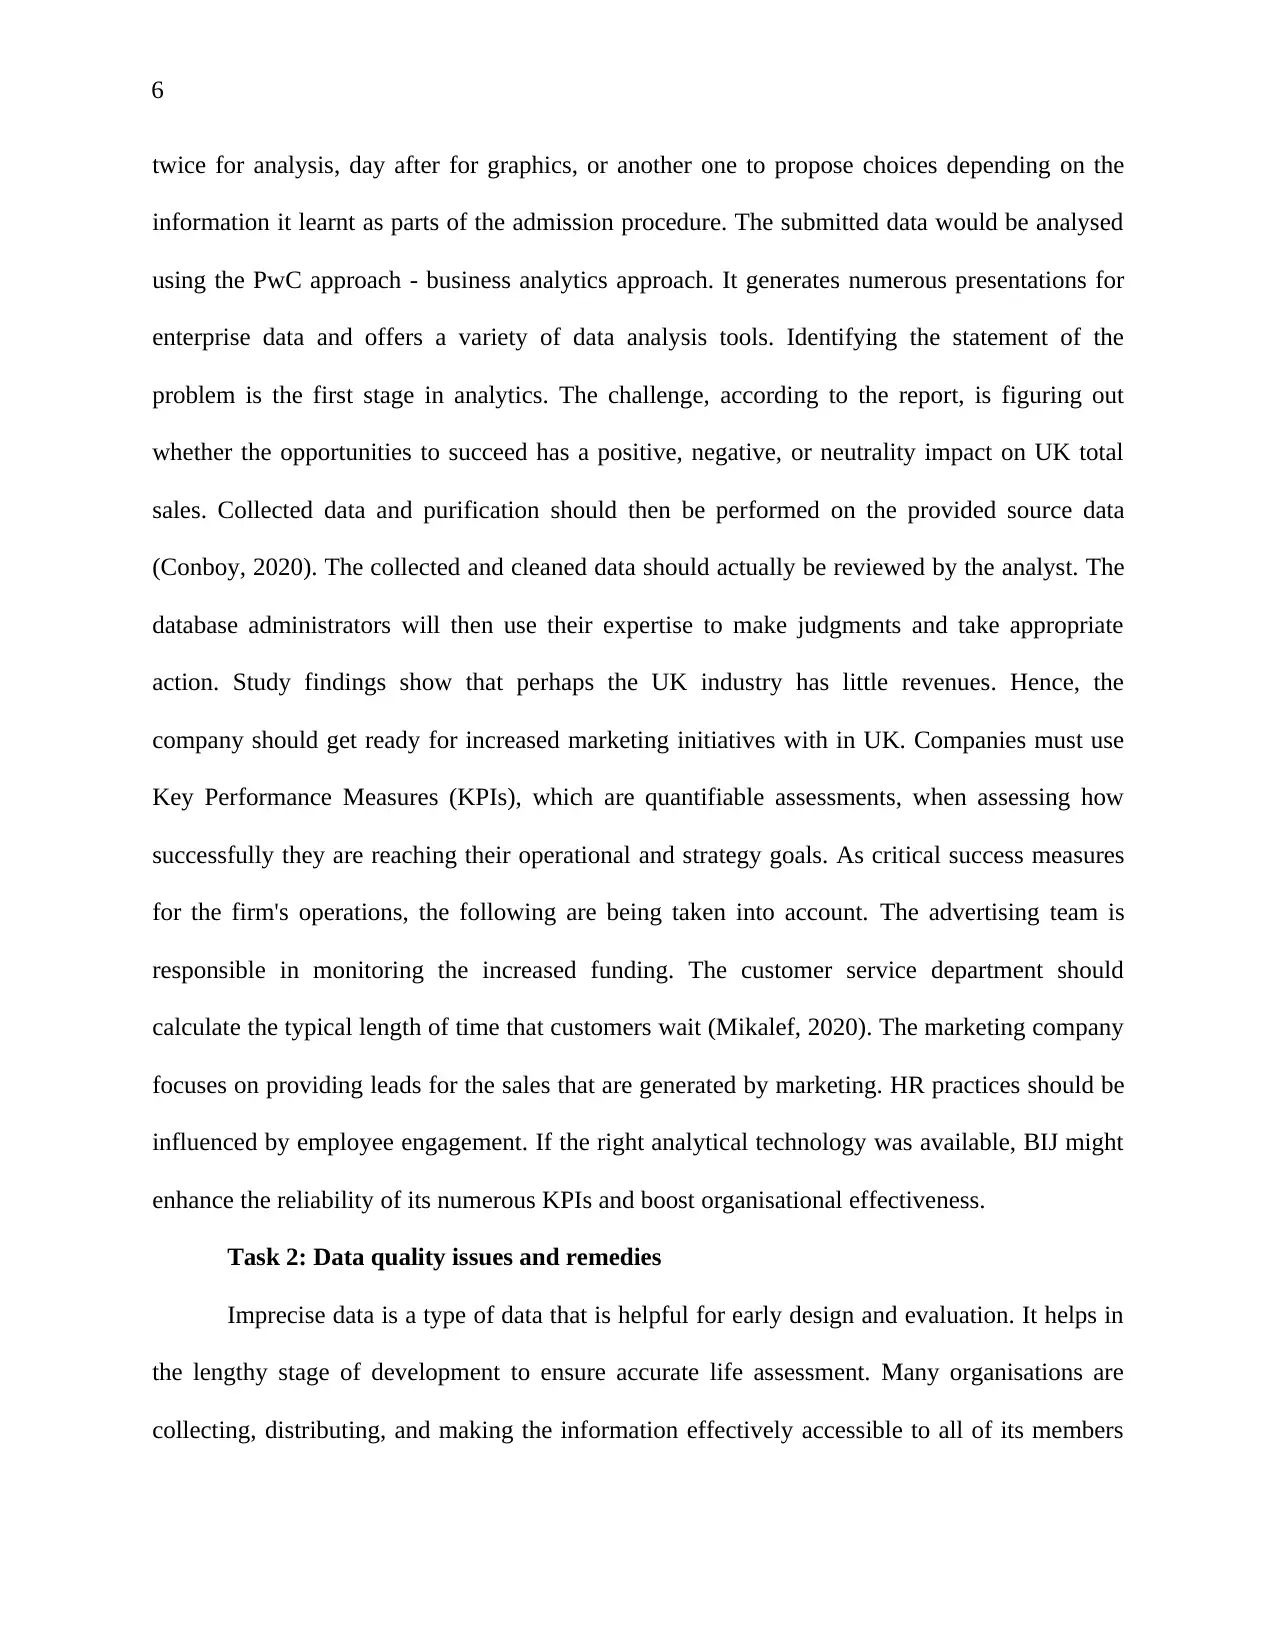
twice for analysis, day after for graphics, or another one to propose choices depending on the
information it learnt as parts of the admission procedure. The submitted data would be analysed
using the PwC approach - business analytics approach. It generates numerous presentations for
enterprise data and offers a variety of data analysis tools. Identifying the statement of the
problem is the first stage in analytics. The challenge, according to the report, is figuring out
whether the opportunities to succeed has a positive, negative, or neutrality impact on UK total
sales. Collected data and purification should then be performed on the provided source data
(Conboy, 2020). The collected and cleaned data should actually be reviewed by the analyst. The
database administrators will then use their expertise to make judgments and take appropriate
action. Study findings show that perhaps the UK industry has little revenues. Hence, the
company should get ready for increased marketing initiatives with in UK. Companies must use
Key Performance Measures (KPIs), which are quantifiable assessments, when assessing how
successfully they are reaching their operational and strategy goals. As critical success measures
for the firm's operations, the following are being taken into account. The advertising team is
responsible in monitoring the increased funding. The customer service department should
calculate the typical length of time that customers wait (Mikalef, 2020). The marketing company
focuses on providing leads for the sales that are generated by marketing. HR practices should be
influenced by employee engagement. If the right analytical technology was available, BIJ might
enhance the reliability of its numerous KPIs and boost organisational effectiveness.
Task 2: Data quality issues and remedies
Imprecise data is a type of data that is helpful for early design and evaluation. It helps in
the lengthy stage of development to ensure accurate life assessment. Many organisations are
collecting, distributing, and making the information effectively accessible to all of its members
⊘ This is a preview!⊘
Do you want full access?
Subscribe today to unlock all pages.
Trusted by 1+ million students worldwide
7
as a result of the information sociability and data democratization tactics. Although the number
of employers benefit from being a good amount of insight available to their people, others are
experiencing issues with the kind of data that members are using. This assumes increased
significance given that the bulk of organizations are considering deploying AI-based
technologies or tying their refers to a company towards the internet of things. Industry experts
identify market dynamics, supply management information, and surprisingly present top
executives with morsels of information that will help them plan the team's growth (Qasim,
2020). Even as world generates increasingly greater data, organizations and data specialists must
have the precise information they required at the appropriate moment with in correct format to
just be able to turn it into insight. There's many a few problems with generalised data, though.
The following is a summary of the problems and solutions that they raise:
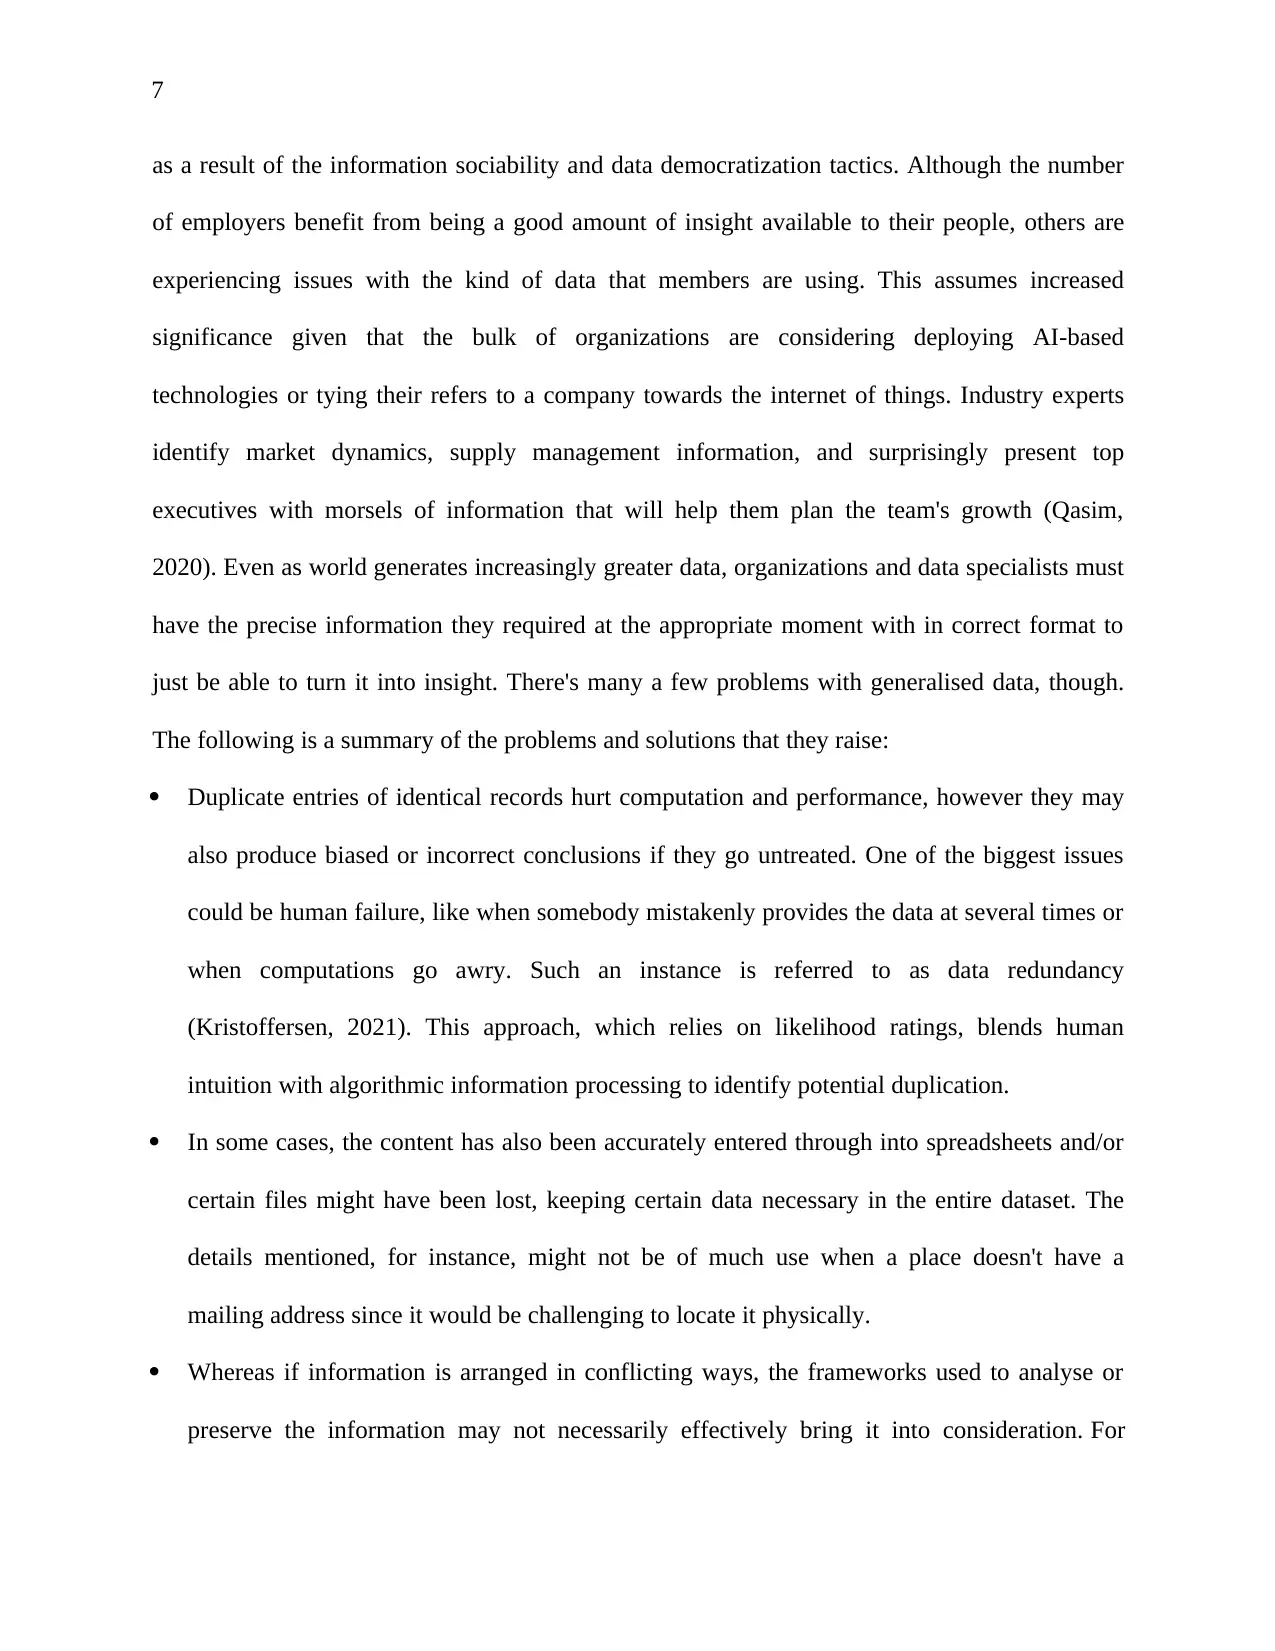
Duplicate entries of identical records hurt computation and performance, however they may
also produce biased or incorrect conclusions if they go untreated. One of the biggest issues
could be human failure, like when somebody mistakenly provides the data at several times or
when computations go awry. Such an instance is referred to as data redundancy
(Kristoffersen, 2021). This approach, which relies on likelihood ratings, blends human
intuition with algorithmic information processing to identify potential duplication.
In some cases, the content has also been accurately entered through into spreadsheets and/or
certain files might have been lost, keeping certain data necessary in the entire dataset. The
details mentioned, for instance, might not be of much use when a place doesn't have a
mailing address since it would be challenging to locate it physically.
Whereas if information is arranged in conflicting ways, the frameworks used to analyse or
preserve the information may not necessarily effectively bring it into consideration. For
as a result of the information sociability and data democratization tactics. Although the number
of employers benefit from being a good amount of insight available to their people, others are
experiencing issues with the kind of data that members are using. This assumes increased
significance given that the bulk of organizations are considering deploying AI-based
technologies or tying their refers to a company towards the internet of things. Industry experts
identify market dynamics, supply management information, and surprisingly present top
executives with morsels of information that will help them plan the team's growth (Qasim,
2020). Even as world generates increasingly greater data, organizations and data specialists must
have the precise information they required at the appropriate moment with in correct format to
just be able to turn it into insight. There's many a few problems with generalised data, though.
The following is a summary of the problems and solutions that they raise:
Duplicate entries of identical records hurt computation and performance, however they may
also produce biased or incorrect conclusions if they go untreated. One of the biggest issues
could be human failure, like when somebody mistakenly provides the data at several times or
when computations go awry. Such an instance is referred to as data redundancy
(Kristoffersen, 2021). This approach, which relies on likelihood ratings, blends human
intuition with algorithmic information processing to identify potential duplication.
In some cases, the content has also been accurately entered through into spreadsheets and/or
certain files might have been lost, keeping certain data necessary in the entire dataset. The
details mentioned, for instance, might not be of much use when a place doesn't have a
mailing address since it would be challenging to locate it physically.
Whereas if information is arranged in conflicting ways, the frameworks used to analyse or
preserve the information may not necessarily effectively bring it into consideration. For
Paraphrase This Document
Need a fresh take? Get an instant paraphrase of this document with our AI Paraphraser
8
instance, if a company administers its consumer list, the essential documentation to be kept
must be beforehand set (Dinh, 2020). Birthdates and surnames ought to be written precisely
the very same (first names, middle initial).
The information that most researchers use to develop, assess, establish theories, and forecast
events or authoritative results frequently vanishes. Each moment your data with in
information systems programme is changed or the equipment is upgraded, there is a risk that
the material may vanish or degrade. Still be cautious by making a few backups of your data
or only updating the framework from reliable sources.
9
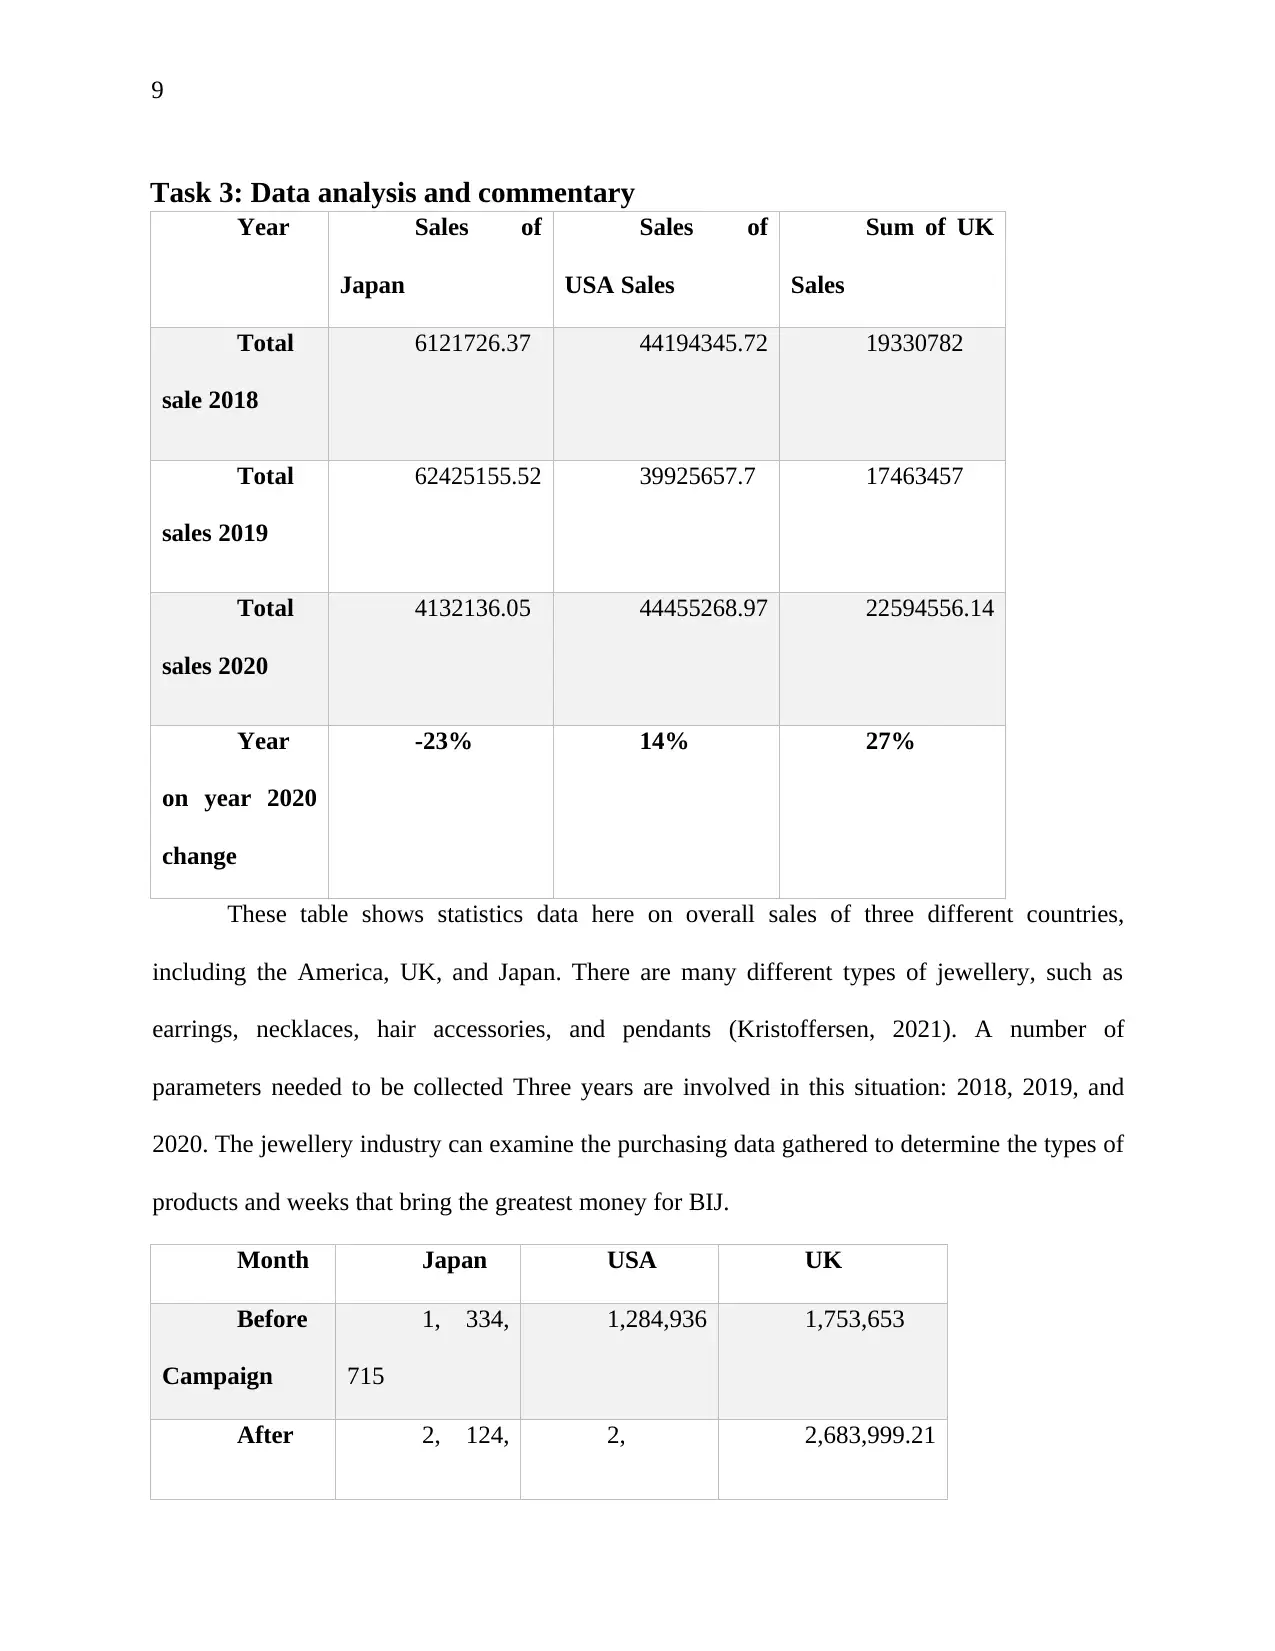
Task 3: Data analysis and commentary
Year Sales of
Japan
Sales of
USA Sales
Sum of UK
Sales
Total
sale 2018
6121726.37 44194345.72 19330782
Total
sales 2019
62425155.52 39925657.7 17463457
Total
sales 2020
4132136.05 44455268.97 22594556.14
Year
on year 2020
change
-23% 14% 27%
These table shows statistics data here on overall sales of three different countries,
including the America, UK, and Japan. There are many different types of jewellery, such as
earrings, necklaces, hair accessories, and pendants (Kristoffersen, 2021). A number of
parameters needed to be collected Three years are involved in this situation: 2018, 2019, and
2020. The jewellery industry can examine the purchasing data gathered to determine the types of
products and weeks that bring the greatest money for BIJ.
Month Japan USA UK
Before
Campaign
1, 334,
715
1,284,936 1,753,653
After 2, 124, 2, 2,683,999.21
⊘ This is a preview!⊘
Do you want full access?
Subscribe today to unlock all pages.
Trusted by 1+ million students worldwide
10
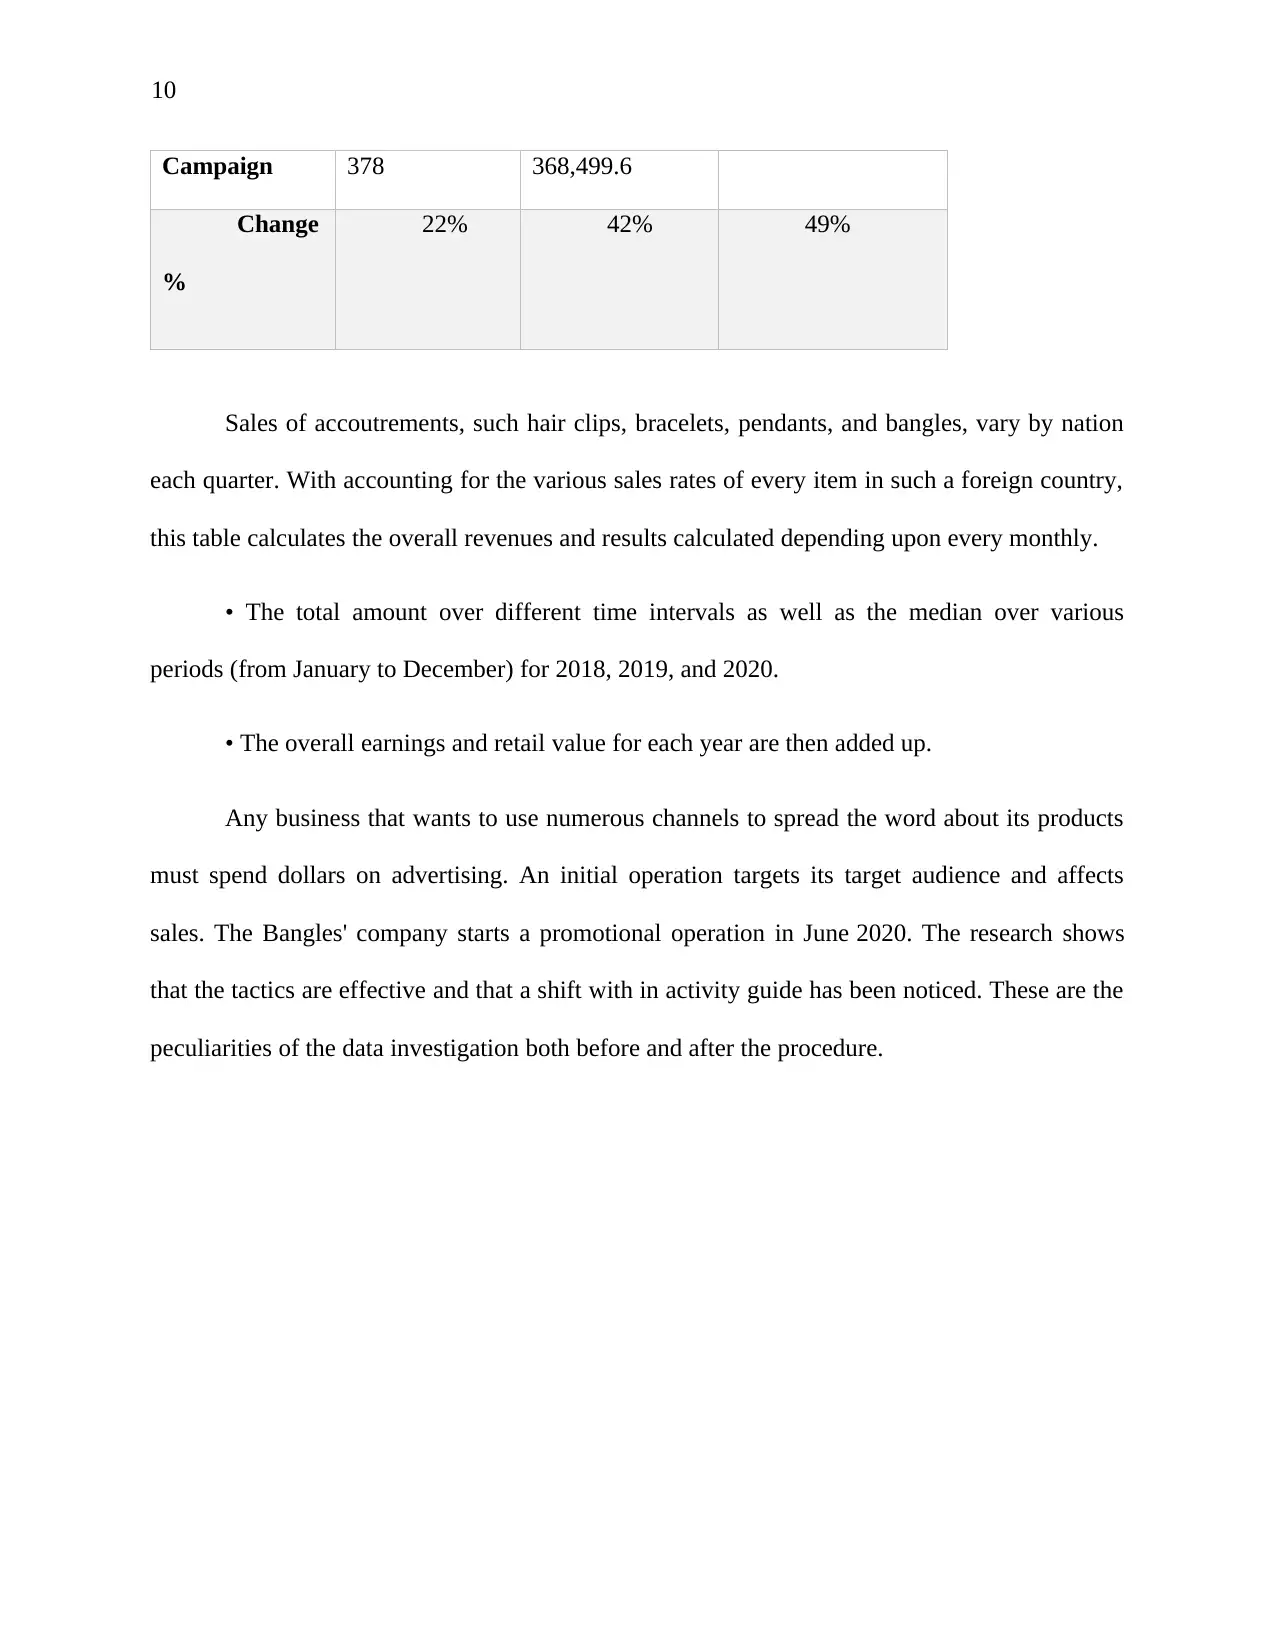
Campaign 378 368,499.6
Change
%
22% 42% 49%
Sales of accoutrements, such hair clips, bracelets, pendants, and bangles, vary by nation
each quarter. With accounting for the various sales rates of every item in such a foreign country,
this table calculates the overall revenues and results calculated depending upon every monthly.
• The total amount over different time intervals as well as the median over various
periods (from January to December) for 2018, 2019, and 2020.
• The overall earnings and retail value for each year are then added up.
Any business that wants to use numerous channels to spread the word about its products
must spend dollars on advertising. An initial operation targets its target audience and affects
sales. The Bangles' company starts a promotional operation in June 2020. The research shows
that the tactics are effective and that a shift with in activity guide has been noticed. These are the
peculiarities of the data investigation both before and after the procedure.
Paraphrase This Document
Need a fresh take? Get an instant paraphrase of this document with our AI Paraphraser
11
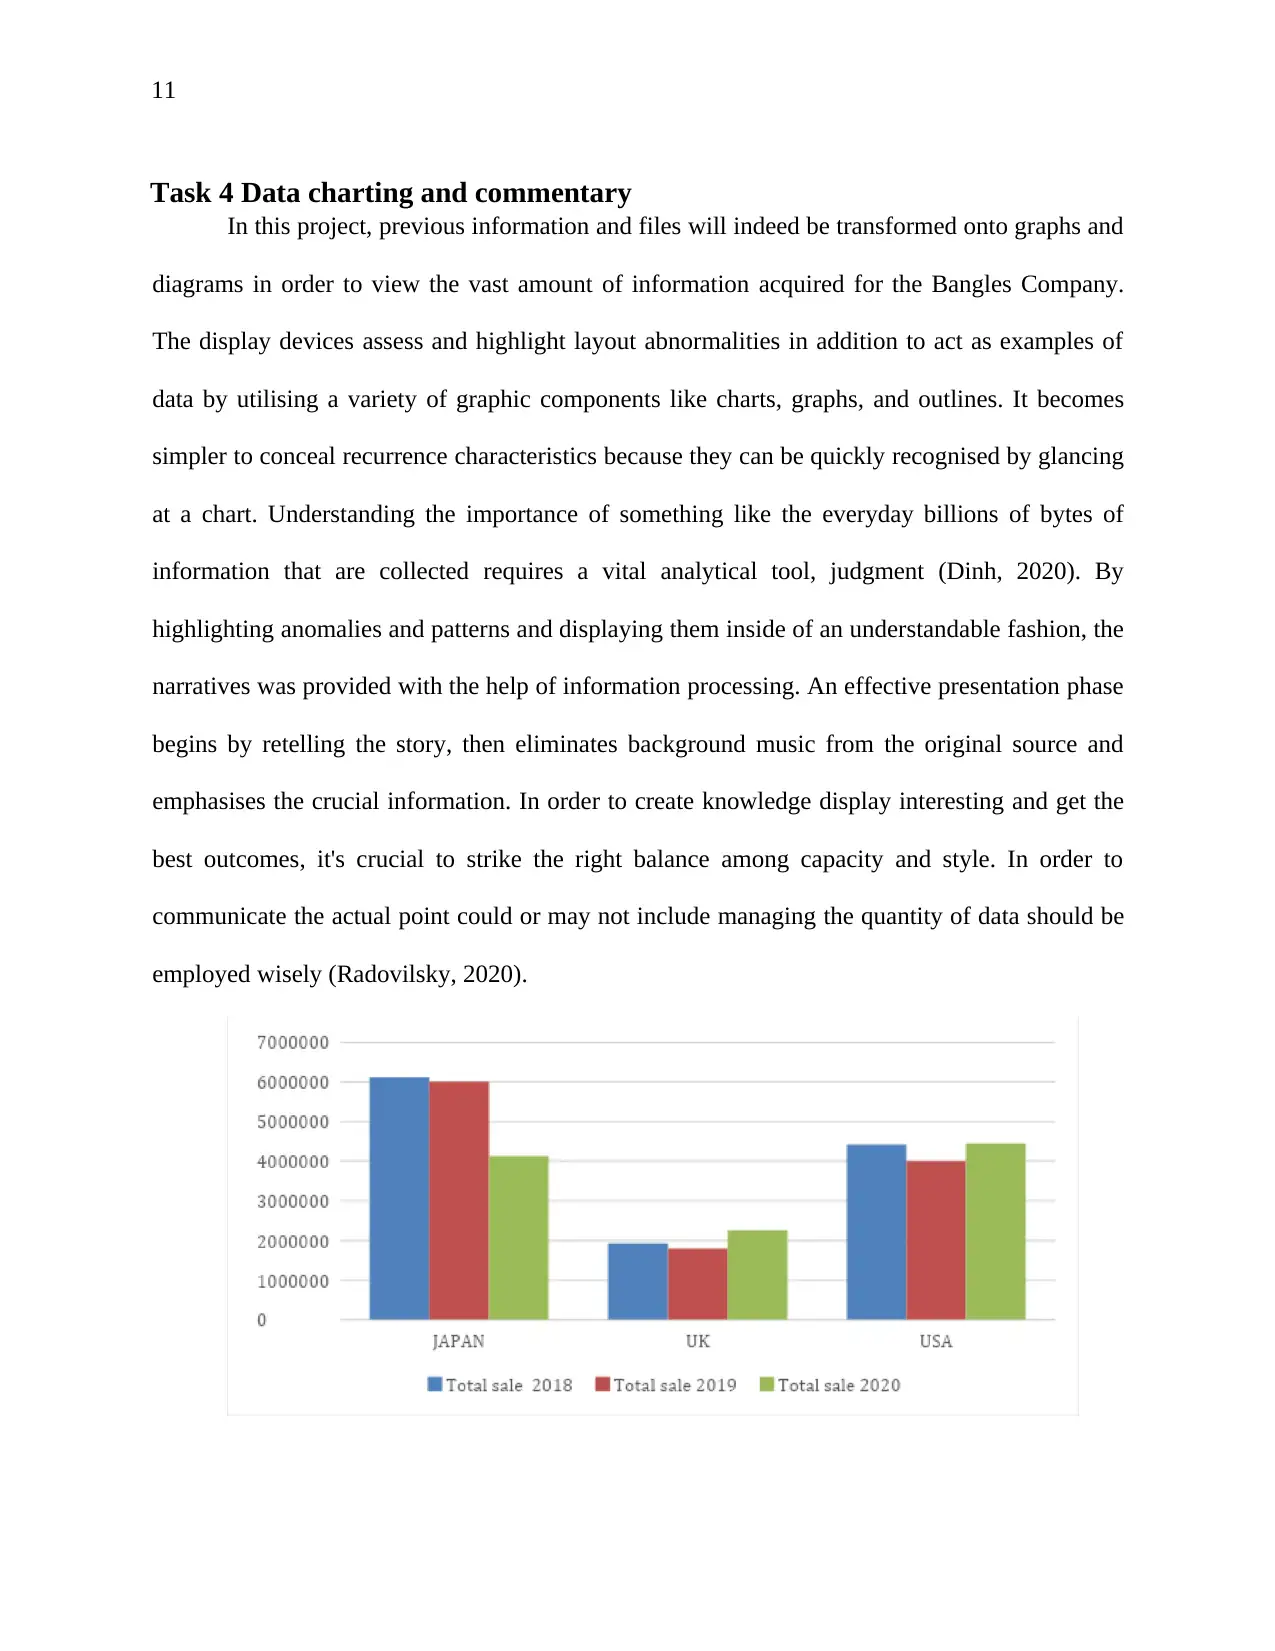
Task 4 Data charting and commentary
In this project, previous information and files will indeed be transformed onto graphs and
diagrams in order to view the vast amount of information acquired for the Bangles Company.
The display devices assess and highlight layout abnormalities in addition to act as examples of
data by utilising a variety of graphic components like charts, graphs, and outlines. It becomes
simpler to conceal recurrence characteristics because they can be quickly recognised by glancing
at a chart. Understanding the importance of something like the everyday billions of bytes of
information that are collected requires a vital analytical tool, judgment (Dinh, 2020). By
highlighting anomalies and patterns and displaying them inside of an understandable fashion, the
narratives was provided with the help of information processing. An effective presentation phase
begins by retelling the story, then eliminates background music from the original source and
emphasises the crucial information. In order to create knowledge display interesting and get the
best outcomes, it's crucial to strike the right balance among capacity and style. In order to
communicate the actual point could or may not include managing the quantity of data should be
employed wisely (Radovilsky, 2020).
12
The yearly total sales for Japan, the United Kingdom, as well as the USA are shown in
these graph. This graph clearly shows that Japan experienced strategy and business across both
2019 and 2018. Sales with in USA, meanwhile, remain basically the same as they were in 2018
and 2020. Purchases in the USA will decline in 2019. However, the sales percentage decreases
in 2020. But in comparison to such two nations, the UK comes in last. Revenue within the UK
had decreased significantly since a number of decades ago (Radovilsky, 2020). Boosting revenue
seems to be the main objective of promotional campaigns.
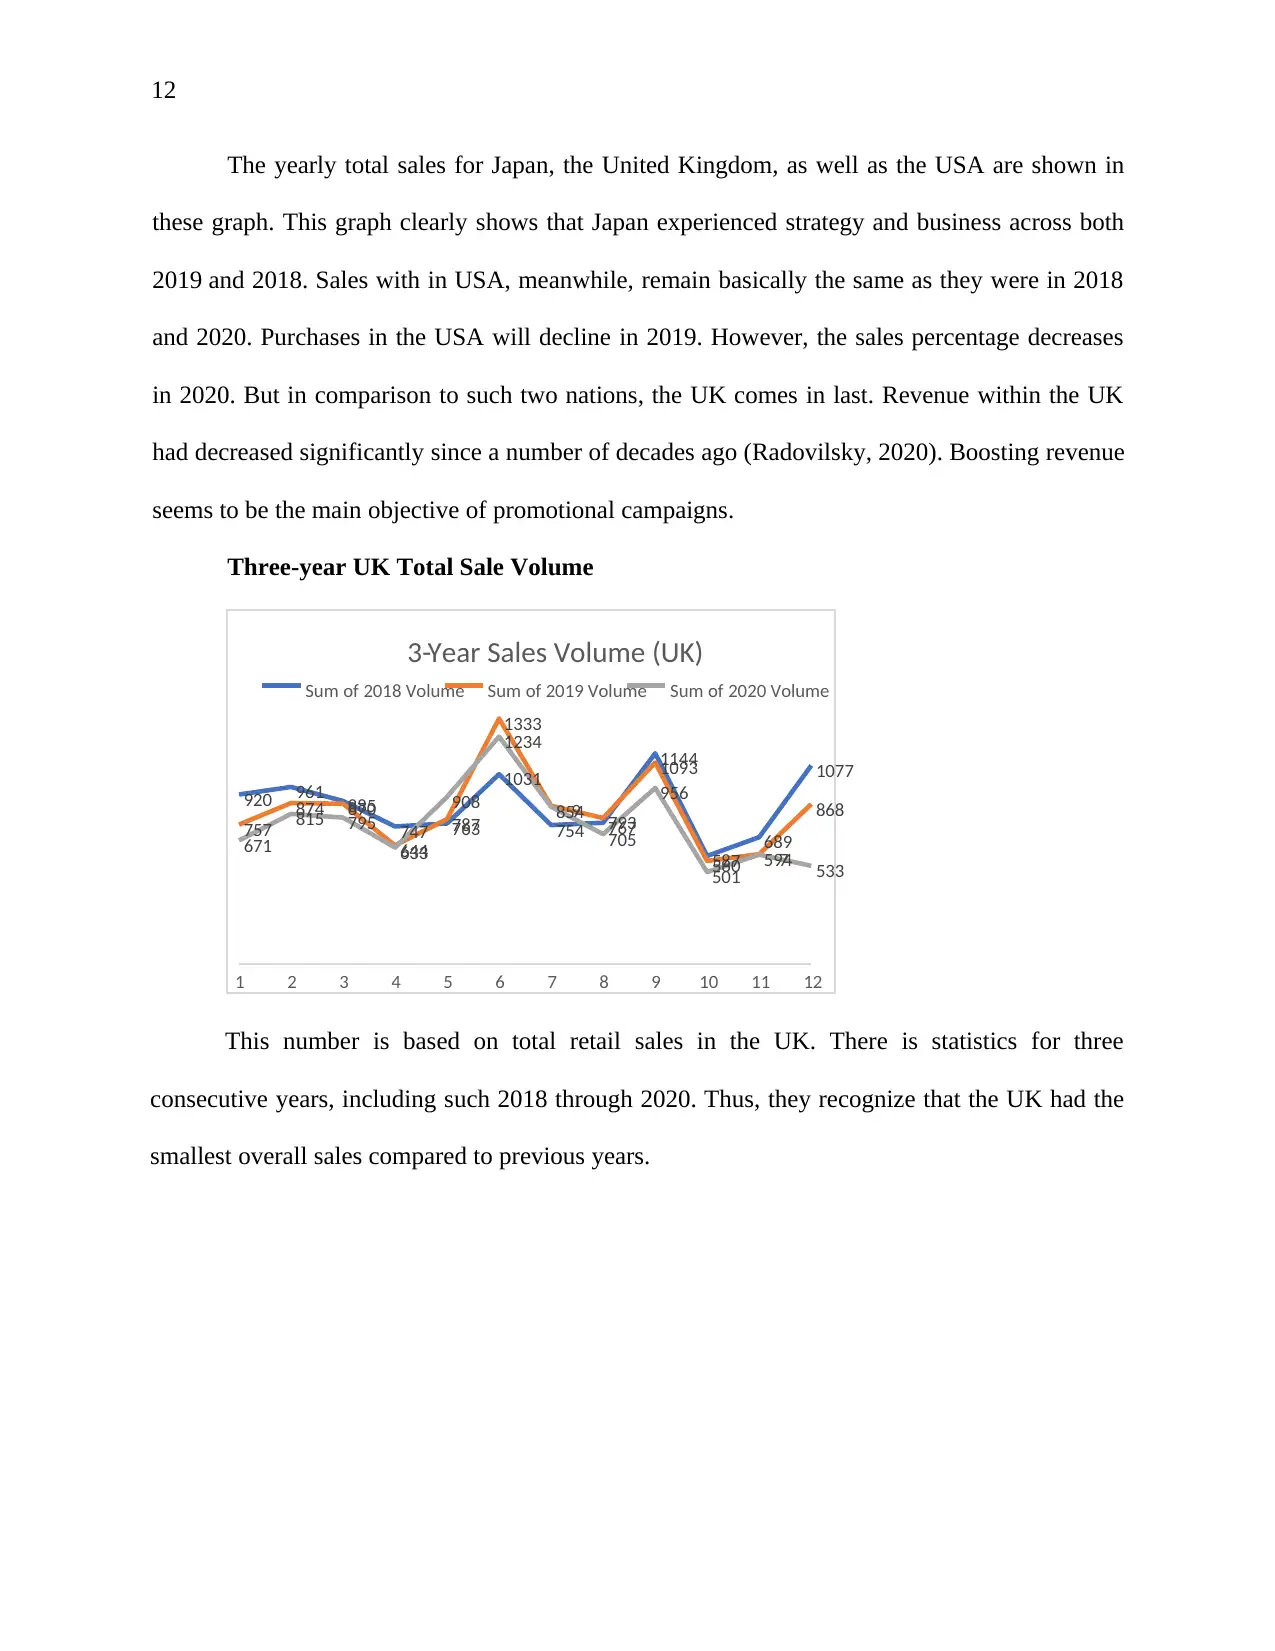
Three-year UK Total Sale Volume
This number is based on total retail sales in the UK. There is statistics for three
consecutive years, including such 2018 through 2020. Thus, they recognize that the UK had the
smallest overall sales compared to previous years.
1 2 3 4 5 6 7 8 9 10 11 12
920 961 885
747 763
1031
754 767
1144
587 689
1077
757
874 870
644
787
1333
9 793
1093
560 7
868
671
815 795
633
908
1234
854
705
956
501 594 533
Year Sales Volume (UK)3-
Sum of 2018 Volume Sum of 2019 Volume Sum of 2020 Volume
The yearly total sales for Japan, the United Kingdom, as well as the USA are shown in
these graph. This graph clearly shows that Japan experienced strategy and business across both
2019 and 2018. Sales with in USA, meanwhile, remain basically the same as they were in 2018
and 2020. Purchases in the USA will decline in 2019. However, the sales percentage decreases
in 2020. But in comparison to such two nations, the UK comes in last. Revenue within the UK
had decreased significantly since a number of decades ago (Radovilsky, 2020). Boosting revenue
seems to be the main objective of promotional campaigns.
Three-year UK Total Sale Volume
This number is based on total retail sales in the UK. There is statistics for three
consecutive years, including such 2018 through 2020. Thus, they recognize that the UK had the
smallest overall sales compared to previous years.
1 2 3 4 5 6 7 8 9 10 11 12
920 961 885
747 763
1031
754 767
1144
587 689
1077
757
874 870
644
787
1333
9 793
1093
560 7
868
671
815 795
633
908
1234
854
705
956
501 594 533
Year Sales Volume (UK)3-
Sum of 2018 Volume Sum of 2019 Volume Sum of 2020 Volume
⊘ This is a preview!⊘
Do you want full access?
Subscribe today to unlock all pages.
Trusted by 1+ million students worldwide
1 out of 15
Related Documents


Your All-in-One AI-Powered Toolkit for Academic Success.
+13062052269
info@desklib.com
Available 24*7 on WhatsApp / Email
![[object Object]](/_next/static/media/star-bottom.7253800d.svg)
Unlock your academic potential
Copyright © 2020–2026 A2Z Services. All Rights Reserved. Developed and managed by ZUCOL.