Business Analytics: Definitions, Applications, and Analysis Techniques

Verified

Added on  2023/01/13

|9
|932
|73
Report
AI Summary
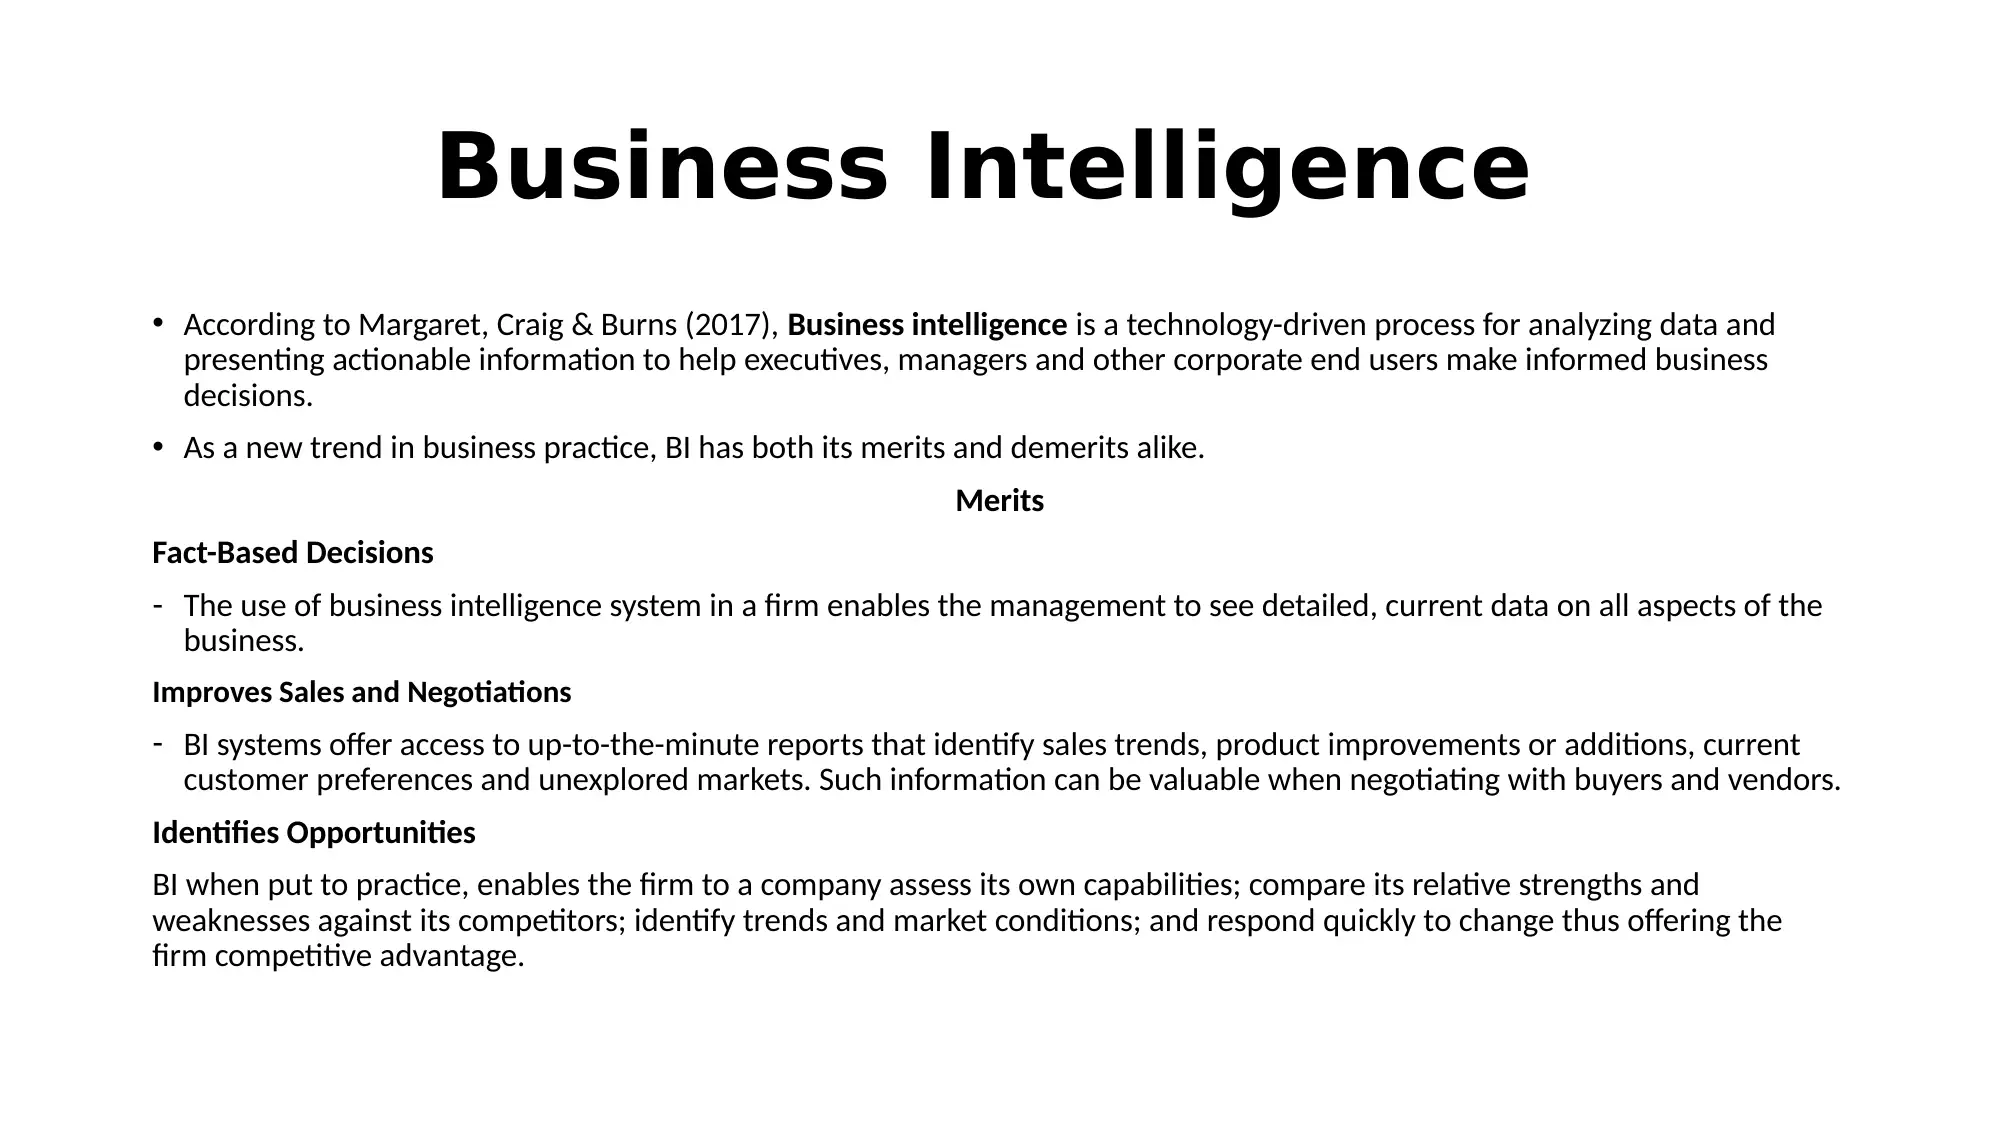
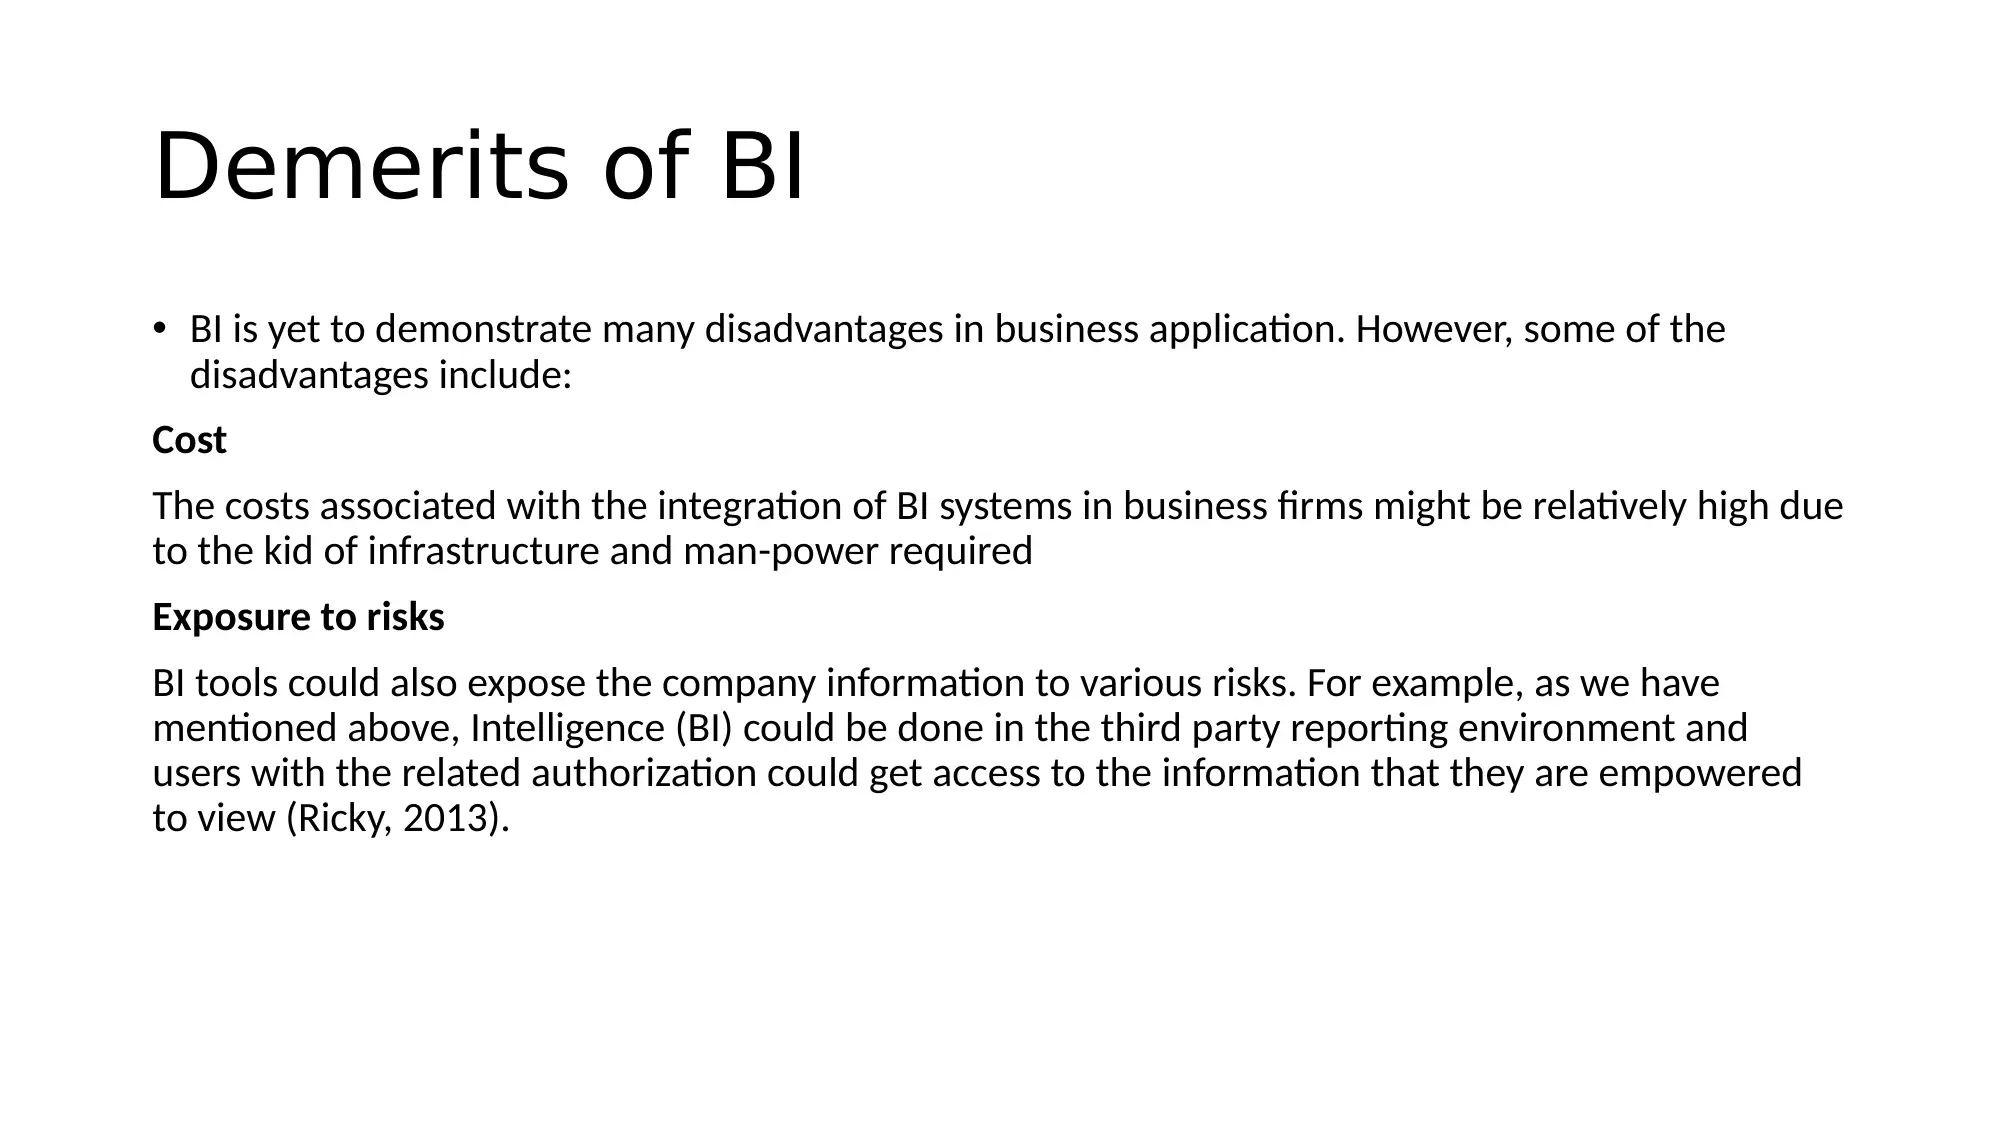
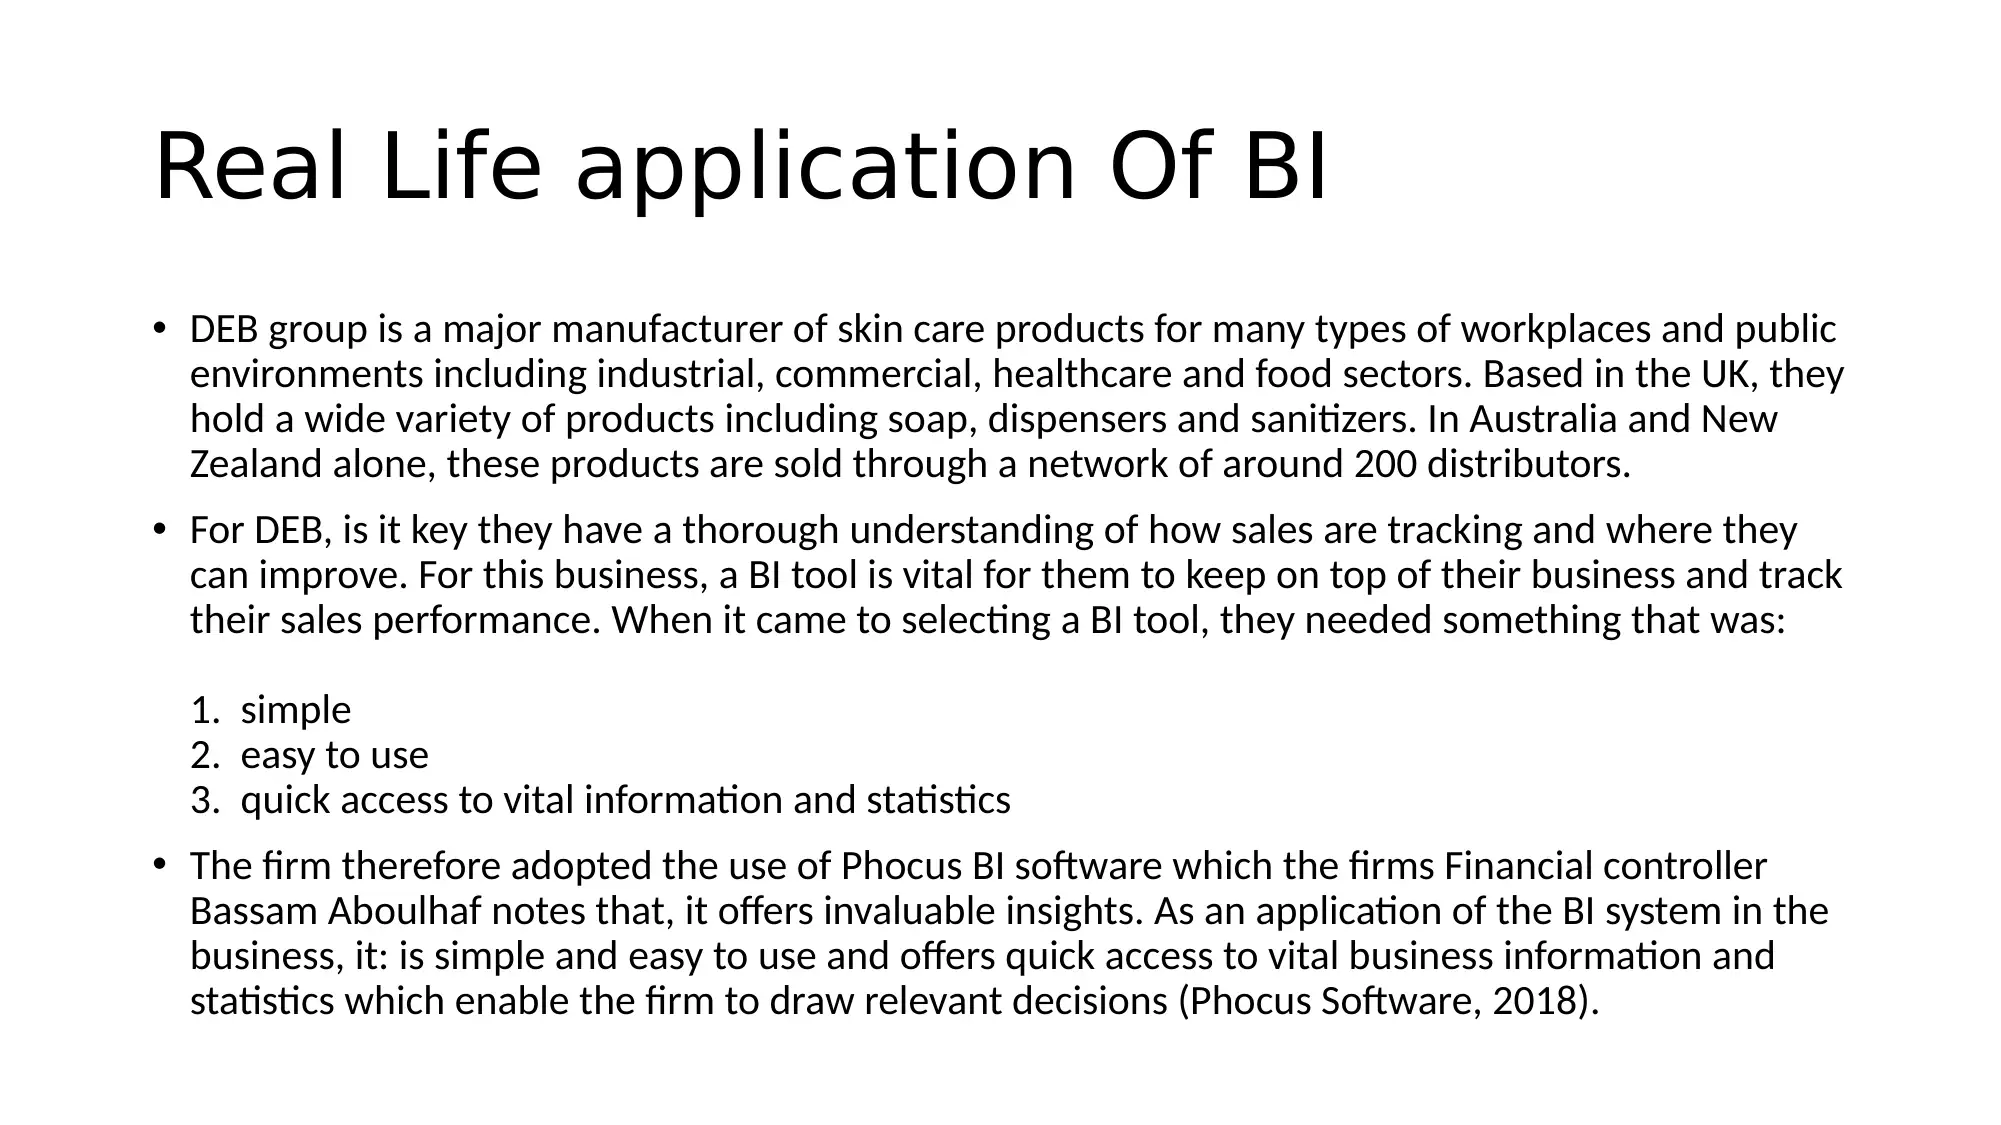
This report offers a comprehensive overview of business analytics, starting with the definitions of quantitative and qualitative variables, essential components of data analysis. It then delves into Business Intelligence (BI), explaining its merits such as fact-based decisions, improved sales, and identification of opportunities, while also acknowledging its demerits like cost and potential risks. A real-life application of BI is illustrated through the DEB group, highlighting how a BI tool helped them track sales performance and make data-driven decisions. The report further explains descriptive data analysis, focusing on techniques like means, quantiles, and cross-tabulations, and prescriptive data analysis, which provides insights into potential outcomes of business decisions. References to relevant sources are included to support the discussed concepts and applications.
Document Page
Business Analytics
tabler-icon-diamond-filled.svg

Secure Best Marks with AI Grader

Need help grading? Try our AI Grader for instant feedback on your assignments.
Document Page
Definitions
Quantitative Variables
In both business and classical statistics, quantitative variables can be
defined as variables that results from counting or measuring a factor
such as sales, income change etcetera (Halo, 2018).
Document Page
Qualitative Variables
Qualitative variables also referred to as categorical variables are
variables which do not take numerical values. These variables are
classified into nominal or ordinal (Stephanie,2013).
Document Page
Business Intelligence
According to Margaret, Craig & Burns (2017), Business intelligence is a technology-driven process for analyzing data and
presenting actionable information to help executives, managers and other corporate end users make informed business
decisions.
As a new trend in business practice, BI has both its merits and demerits alike.
Merits
Fact-Based Decisions
- The use of business intelligence system in a firm enables the management to see detailed, current data on all aspects of the
business.
Improves Sales and Negotiations
- BI systems offer access to up-to-the-minute reports that identify sales trends, product improvements or additions, current
customer preferences and unexplored markets. Such information can be valuable when negotiating with buyers and vendors.
Identifies Opportunities
BI when put to practice, enables the firm to a company assess its own capabilities; compare its relative strengths and
weaknesses against its competitors; identify trends and market conditions; and respond quickly to change thus offering the
firm competitive advantage.
tabler-icon-diamond-filled.svg

Secure Best Marks with AI Grader

Need help grading? Try our AI Grader for instant feedback on your assignments.
Document Page
Demerits of BI
BI is yet to demonstrate many disadvantages in business application. However, some of the
disadvantages include:
Cost
The costs associated with the integration of BI systems in business firms might be relatively high due
to the kid of infrastructure and man-power required
Exposure to risks
BI tools could also expose the company information to various risks. For example, as we have
mentioned above, Intelligence (BI) could be done in the third party reporting environment and
users with the related authorization could get access to the information that they are empowered
to view (Ricky, 2013).
Document Page
Real Life application Of BI
DEB group is a major manufacturer of skin care products for many types of workplaces and public
environments including industrial, commercial, healthcare and food sectors. Based in the UK, they
hold a wide variety of products including soap, dispensers and sanitizers. In Australia and New
Zealand alone, these products are sold through a network of around 200 distributors.
For DEB, is it key they have a thorough understanding of how sales are tracking and where they
can improve. For this business, a BI tool is vital for them to keep on top of their business and track
their sales performance. When it came to selecting a BI tool, they needed something that was:
1. simple
2. easy to use
3. quick access to vital information and statistics
The firm therefore adopted the use of Phocus BI software which the firms Financial controller
Bassam Aboulhaf notes that, it offers invaluable insights. As an application of the BI system in the
business, it: is simple and easy to use and offers quick access to vital business information and
statistics which enable the firm to draw relevant decisions (Phocus Software, 2018).
Document Page
Descriptive data and analysis
Descriptive techniques in data analysis include the construction of means and quantiles,
measures of dispersion such as variance or standard deviation, and cross-tabulations also known
as "crosstabs" which are useful in the examination of disparate hypotheses. Such hypotheses are
generally related to the observed differences in the data subgroups for instance one might be
interested in how the performance of sales for the business firm differs from region to region.
Specialized descriptive techniques are used to measure segregation, discrimination, and
inequality.
Generally, descriptive statistics provide summary information about the characteristics of the past
data used in business.
tabler-icon-diamond-filled.svg

Paraphrase This Document

Need a fresh take? Get an instant paraphrase of this document with our AI Paraphraser
Document Page
Prescriptive data and Analysis
A paper by Hare, Swinehart & Woodward (2017) defines prescriptive statistics as, “…the
application of logic and mathematics to data to specify a preferred course of action.”
The role of prescriptive analytics in the business is therefore to advice possible outcomes if a
business takes a given course of action. It provides different possible outcomes and leads the
management to the possible results.
Document Page
References
Halo Analytics.(2018). Descriptive, Predictive, and Prescriptive Analytics Explained. Retrieved from:
https://halobi.com/blog/descriptive-predictive-and-prescriptive-analytics-explained/
Hare, J., Swinehart, H., Woodward, A. (2017). Forecast Snapshot: Prescriptive Analytics.
(1st ed). London: Gartner Inc.
Sunny, B.(2002). Business Statistics: Visualizing Profit and Performance. Retrieved from:
http://www.informit.com/articles/article.aspx?p=24920&seqNum=4
Phocus Software. (2018). Application Of BI in business and their success story. Retrieved from:
https://www.phocassoftware.com/business-intelligence-blog/the-real-life-stories-of-business-intelligence
Margaret, R., Craig, S. & Burns, E. (2017). DIY BI: A guide to self-service business intelligence implementation.
Retrieved from: https://searchbusinessanalytics.techtarget.com/definition/business-intelligence-BI
RICKY, T.(2013). ADVANTAGES AND DISADVANTAGES OF BUSINESS INTELLIGENCE (BI) WITH RELEVANCE TO
BUSINESS PERFORMANCE. Retrieved from:
https://www.chinaabout.net/advantages-and-disadvantages-of-business-intelligence-bi-with-relevance-to-busi
ness-performance/
chevron_up_icon
1 out of 9
circle_padding
hide_on_mobile
zoom_out_icon
logo.png

Your All-in-One AI-Powered Toolkit for Academic Success.

Available 24*7 on WhatsApp / Email

[object Object]