BUS5PB - Business Analytics: Ecosystems, Challenges & Excel Analysis
VerifiedAdded on 2023/06/10
|14
|3885
|343
Report
AI Summary
This report provides a comprehensive overview of business analytics, its purpose, role, and importance in contemporary business environments. It explores various analytics ecosystems, including descriptive, predictive, and prescriptive analytics, and examines how these are adopted across different industries. The report also evaluates the data analytics lifecycle, highlighting the challenges faced in implementing business analytics within agile business settings, such as managing large data volumes and ensuring data quality. Furthermore, it demonstrates how Big Tech companies leverage analytics and artificial intelligence to generate organizational value, focusing on market trend evaluation, pattern identification through machine learning, and personalized lead generation. The report also includes practical data analysis using Excel functions, such as calculating cumulative frequencies, and regression analysis to interpret data relationships.
BUS5PB Principles of
Business Analytics
Business Analytics
Paraphrase This Document
Need a fresh take? Get an instant paraphrase of this document with our AI Paraphraser
TABLE OF CONTENTS
INTRODUCTION...........................................................................................................................3
TASK 1............................................................................................................................................3
Describing the purpose, importance and role of business analytics............................................3
Analytics ecosystem and how they are adopted within different industries...............................4
Data analytics lifecycle is implemented and how the challenges in implementing the business
analytics in agile business faced.................................................................................................5
Demonstrating how Big Tech are leveraging analytics and use of artificial intelligence for
generating organizational value..................................................................................................6
TASK 2............................................................................................................................................6
Task 2.1.......................................................................................................................................6
Task 2.2.......................................................................................................................................8
Task 2.3.......................................................................................................................................9
CONCLUSION..............................................................................................................................11
REFERENCES..............................................................................................................................13
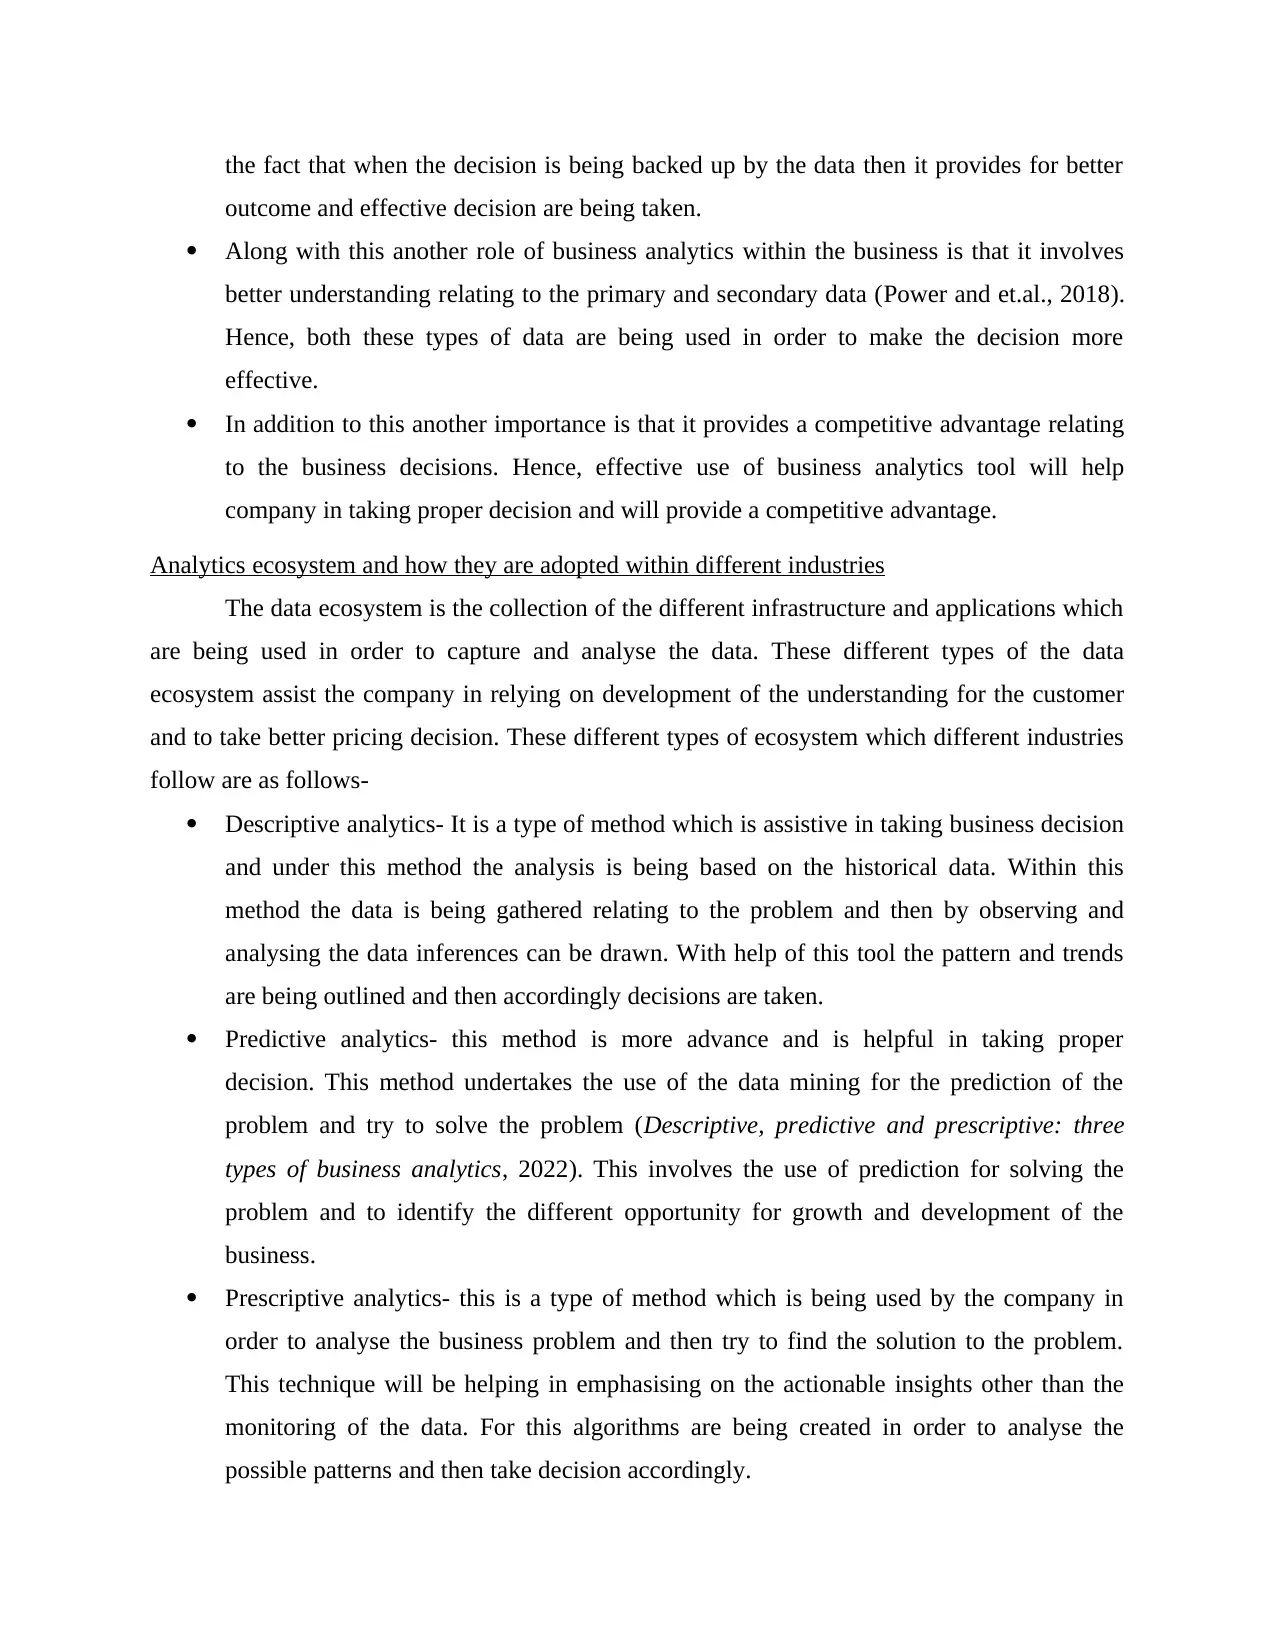
INTRODUCTION
Business analytics is being referred to as the different set of disciplines and different
types technology for the analysis of the data. The companies exist in the external environment
and for this it is necessary that proper tools and techniques are being used. The current report is
based on the discussion relating to the business analytics and its purpose, role and importance.
Within this competitive working environment the companies are undertaking the use of the
business analytics in order to evaluate the business problem. In addition to this the report will
also evaluate the different types of analytics ecosystem like descriptive, predictive and others.
Further the evaluation of the data analytics lifecycle will be undertaken and the challenges in
implementation will also be evaluated. Also the demonstration of Big Tech will be evaluated.
Further another task relates to the use of the different excel functions for the better analysis of
the data.
TASK 1
Describing the purpose, importance and role of business analytics
The business analytics is being defined as the set of different automated tools and
techniques which is being used in order to evaluate the business problem. This is necessary
because there are many different types of the problem which business faces. Hence, it is very
essential for the companies that they effectively use the different tools of business analytics and
then try to solve problem easily (Ajah and Nweke, 2019). The purpose of using the business
analytics within the company is to solve the various different problems to take effective decision
for improving the business profitability. Also, the business analytics is being used in order to
apply to different business segments like financial management, marketing, supply chain
management, CRM and many others.
Further the use of business analytics is also very important for the different companies to
use. Also, the role of business analytics is very wide with respect to development of the company
and effective decision making. The different importance and role of business analytics is as
follows-
The most common importance of using the business analytics within the business is that
it is a tool which helps the company in effective decision making. This is pertaining to
⊘ This is a preview!⊘
Do you want full access?
Subscribe today to unlock all pages.
Trusted by 1+ million students worldwide
the fact that when the decision is being backed up by the data then it provides for better
outcome and effective decision are being taken.
Along with this another role of business analytics within the business is that it involves
better understanding relating to the primary and secondary data (Power and et.al., 2018).
Hence, both these types of data are being used in order to make the decision more
effective.
In addition to this another importance is that it provides a competitive advantage relating
to the business decisions. Hence, effective use of business analytics tool will help
company in taking proper decision and will provide a competitive advantage.
Analytics ecosystem and how they are adopted within different industries
The data ecosystem is the collection of the different infrastructure and applications which
are being used in order to capture and analyse the data. These different types of the data
ecosystem assist the company in relying on development of the understanding for the customer
and to take better pricing decision. These different types of ecosystem which different industries
follow are as follows-
Descriptive analytics- It is a type of method which is assistive in taking business decision
and under this method the analysis is being based on the historical data. Within this
method the data is being gathered relating to the problem and then by observing and
analysing the data inferences can be drawn. With help of this tool the pattern and trends
are being outlined and then accordingly decisions are taken.
Predictive analytics- this method is more advance and is helpful in taking proper
decision. This method undertakes the use of the data mining for the prediction of the
problem and try to solve the problem (Descriptive, predictive and prescriptive: three
types of business analytics, 2022). This involves the use of prediction for solving the
problem and to identify the different opportunity for growth and development of the
business.
Prescriptive analytics- this is a type of method which is being used by the company in
order to analyse the business problem and then try to find the solution to the problem.
This technique will be helping in emphasising on the actionable insights other than the
monitoring of the data. For this algorithms are being created in order to analyse the
possible patterns and then take decision accordingly.
Paraphrase This Document
Need a fresh take? Get an instant paraphrase of this document with our AI Paraphraser
Exploratory analytics- This is the analysis which is considered to be the factor which is
helpful for the critical process of performing the initial investigation on data which is
allows in the discovering of patterns that sport the anomalies, to test the hypothesis and
also allows in checking its assumptions. It is also the technique which is used for the
summarization of all the different statistics and also its graphical representations
(Riesener and et.al., 2019). For a business the use of this analytical tool can be considered
to be very effective for business analytics.
Data analytics lifecycle is implemented and how the challenges in implementing the business
analytics in agile business faced
The implementation of the data analytics life-cycle is considered to be cyclic process that
explains in different six stages of how the information can be used, collected, processed and
implemented before it can be analysed for the different business objectives. The implementation
of this data analytics life cycle implementation faces the following challenges for an agile
business,
The amount of data in an agile business can be very high which can be the reason that
affect its analysation (Tabesh, Mousavidin and Hasani, 2019). The big data often gets the
management of this organization overwhelmed with the amount of data that is collected.
Collection of meaningful and real-time data is also considered to be a very big challenge
for this organization as it focuses on gaining real-time insights on the what are the current
features that are taking place.
For the large amounts of data which is collected the visual representations is often a need
which is difficult to be fulfilled.
During the collection of the data multiple sources might be used which can affect the
analysation of these data. Analysis is affected from the inaccurate presentation of the data
from different sources.
The quality of the data is also very essential for the analysation of the data. It is also the
key cause of inaccuracy through which manual errors can be made during its data entry.
Due to the lack of support that is present in these types of organization for both the top an
lower level employees. The analysation of the data becomes a more risk process for the
managers which are pursuing this data analytics life cycle.
Demonstrating how Big Tech are leveraging analytics and use of artificial intelligence for
generating organizational value
The Big Tech organization like Facebook, Apple, Microsoft, Amazon and Google are
leveraging analytics with the help of the following,
Evaluation of the market trends.
Identification of patterns through machine learnings
Creation of personalized lead generations messages
Contextualization of data
Focusing on quality over quantity
Analysation of consumer behaviour
These organizations use artificial intelligence for generation of organizational value
through helping the organization automate, simplify and speed up the data preparation and
insight generation process (Panayides and et.al., 2020). There are AI tools which are referred to a
subset of business intelligence which uses machine learning techniques for discovering insights
for finding new patterns and discovering relationships in the data. AI analytics is the process of
automating of the work which is a data analyst for normally performing the practices that
provides value to organization (Elishand Boyd, 2018.). With the help of AI algorithms, the
business is able to automatically analyse the large volume of streaming data, quickly identifying
patterns and generation of insights for meaningful actions that are necessary. The ability of using
AI is helpful for the data analytics to work in more expertly manner and gain inseparable
experiences. AI technology is helpful for the deep learning a pulling all the data input and
generating rules which can be used by this for future analysis.
TASK 2
Task 2.1
A
Bin Frequency
Cumulative
% Bin Frequency
Cumulative
%
334 1 0.05% 723.8043 333 15.49%
463.9348 38 1.81% 853.7391 295 29.21%
593.8696 189 10.60% 983.6739 232 40.00%
⊘ This is a preview!⊘
Do you want full access?
Subscribe today to unlock all pages.
Trusted by 1+ million students worldwide
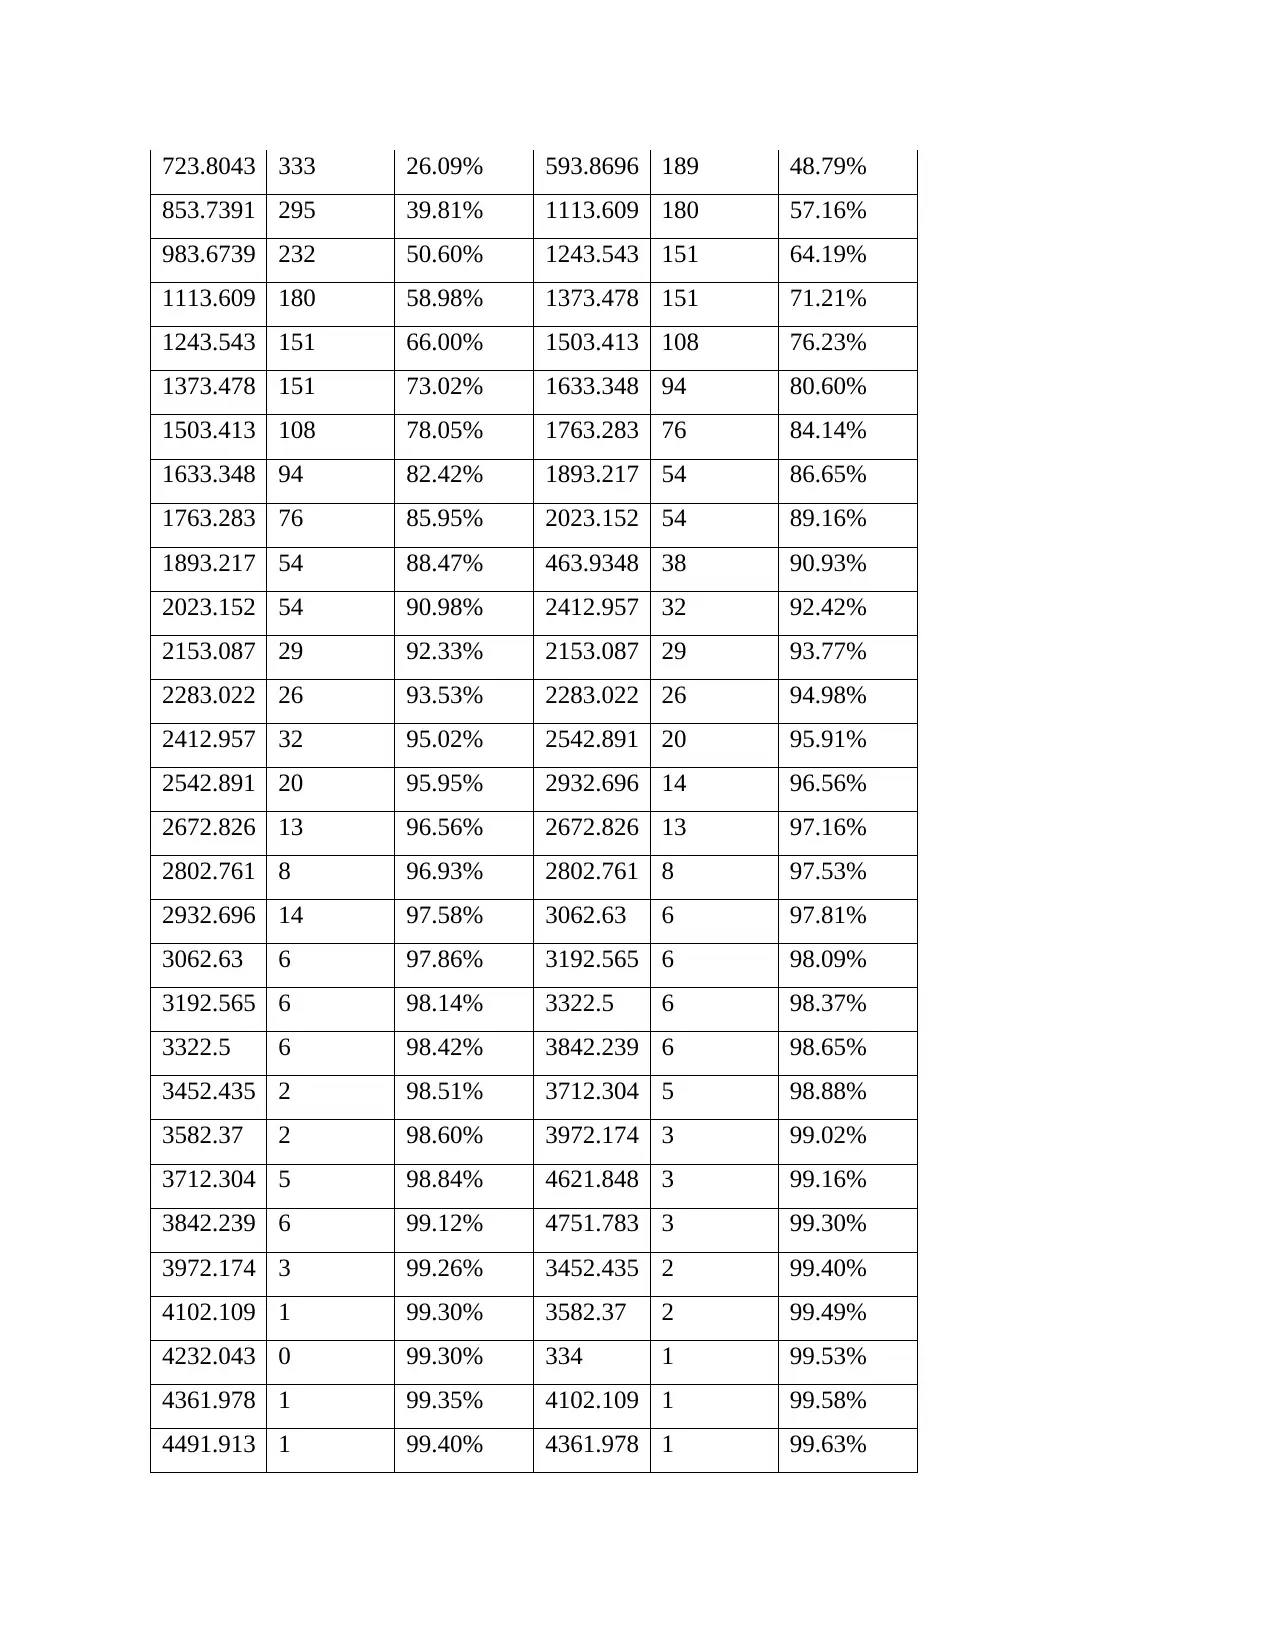
723.8043 333 26.09% 593.8696 189 48.79%
853.7391 295 39.81% 1113.609 180 57.16%
983.6739 232 50.60% 1243.543 151 64.19%
1113.609 180 58.98% 1373.478 151 71.21%
1243.543 151 66.00% 1503.413 108 76.23%
1373.478 151 73.02% 1633.348 94 80.60%
1503.413 108 78.05% 1763.283 76 84.14%
1633.348 94 82.42% 1893.217 54 86.65%
1763.283 76 85.95% 2023.152 54 89.16%
1893.217 54 88.47% 463.9348 38 90.93%
2023.152 54 90.98% 2412.957 32 92.42%
2153.087 29 92.33% 2153.087 29 93.77%
2283.022 26 93.53% 2283.022 26 94.98%
2412.957 32 95.02% 2542.891 20 95.91%
2542.891 20 95.95% 2932.696 14 96.56%
2672.826 13 96.56% 2672.826 13 97.16%
2802.761 8 96.93% 2802.761 8 97.53%
2932.696 14 97.58% 3062.63 6 97.81%
3062.63 6 97.86% 3192.565 6 98.09%
3192.565 6 98.14% 3322.5 6 98.37%
3322.5 6 98.42% 3842.239 6 98.65%
3452.435 2 98.51% 3712.304 5 98.88%
3582.37 2 98.60% 3972.174 3 99.02%
3712.304 5 98.84% 4621.848 3 99.16%
3842.239 6 99.12% 4751.783 3 99.30%
3972.174 3 99.26% 3452.435 2 99.40%
4102.109 1 99.30% 3582.37 2 99.49%
4232.043 0 99.30% 334 1 99.53%
4361.978 1 99.35% 4102.109 1 99.58%
4491.913 1 99.40% 4361.978 1 99.63%
Paraphrase This Document
Need a fresh take? Get an instant paraphrase of this document with our AI Paraphraser
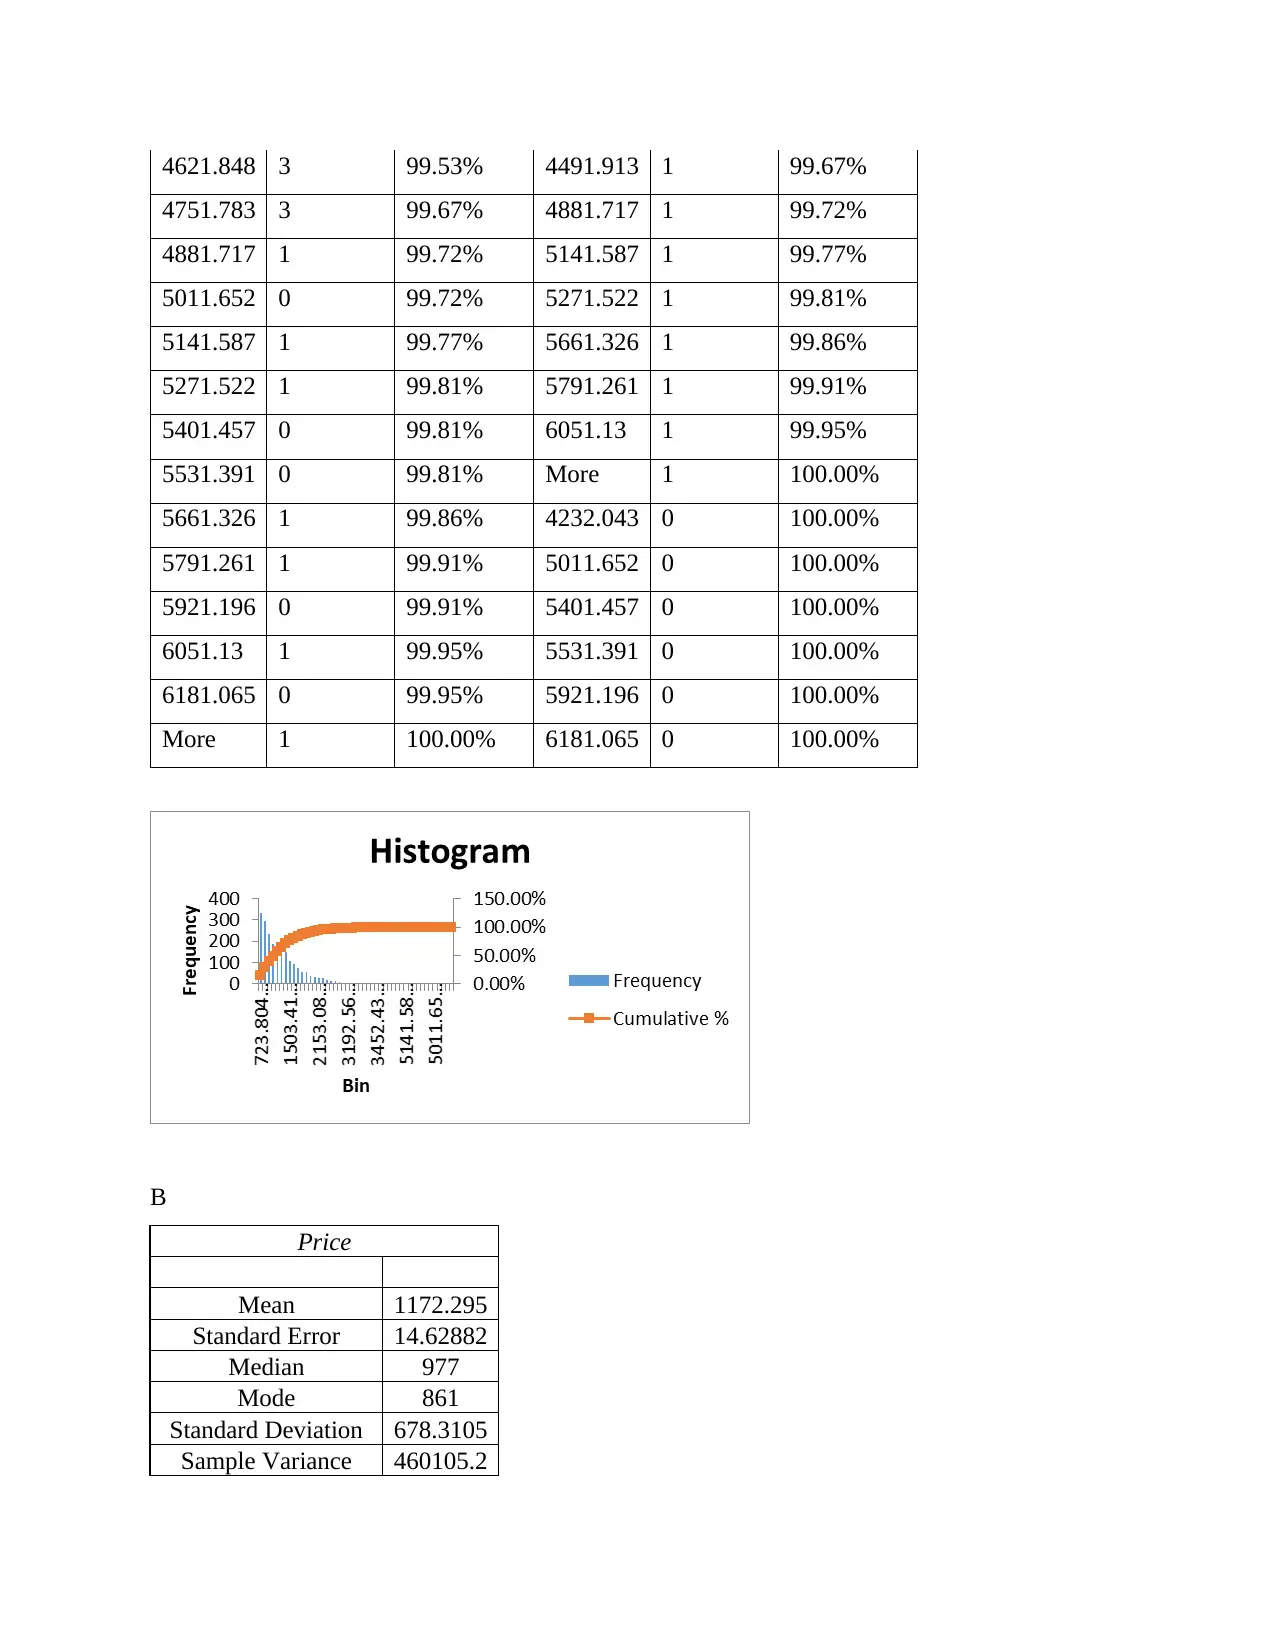
4621.848 3 99.53% 4491.913 1 99.67%
4751.783 3 99.67% 4881.717 1 99.72%
4881.717 1 99.72% 5141.587 1 99.77%
5011.652 0 99.72% 5271.522 1 99.81%
5141.587 1 99.77% 5661.326 1 99.86%
5271.522 1 99.81% 5791.261 1 99.91%
5401.457 0 99.81% 6051.13 1 99.95%
5531.391 0 99.81% More 1 100.00%
5661.326 1 99.86% 4232.043 0 100.00%
5791.261 1 99.91% 5011.652 0 100.00%
5921.196 0 99.91% 5401.457 0 100.00%
6051.13 1 99.95% 5531.391 0 100.00%
6181.065 0 99.95% 5921.196 0 100.00%
More 1 100.00% 6181.065 0 100.00%
B
Price
Mean 1172.295
Standard Error 14.62882
Median 977
Mode 861
Standard Deviation 678.3105
Sample Variance 460105.2
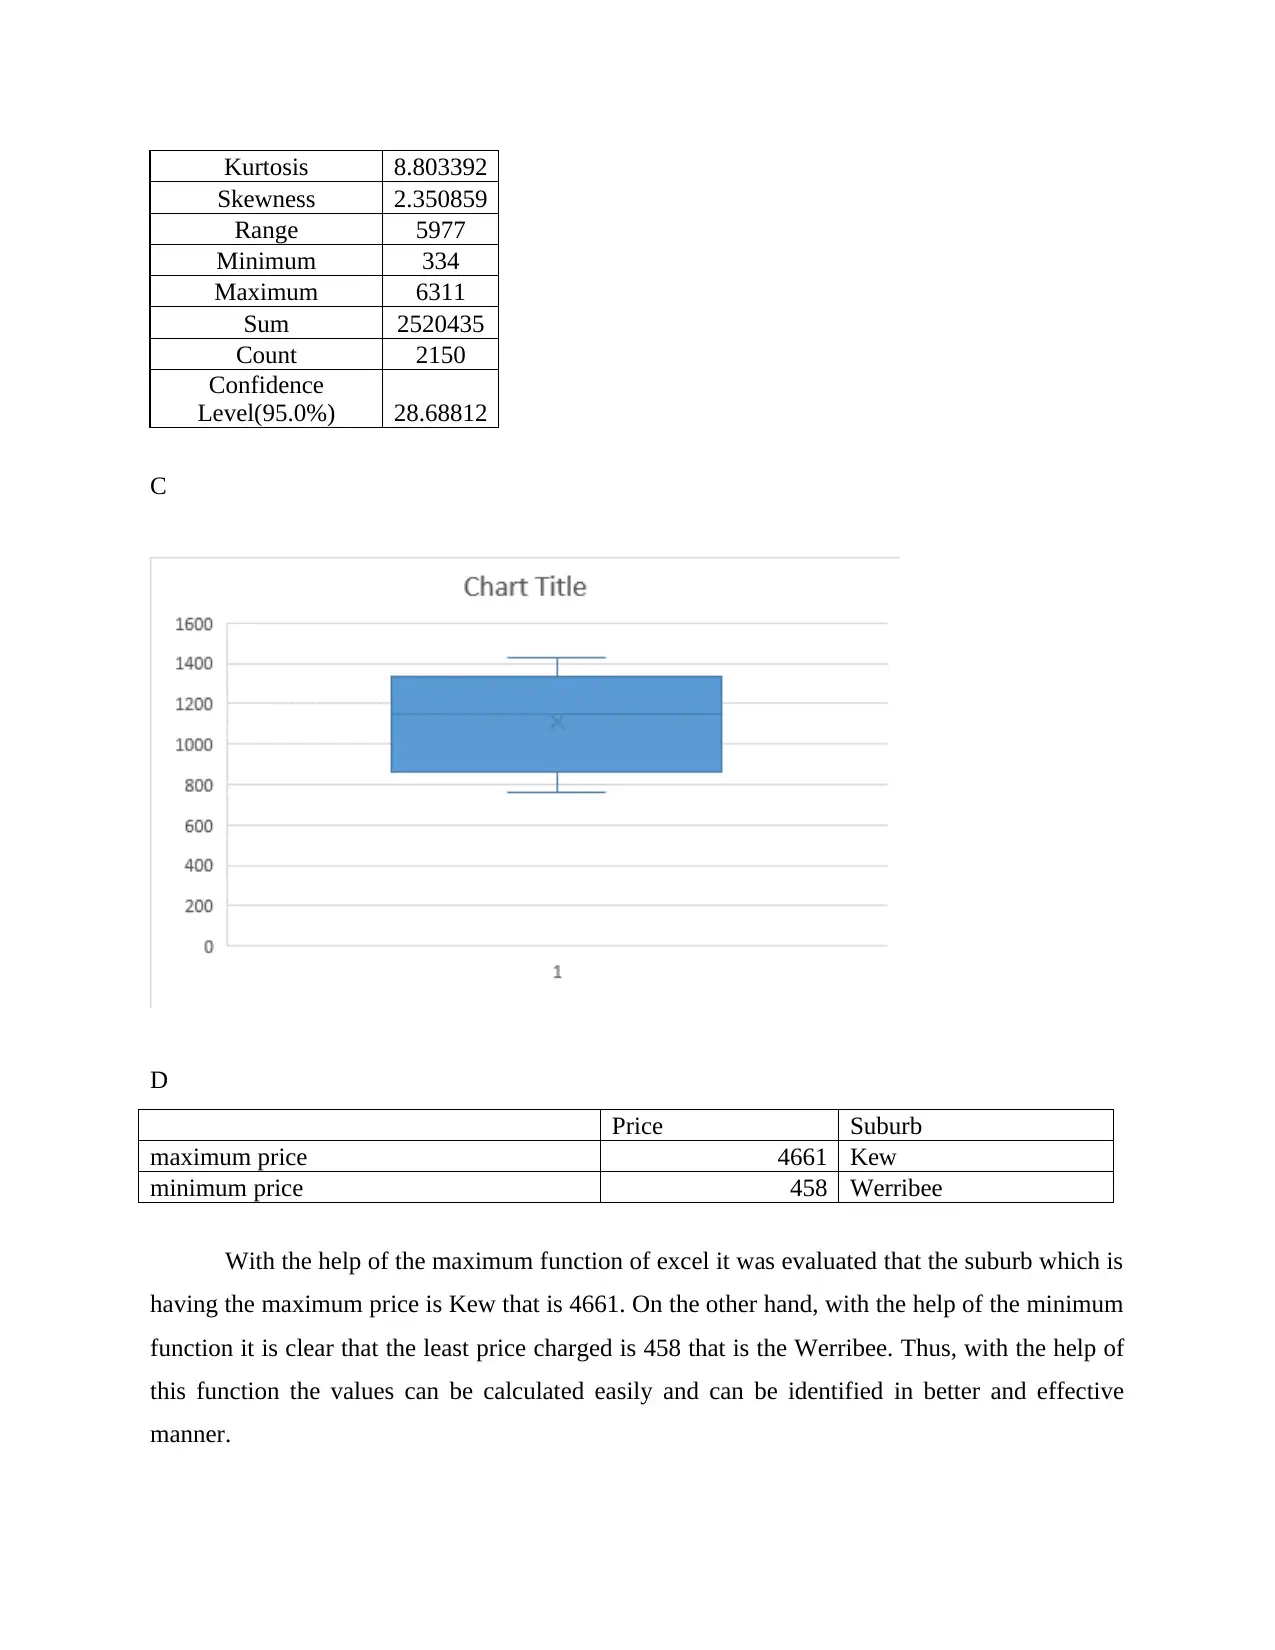
Kurtosis 8.803392
Skewness 2.350859
Range 5977
Minimum 334
Maximum 6311
Sum 2520435
Count 2150
Confidence
Level(95.0%) 28.68812
C
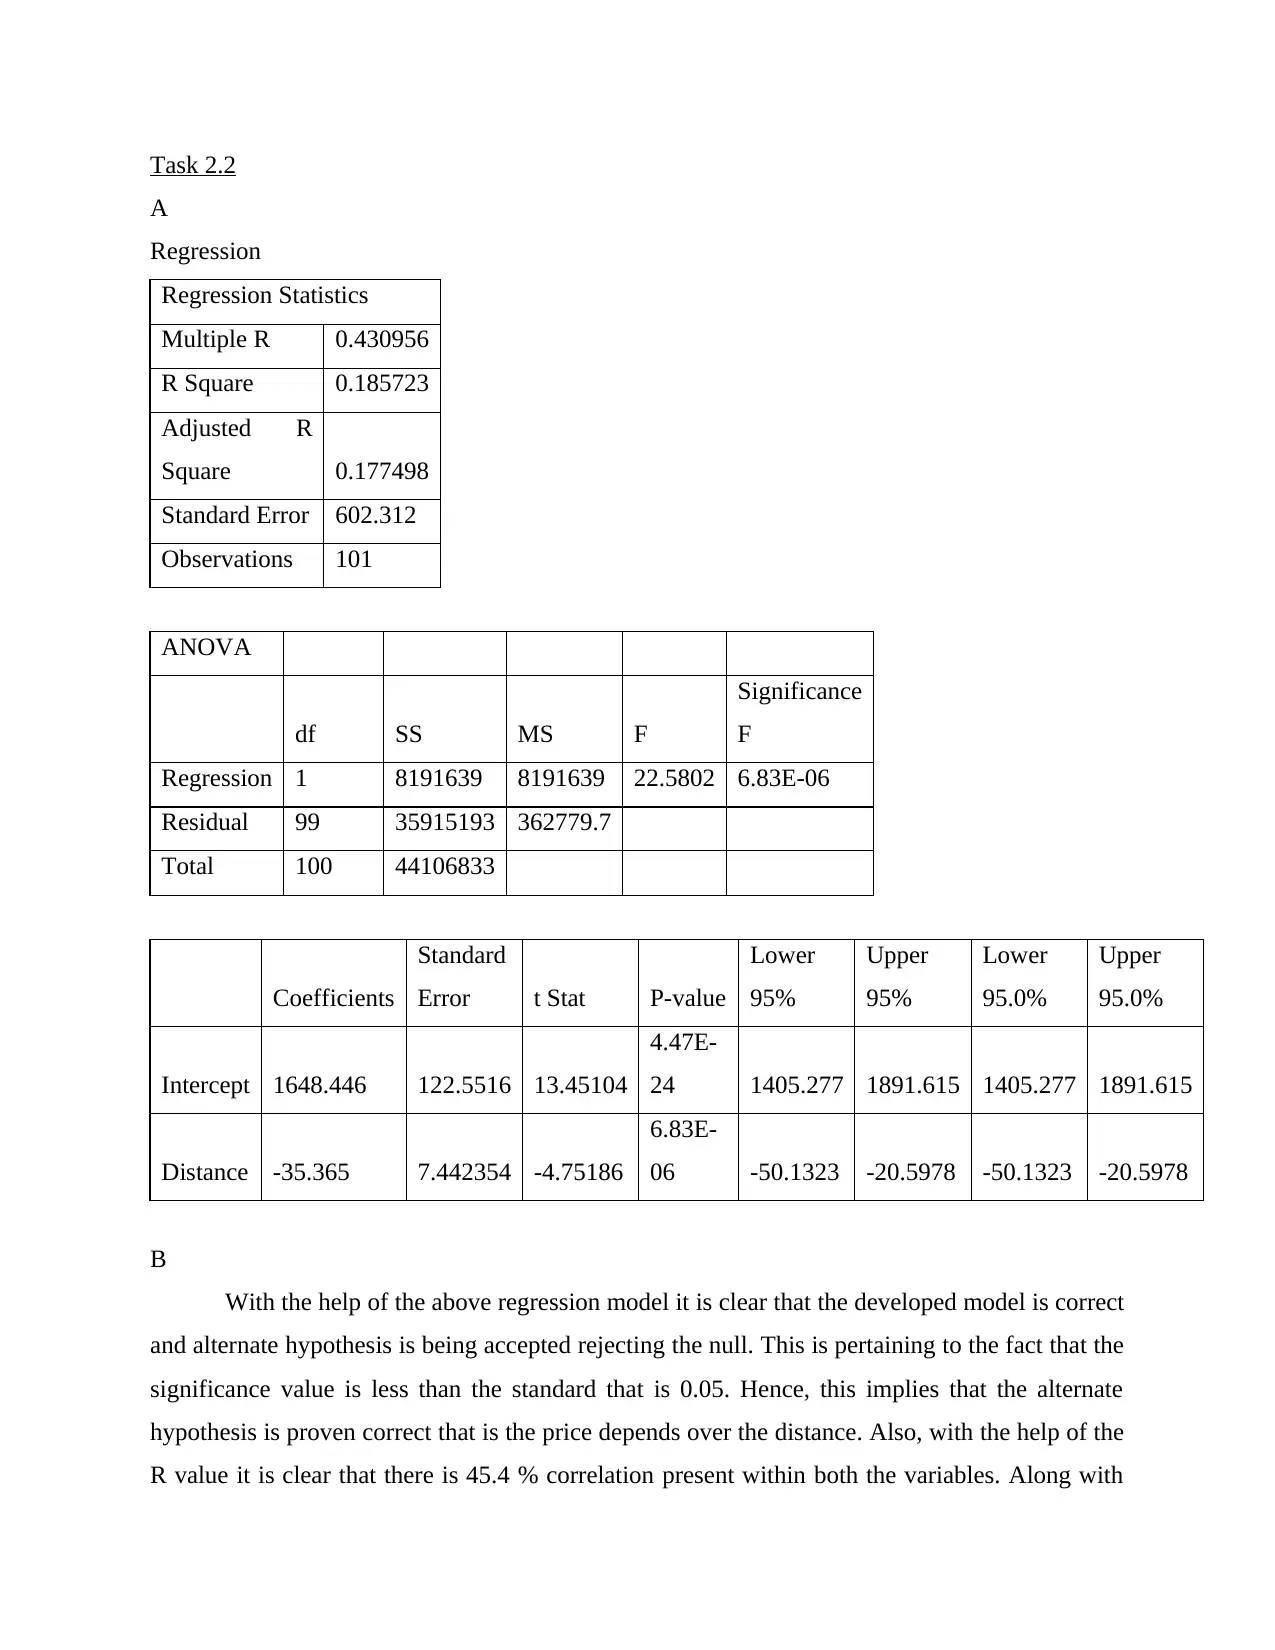
D
Price Suburb
maximum price 4661 Kew
minimum price 458 Werribee
With the help of the maximum function of excel it was evaluated that the suburb which is
having the maximum price is Kew that is 4661. On the other hand, with the help of the minimum
function it is clear that the least price charged is 458 that is the Werribee. Thus, with the help of
this function the values can be calculated easily and can be identified in better and effective
manner.
Skewness 2.350859
Range 5977
Minimum 334
Maximum 6311
Sum 2520435
Count 2150
Confidence
Level(95.0%) 28.68812
C
D
Price Suburb
maximum price 4661 Kew
minimum price 458 Werribee
With the help of the maximum function of excel it was evaluated that the suburb which is
having the maximum price is Kew that is 4661. On the other hand, with the help of the minimum
function it is clear that the least price charged is 458 that is the Werribee. Thus, with the help of
this function the values can be calculated easily and can be identified in better and effective
manner.
⊘ This is a preview!⊘
Do you want full access?
Subscribe today to unlock all pages.
Trusted by 1+ million students worldwide
Task 2.2
A
Regression
Regression Statistics
Multiple R 0.430956
R Square 0.185723
Adjusted R
Square 0.177498
Standard Error 602.312
Observations 101
ANOVA
df SS MS F
Significance
F
Regression 1 8191639 8191639 22.5802 6.83E-06
Residual 99 35915193 362779.7
Total 100 44106833
Coefficients
Standard
Error t Stat P-value
Lower
95%
Upper
95%
Lower
95.0%
Upper
95.0%
Intercept 1648.446 122.5516 13.45104
4.47E-
24 1405.277 1891.615 1405.277 1891.615
Distance -35.365 7.442354 -4.75186
6.83E-
06 -50.1323 -20.5978 -50.1323 -20.5978
B
With the help of the above regression model it is clear that the developed model is correct
and alternate hypothesis is being accepted rejecting the null. This is pertaining to the fact that the
significance value is less than the standard that is 0.05. Hence, this implies that the alternate
hypothesis is proven correct that is the price depends over the distance. Also, with the help of the
R value it is clear that there is 45.4 % correlation present within both the variables. Along with
Paraphrase This Document
Need a fresh take? Get an instant paraphrase of this document with our AI Paraphraser
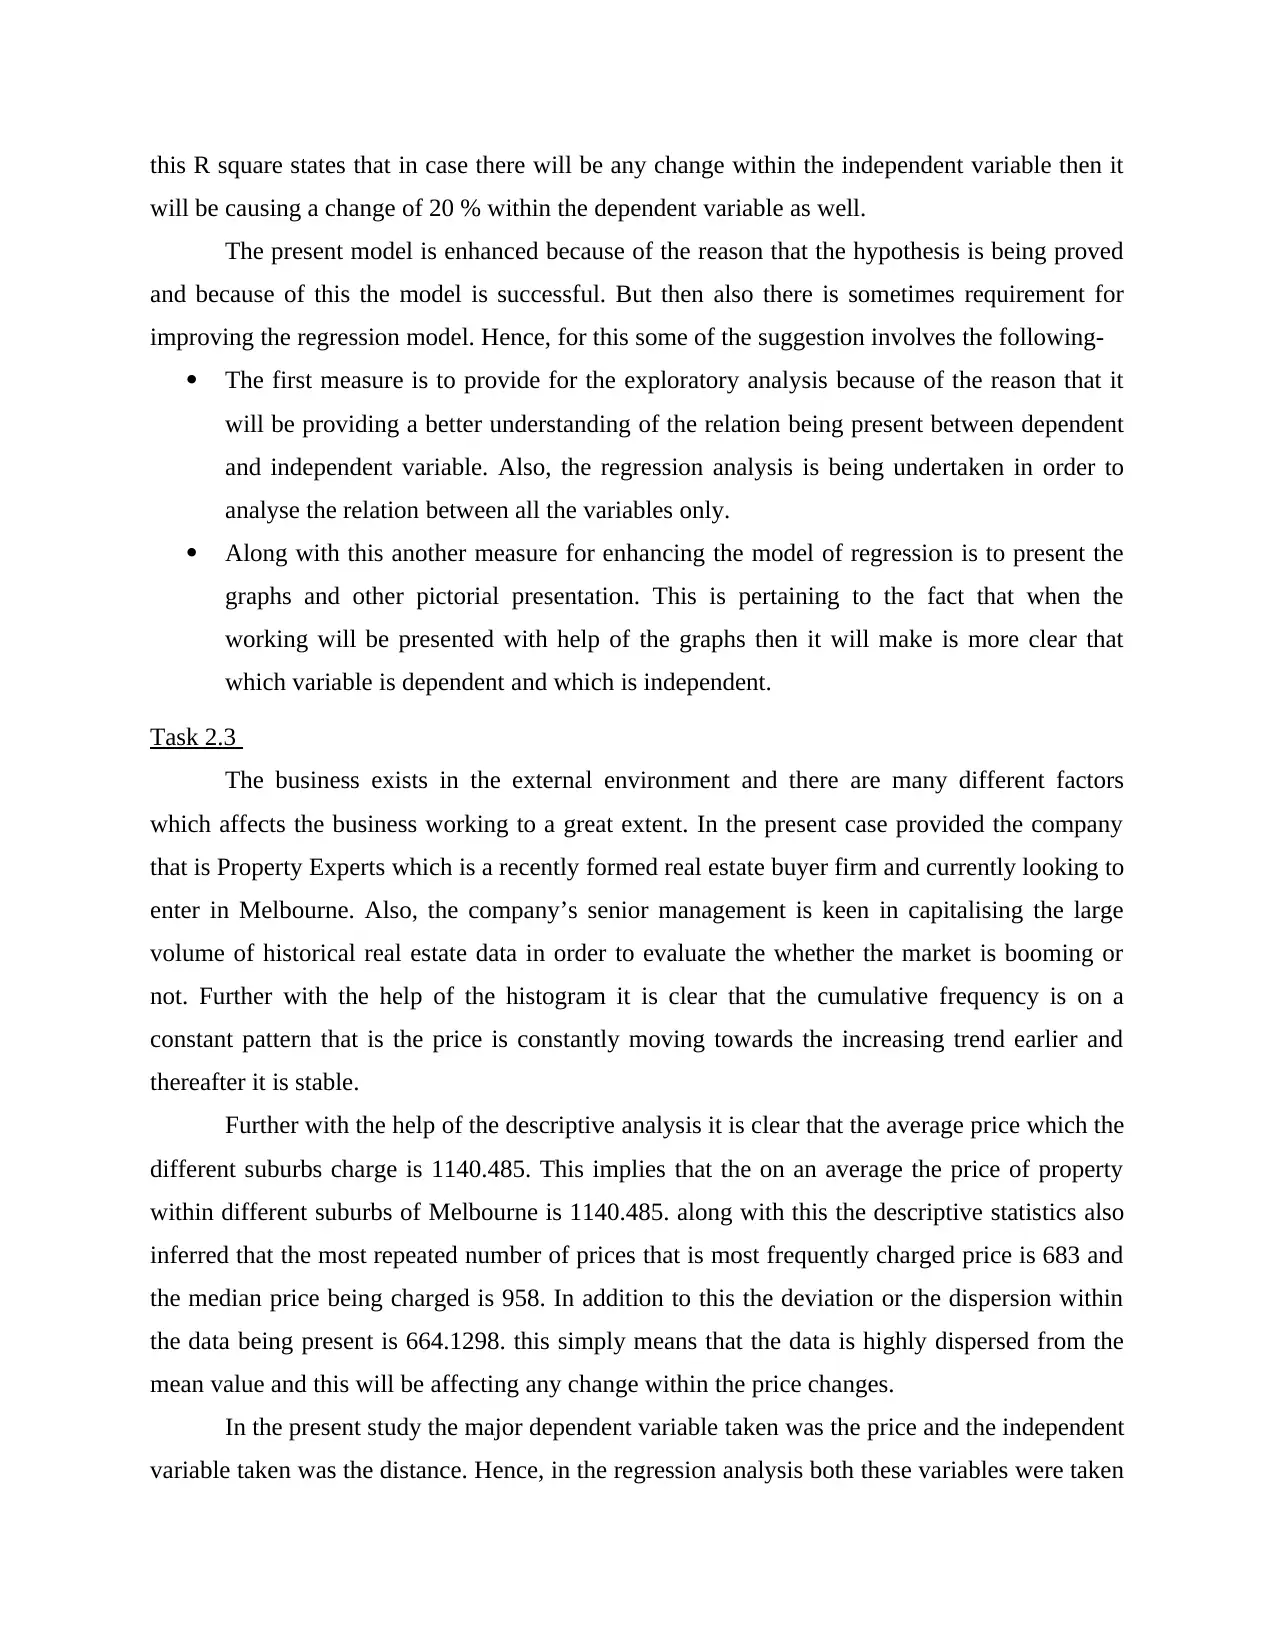
this R square states that in case there will be any change within the independent variable then it
will be causing a change of 20 % within the dependent variable as well.
The present model is enhanced because of the reason that the hypothesis is being proved
and because of this the model is successful. But then also there is sometimes requirement for
improving the regression model. Hence, for this some of the suggestion involves the following-
The first measure is to provide for the exploratory analysis because of the reason that it
will be providing a better understanding of the relation being present between dependent
and independent variable. Also, the regression analysis is being undertaken in order to
analyse the relation between all the variables only.
Along with this another measure for enhancing the model of regression is to present the
graphs and other pictorial presentation. This is pertaining to the fact that when the
working will be presented with help of the graphs then it will make is more clear that
which variable is dependent and which is independent.
Task 2.3
The business exists in the external environment and there are many different factors
which affects the business working to a great extent. In the present case provided the company
that is Property Experts which is a recently formed real estate buyer firm and currently looking to
enter in Melbourne. Also, the company’s senior management is keen in capitalising the large
volume of historical real estate data in order to evaluate the whether the market is booming or
not. Further with the help of the histogram it is clear that the cumulative frequency is on a
constant pattern that is the price is constantly moving towards the increasing trend earlier and
thereafter it is stable.
Further with the help of the descriptive analysis it is clear that the average price which the
different suburbs charge is 1140.485. This implies that the on an average the price of property
within different suburbs of Melbourne is 1140.485. along with this the descriptive statistics also
inferred that the most repeated number of prices that is most frequently charged price is 683 and
the median price being charged is 958. In addition to this the deviation or the dispersion within
the data being present is 664.1298. this simply means that the data is highly dispersed from the
mean value and this will be affecting any change within the price changes.
In the present study the major dependent variable taken was the price and the independent
variable taken was the distance. Hence, in the regression analysis both these variables were taken

and it was proven that the price of the land is being dependent over the distance (Zhang and
Chen, 2020). Along with this there are different data as well which is being provided within the
study and these can also be used for the analysis. This is very important for the reason that it
might be possible that other different factors may also affect the price of the property.
For this analysis the variable that is land size can also be included. This is pertaining to
the fact that in case the land size will be more than this will be increasing the price of the product
as well. The reason underlying this fact is that when the land is of more size then this increases
the area and the price is being calculated by multiplying the per square metre of land with the
land size. Hence, within the study, this factor that is land size must also be included such that
better analysis of the price can be undertaken.
In addition to this there is another factor which can be included within the working of the
price and its analysis is the rooms as well. This room involves the number of bedroom and this
also affect the price of the property. This is pertaining to the fact that in case the rooms will be
more than this will be affecting the price and it will be increased (Mikalef and et.al., 2020).
Along with this in case the number of room will be less then this will be affecting the price and it
might decline. So with this it is very clear that the price of the property can also be dependent on
the room as well. Hence for the better analysis this factor can also be included within the pricing
of the property. This is necessary for the reason that when the price of the property is not being
analysed in proper manner then this will be affecting the working efficiency of it and might be
possible that property is undervalued or overvalued.
Moreover, along with this another factor which can be considered while analysing the
price of the property is the region name as well. This is because of the reason that the prices of
the property also depend on the region to which they belong. The reason underlying the fact is
that when the region will be good then this will be resulting in increasing the price of the
property. On the other hand, in case the region will not be good then this the price of the property
might also be reduced. Thus, with this it can be stated that there are many different other
variables as well which can affect the working efficiency.
With the above evaluation it is clear that there are many different other variables as well
which can be used as factors for determining the price. The reason underlying this fact is that
when the price of the property is not only dependent over the distance but with other variables as
well. Also for the better analysis it is very important for the reason that it will be providing better
⊘ This is a preview!⊘
Do you want full access?
Subscribe today to unlock all pages.
Trusted by 1+ million students worldwide
1 out of 14
Related Documents


Your All-in-One AI-Powered Toolkit for Academic Success.
+13062052269
info@desklib.com
Available 24*7 on WhatsApp / Email
![[object Object]](/_next/static/media/star-bottom.7253800d.svg)
Unlock your academic potential
Copyright © 2020–2026 A2Z Services. All Rights Reserved. Developed and managed by ZUCOL.