Applied Business Analytics: Ford Motor Company Data Analysis Report

Verified

Added on  2022/10/02

|9
|512
|10
Report
AI Summary
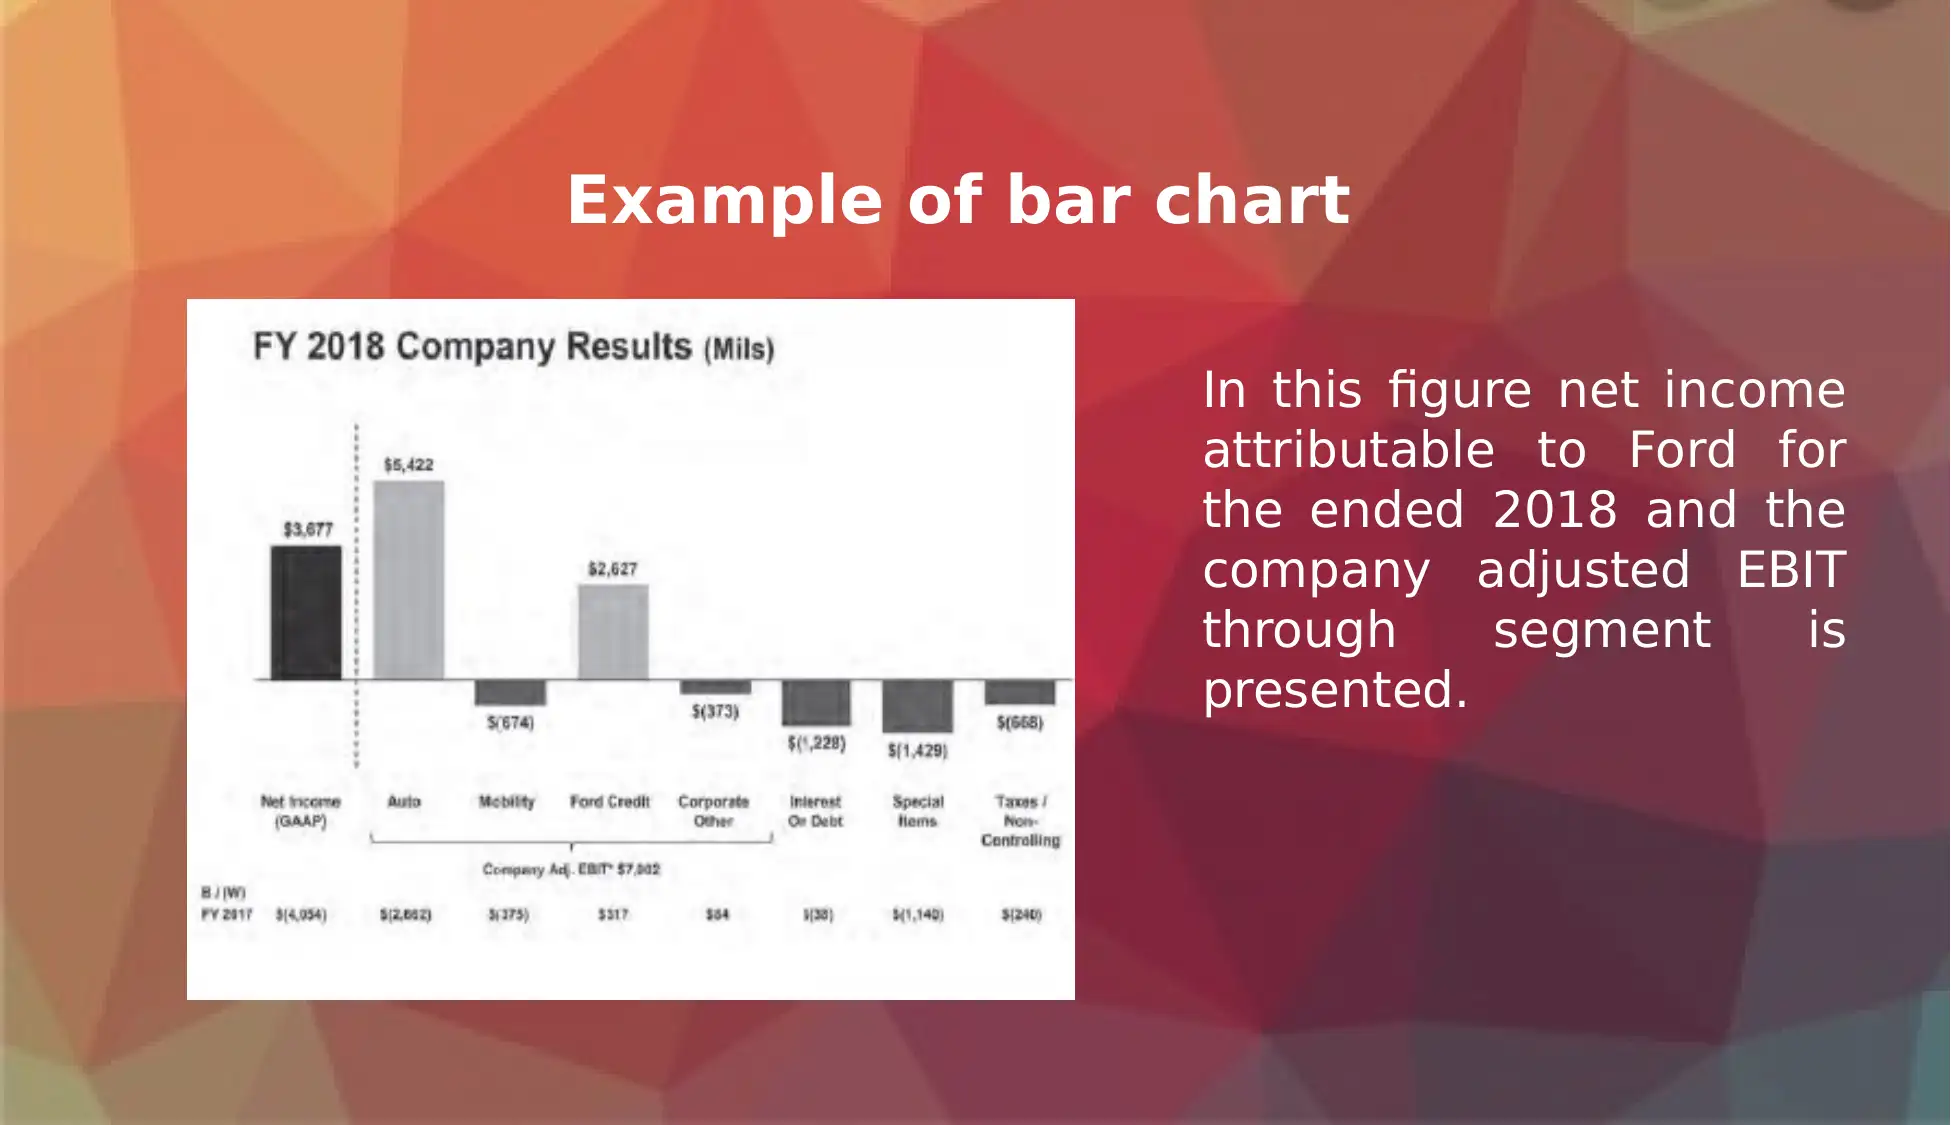
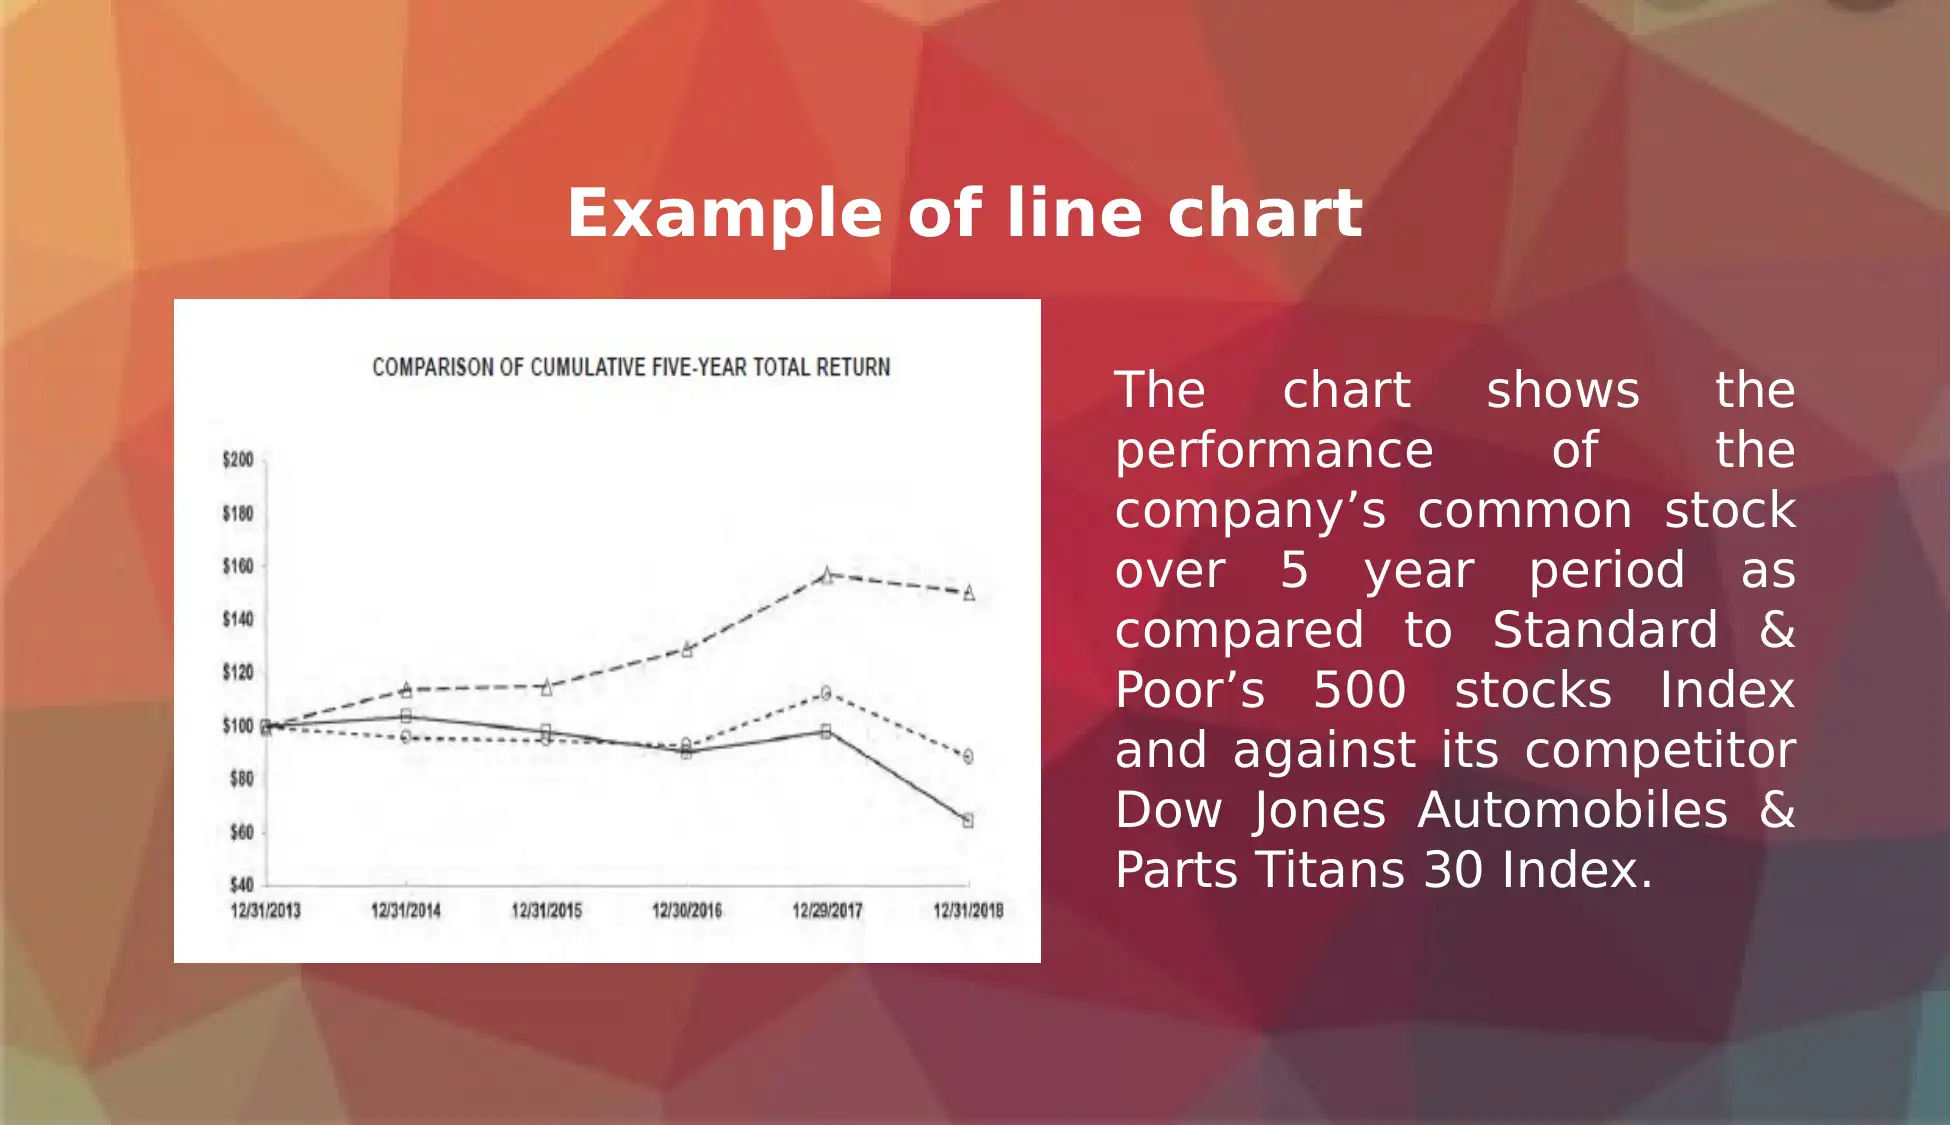
This report provides an analysis of Ford Motor Company through the lens of applied business analytics. The report begins with an introduction to Ford's background, discussing its incorporation, core business operations, and its position within the automotive industry, particularly its competition with Japanese automakers and its response to government regulations. The core of the report focuses on the impact of data on business decision-making, emphasizing its importance in creating opportunities, generating revenue, optimizing operations, and predicting trends. Quantitative analysis is highlighted, with a focus on data-driven decision-making. The report includes examples of data visualization techniques, such as bar and line charts, illustrating the company's financial performance over time, including net income and stock performance compared to industry benchmarks. The report concludes with a list of references and bibliography, providing sources for further reading on business analytics and data interpretation.
Document Page
Applied business analytics
Name of the student
Name of the university
Student ID
tabler-icon-diamond-filled.svg

Paraphrase This Document

Need a fresh take? Get an instant paraphrase of this document with our AI Paraphraser
Document Page
Introduction of company background
Ford Motor Company that was incorporated on 9th July 1919,
is the global mobility and automotive company. Its motor
businesses include manufacturing, designing, servicing and
marketing the line of trucks, Ford cars, sport utility vehicles
and Lincoln Luxury vehicles. Ford sells its dealership for the
retail sales and also sells the vehicles to dealership for
selling it to the fleet customers.
Document Page
The automotive industry in US is exposed to long
period of capital spending and competition to make
efforts in competing with Japanese automakers and
meeting the pending regulations of government
regarding safety and emissions control. Hence, Ford
faces strong competition from Japanese brands.
Document Page
Impact of data on business decision making
Importance of data in taking decisions lies in the consistency
as well as continuous growth. It allows the entities to create
the new opportunities for business, generate higher amount of
revenues, optimizing the operational efforts, producing the
actionable insights and predicting trends for future.
Quantitative analysis of data is focused on the statistics and
numbers. Analysis of this data helps in making smarter
decision driven by data.
tabler-icon-diamond-filled.svg

Paraphrase This Document

Need a fresh take? Get an instant paraphrase of this document with our AI Paraphraser
Document Page
Bar graph –
Bar charts are used for comparing the values visually
against each other. Data for the bar chart is entered for
each data column and each of the numeric data becomes
bar. 2 factors bar chart combines the data columns into
single chart.
Document Page
Example of bar chart
In this figure net income
attributable to Ford for
the ended 2018 and the
company adjusted EBIT
through segment is
presented.
Document Page
Example of line chart
The chart shows the
performance of the
company’s common stock
over 5 year period as
compared to Standard &
Poor’s 500 stocks Index
and against its competitor
Dow Jones Automobiles &
Parts Titans 30 Index.
tabler-icon-diamond-filled.svg

Paraphrase This Document

Need a fresh take? Get an instant paraphrase of this document with our AI Paraphraser
Document Page
Reference and bibliography
Demir, I., Dick, C., & Westermann, R. (2014). Multi-charts for comparative
3d ensemble visualization. IEEE Transactions on Visualization and Computer
Graphics, 20(12), 2694-2703.
Ford Motor Company (2019). Ford – New Cars, Trucks, SUVs, Crossovers &
Hybrids | Vehicles Built Just for You | Ford.com. Retrieved 17 August 2019,
from https://www.ford.com/
Kenny, P. (2014). Better business decisions from data: Statistical analysis
for professional success. New York, NY: Apress.
Lim, Y., & Kang, U. (2015, August). Mascot: Memory-efficient and accurate
sampling for counting local triangles in graph streams. In Proceedings of
the 21th ACM SIGKDD international conference on knowledge discovery
and data mining (pp. 685-694). ACM.
Watson, H. J. (2018). Successful analytics leaders. Business Intelligence
Journal, 23(1), 5–11.
Document Page
chevron_up_icon
1 out of 9
circle_padding
hide_on_mobile
zoom_out_icon
[object Object]