BUS501: Business Analytics and Statistics Report for Good Harvest
VerifiedAdded on 2020/03/16
|17
|3164
|169
Report
AI Summary
This report, prepared for BUS501, analyzes the business data of Good Harvest, a two-year-old organic farm product enterprise. The analysis addresses the CEO's key concerns regarding product performance, sales revenue, and profit maximization. It uses data from SPSS format to examine top/worst-selling products, payment method differences (Cash, Credit, Visa, MasterCard), the impact of product location within the shop, and sales/gross profit variations across different months and seasons. Statistical methods, including descriptive statistics, independent samples t-tests, and ANOVA tests, are employed to test various hypotheses. The findings reveal the best and worst-selling products, significant differences in payment methods (Visa vs. MasterCard), the influence of product location on sales, and monthly variations in sales and gross profits. The report concludes with a discussion of the results and provides recommendations for the CEO to improve sales and profitability.
BUS501 - Business Analytics and Statistics
Name:
Lecturer name:
30th September 2017
Name:
Lecturer name:
30th September 2017
Paraphrase This Document
Need a fresh take? Get an instant paraphrase of this document with our AI Paraphraser
Table of Contents
1. Introduction..............................................................................................................................3
2. Problem definition and business intelligence required.............................................................4
3. Selected analytics methods and technical analysis...................................................................4
4. Results and findings.................................................................................................................5
Analysis 1: What are the top/worst selling products in terms of sales?.......................................5
Analysis 2: Is there a difference in payments methods?..............................................................6
Hypothesis 1:............................................................................................................................6
Hypothesis 2:............................................................................................................................7
Analysis 3: Are the differences in sales performance based on where the product is located in
the shop?......................................................................................................................................8
Hypothesis 4:............................................................................................................................8
Analysis 4: Is there a difference in sales and gross profits between different months of the
year?...........................................................................................................................................10
Hypothesis 5:..........................................................................................................................10
Hypothesis 6:..........................................................................................................................11
Analysis 5: Are their differences in sales performance between different seasons?.................12
Hypothesis 7:..........................................................................................................................13
5. Discussion of the results and recommendations.....................................................................14
Recommendations......................................................................................................................14
References......................................................................................................................................15
Table 1: Top/Worst selling products...............................................................................................5
Table 2: t-Test: Two-Sample Assuming Equal Variances..............................................................6
Table 3: t-Test: Two-Sample Assuming Equal Variances..............................................................7
Table 4: Analysis of variance (ANOVA) for the total sales versus product location.....................8
Table 5: Mean total sales based on product location.......................................................................9
Table 6: Analysis of variance (ANOVA) for the net sales versus months....................................10
Table 7: Mean net sales based on month of the year.....................................................................11
Table 8: Analysis of variance (ANOVA) for the gross profits versus months..............................11
Table 9: Mean gross profits based on month of the year...............................................................12
Table 10: Analysis of variance (ANOVA) for the net sales versus seasons.................................13
Table 11: Mean net sales based on season.....................................................................................13
⊘ This is a preview!⊘
Do you want full access?
Subscribe today to unlock all pages.
Trusted by 1+ million students worldwide
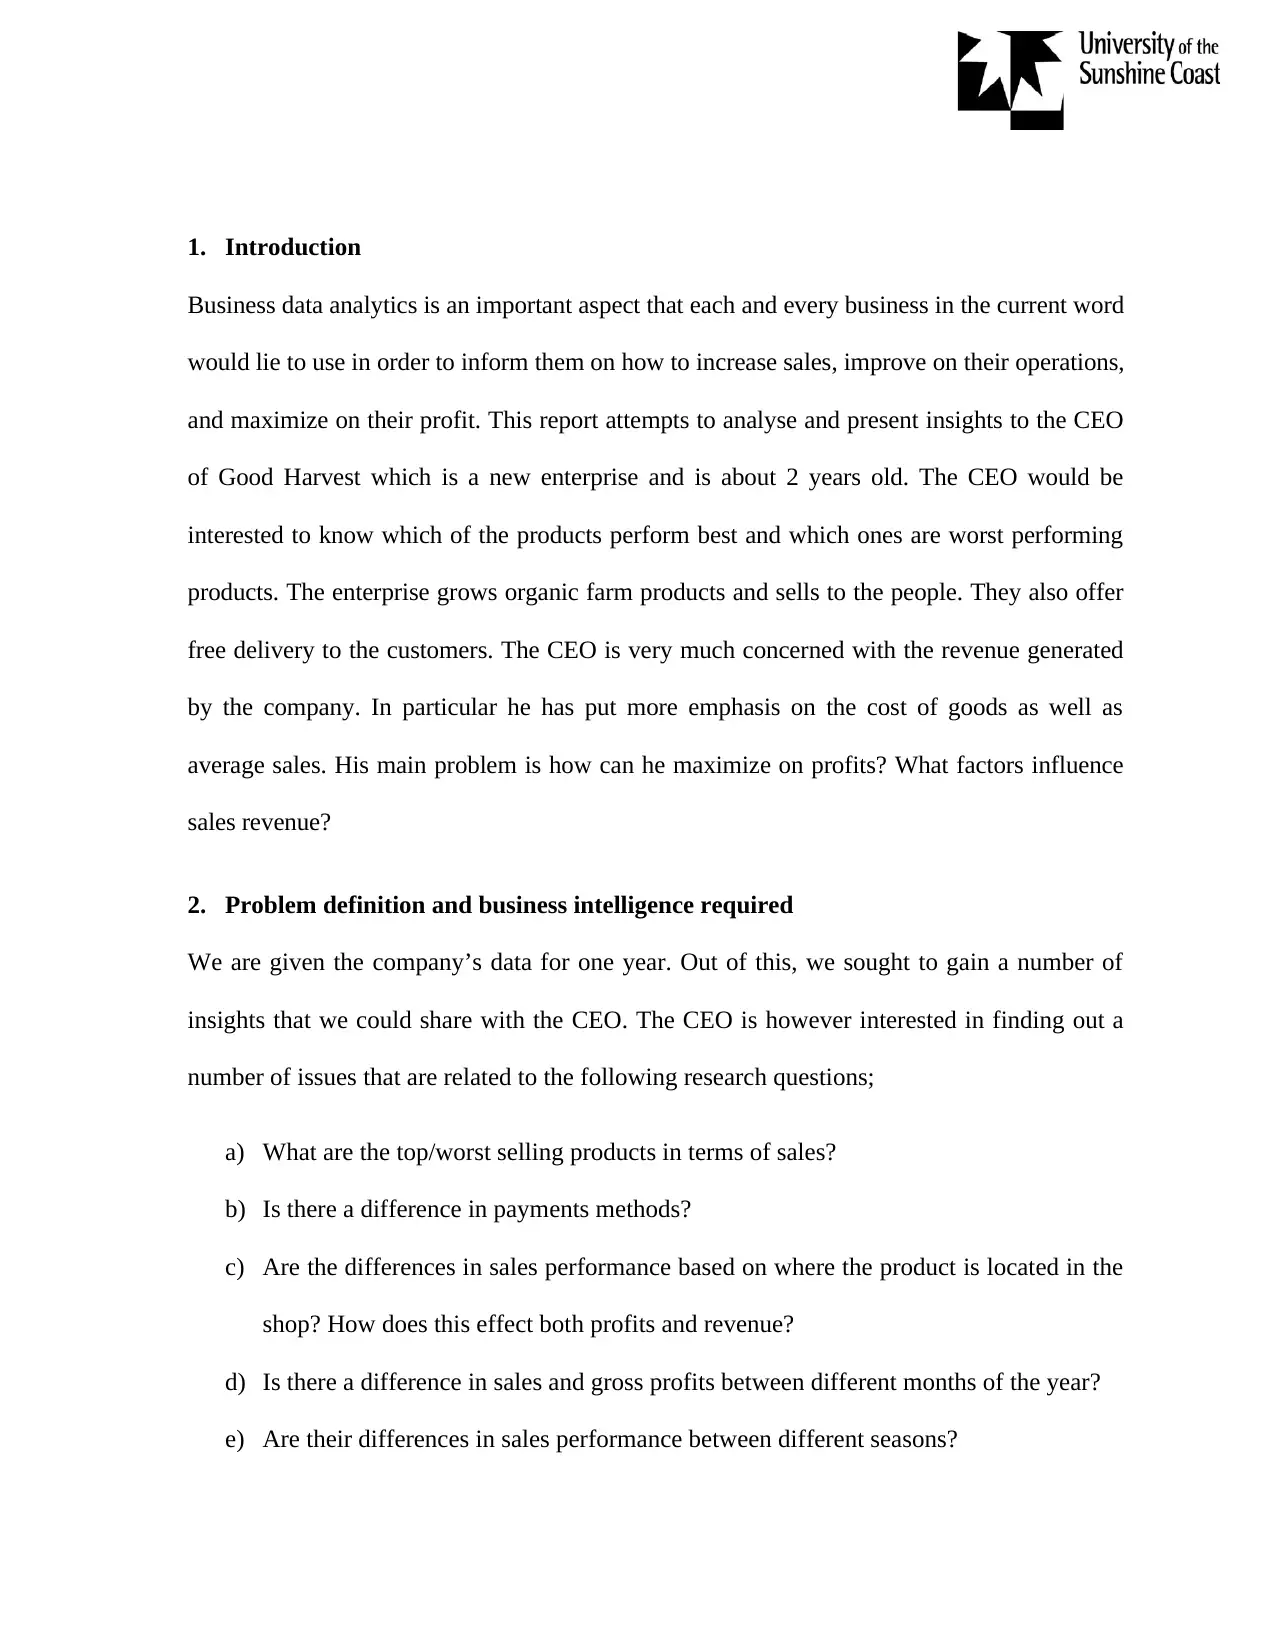
1. Introduction
Business data analytics is an important aspect that each and every business in the current word
would lie to use in order to inform them on how to increase sales, improve on their operations,
and maximize on their profit. This report attempts to analyse and present insights to the CEO
of Good Harvest which is a new enterprise and is about 2 years old. The CEO would be
interested to know which of the products perform best and which ones are worst performing
products. The enterprise grows organic farm products and sells to the people. They also offer
free delivery to the customers. The CEO is very much concerned with the revenue generated
by the company. In particular he has put more emphasis on the cost of goods as well as
average sales. His main problem is how can he maximize on profits? What factors influence
sales revenue?
2. Problem definition and business intelligence required
We are given the company’s data for one year. Out of this, we sought to gain a number of
insights that we could share with the CEO. The CEO is however interested in finding out a
number of issues that are related to the following research questions;
a) What are the top/worst selling products in terms of sales?
b) Is there a difference in payments methods?
c) Are the differences in sales performance based on where the product is located in the
shop? How does this effect both profits and revenue?
d) Is there a difference in sales and gross profits between different months of the year?
e) Are their differences in sales performance between different seasons?
Paraphrase This Document
Need a fresh take? Get an instant paraphrase of this document with our AI Paraphraser
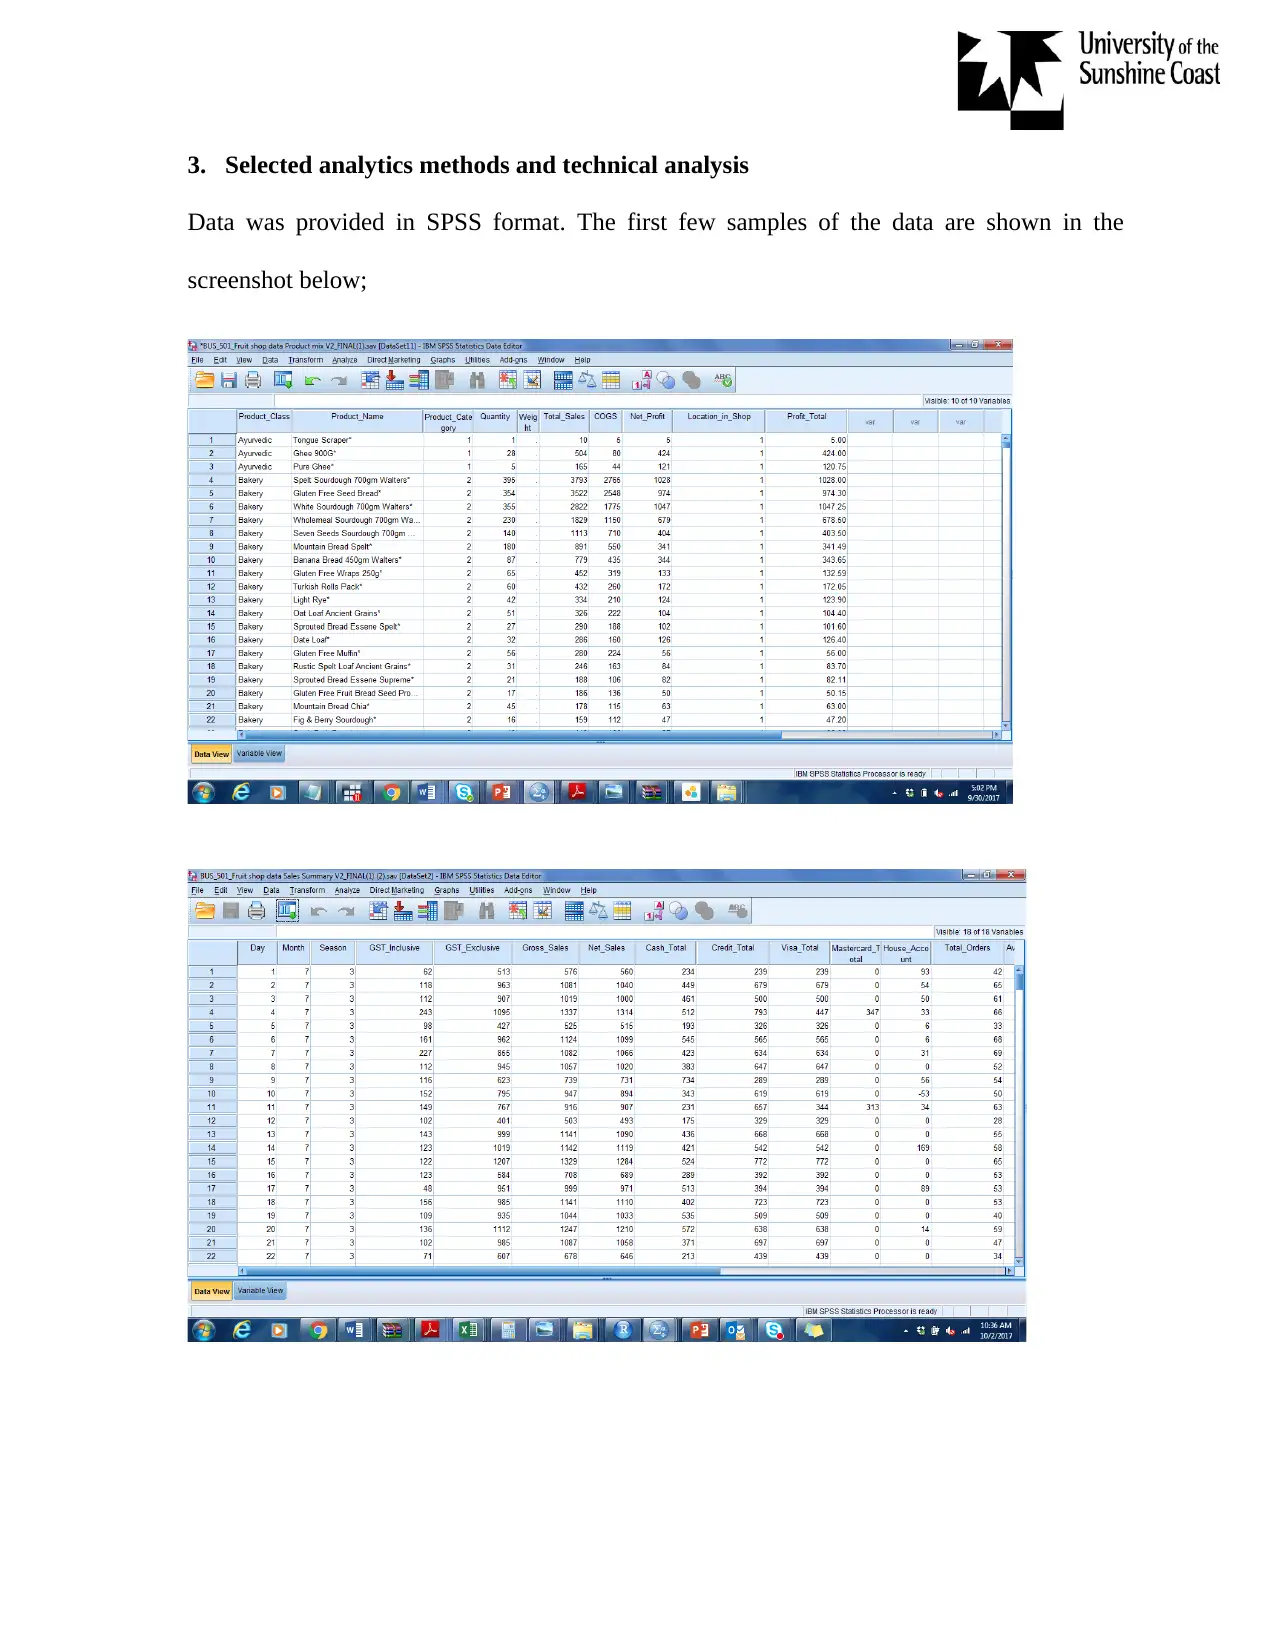
3. Selected analytics methods and technical analysis
Data was provided in SPSS format. The first few samples of the data are shown in the
screenshot below;
Data was provided in SPSS format. The first few samples of the data are shown in the
screenshot below;
4. Results and findings
Analysis 1: What are the top/worst selling products in terms of sales?
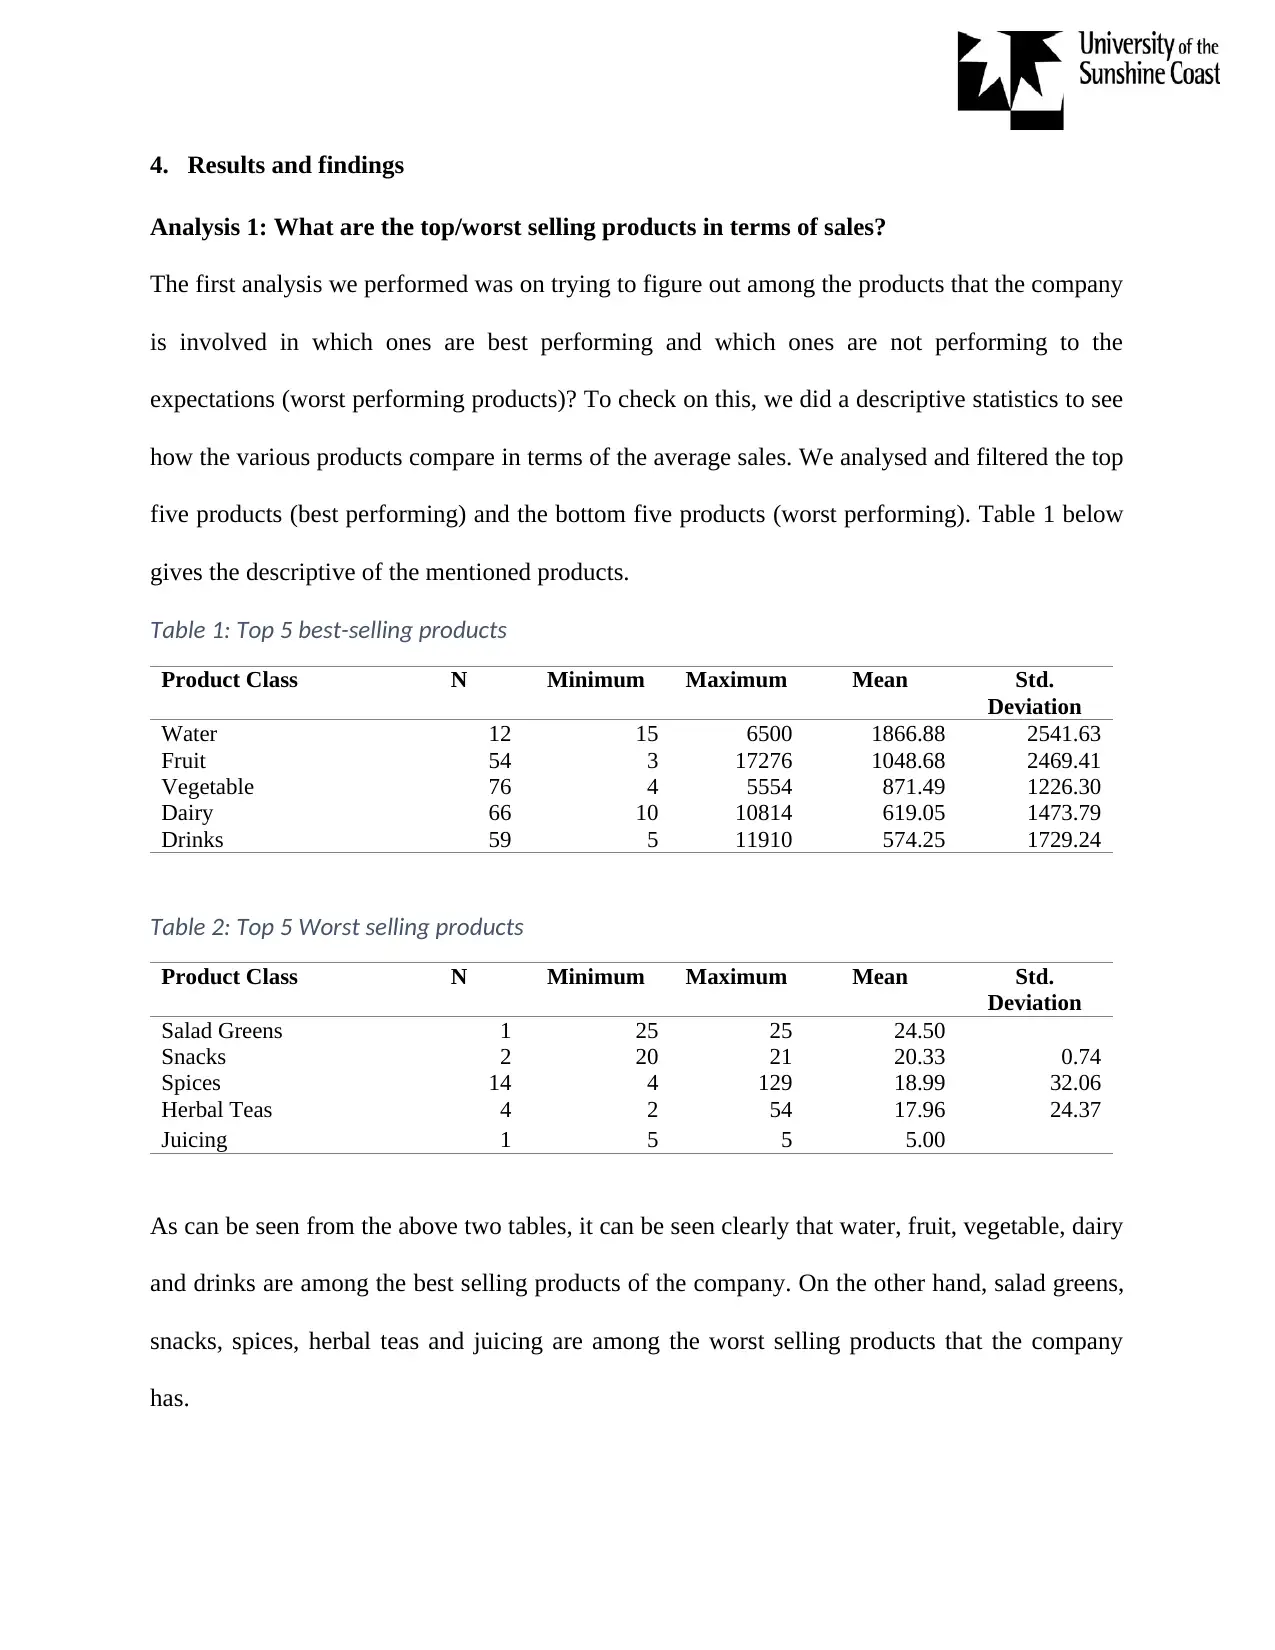
The first analysis we performed was on trying to figure out among the products that the company
is involved in which ones are best performing and which ones are not performing to the
expectations (worst performing products)? To check on this, we did a descriptive statistics to see
how the various products compare in terms of the average sales. We analysed and filtered the top
five products (best performing) and the bottom five products (worst performing). Table 1 below
gives the descriptive of the mentioned products.
Table 1: Top 5 best-selling products
Product Class N Minimum Maximum Mean Std.
Deviation
Water 12 15 6500 1866.88 2541.63
Fruit 54 3 17276 1048.68 2469.41
Vegetable 76 4 5554 871.49 1226.30
Dairy 66 10 10814 619.05 1473.79
Drinks 59 5 11910 574.25 1729.24
Table 2: Top 5 Worst selling products
Product Class N Minimum Maximum Mean Std.
Deviation
Salad Greens 1 25 25 24.50
Snacks 2 20 21 20.33 0.74
Spices 14 4 129 18.99 32.06
Herbal Teas 4 2 54 17.96 24.37
Juicing 1 5 5 5.00
As can be seen from the above two tables, it can be seen clearly that water, fruit, vegetable, dairy
and drinks are among the best selling products of the company. On the other hand, salad greens,
snacks, spices, herbal teas and juicing are among the worst selling products that the company
has.
Analysis 1: What are the top/worst selling products in terms of sales?
The first analysis we performed was on trying to figure out among the products that the company
is involved in which ones are best performing and which ones are not performing to the
expectations (worst performing products)? To check on this, we did a descriptive statistics to see
how the various products compare in terms of the average sales. We analysed and filtered the top
five products (best performing) and the bottom five products (worst performing). Table 1 below
gives the descriptive of the mentioned products.
Table 1: Top 5 best-selling products
Product Class N Minimum Maximum Mean Std.
Deviation
Water 12 15 6500 1866.88 2541.63
Fruit 54 3 17276 1048.68 2469.41
Vegetable 76 4 5554 871.49 1226.30
Dairy 66 10 10814 619.05 1473.79
Drinks 59 5 11910 574.25 1729.24
Table 2: Top 5 Worst selling products
Product Class N Minimum Maximum Mean Std.
Deviation
Salad Greens 1 25 25 24.50
Snacks 2 20 21 20.33 0.74
Spices 14 4 129 18.99 32.06
Herbal Teas 4 2 54 17.96 24.37
Juicing 1 5 5 5.00
As can be seen from the above two tables, it can be seen clearly that water, fruit, vegetable, dairy
and drinks are among the best selling products of the company. On the other hand, salad greens,
snacks, spices, herbal teas and juicing are among the worst selling products that the company
has.
⊘ This is a preview!⊘
Do you want full access?
Subscribe today to unlock all pages.
Trusted by 1+ million students worldwide
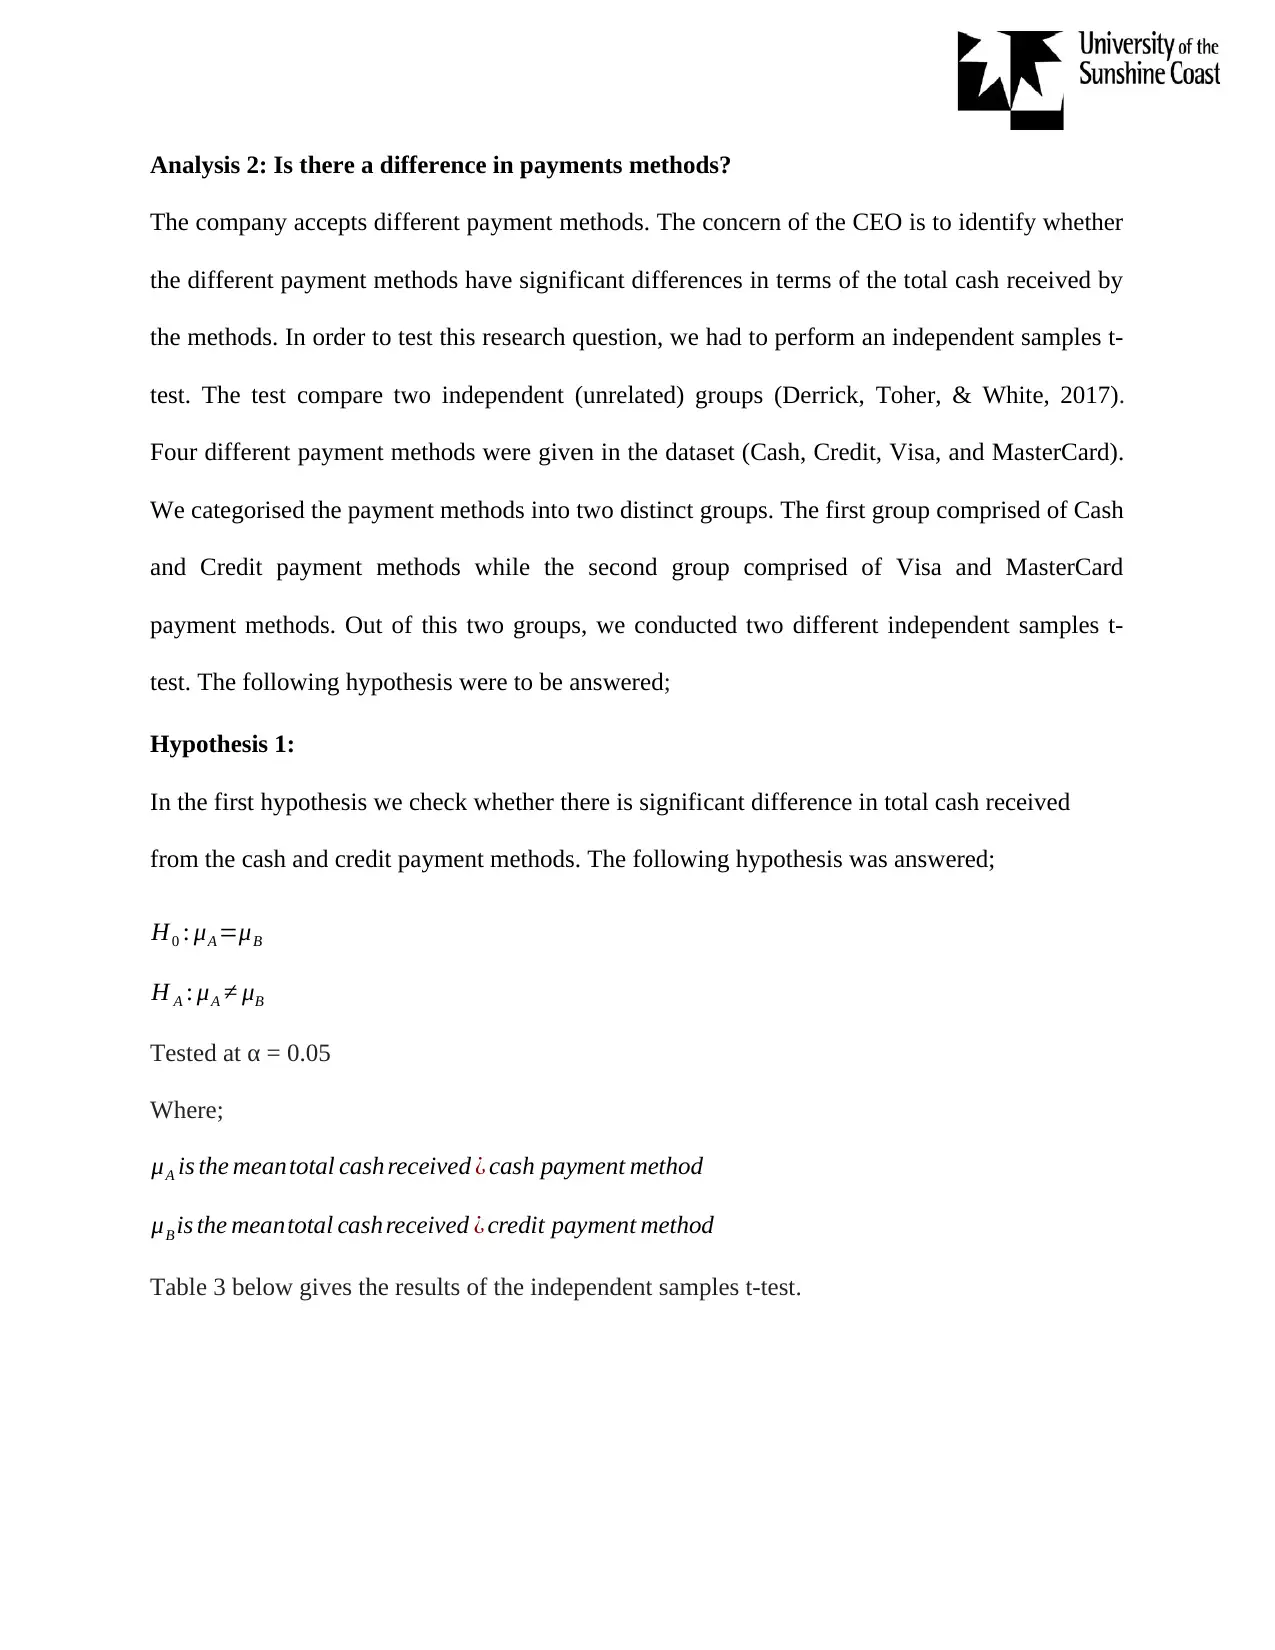
Analysis 2: Is there a difference in payments methods?
The company accepts different payment methods. The concern of the CEO is to identify whether
the different payment methods have significant differences in terms of the total cash received by
the methods. In order to test this research question, we had to perform an independent samples t-
test. The test compare two independent (unrelated) groups (Derrick, Toher, & White, 2017).
Four different payment methods were given in the dataset (Cash, Credit, Visa, and MasterCard).
We categorised the payment methods into two distinct groups. The first group comprised of Cash
and Credit payment methods while the second group comprised of Visa and MasterCard
payment methods. Out of this two groups, we conducted two different independent samples t-
test. The following hypothesis were to be answered;
Hypothesis 1:
In the first hypothesis we check whether there is significant difference in total cash received
from the cash and credit payment methods. The following hypothesis was answered;
H0 : μA =μB
H A : μA ≠ μB
Tested at α = 0.05
Where;
μA is the meantotal cash received ¿ cash payment method
μB is the meantotal cash received ¿ credit payment method
Table 3 below gives the results of the independent samples t-test.
Paraphrase This Document
Need a fresh take? Get an instant paraphrase of this document with our AI Paraphraser
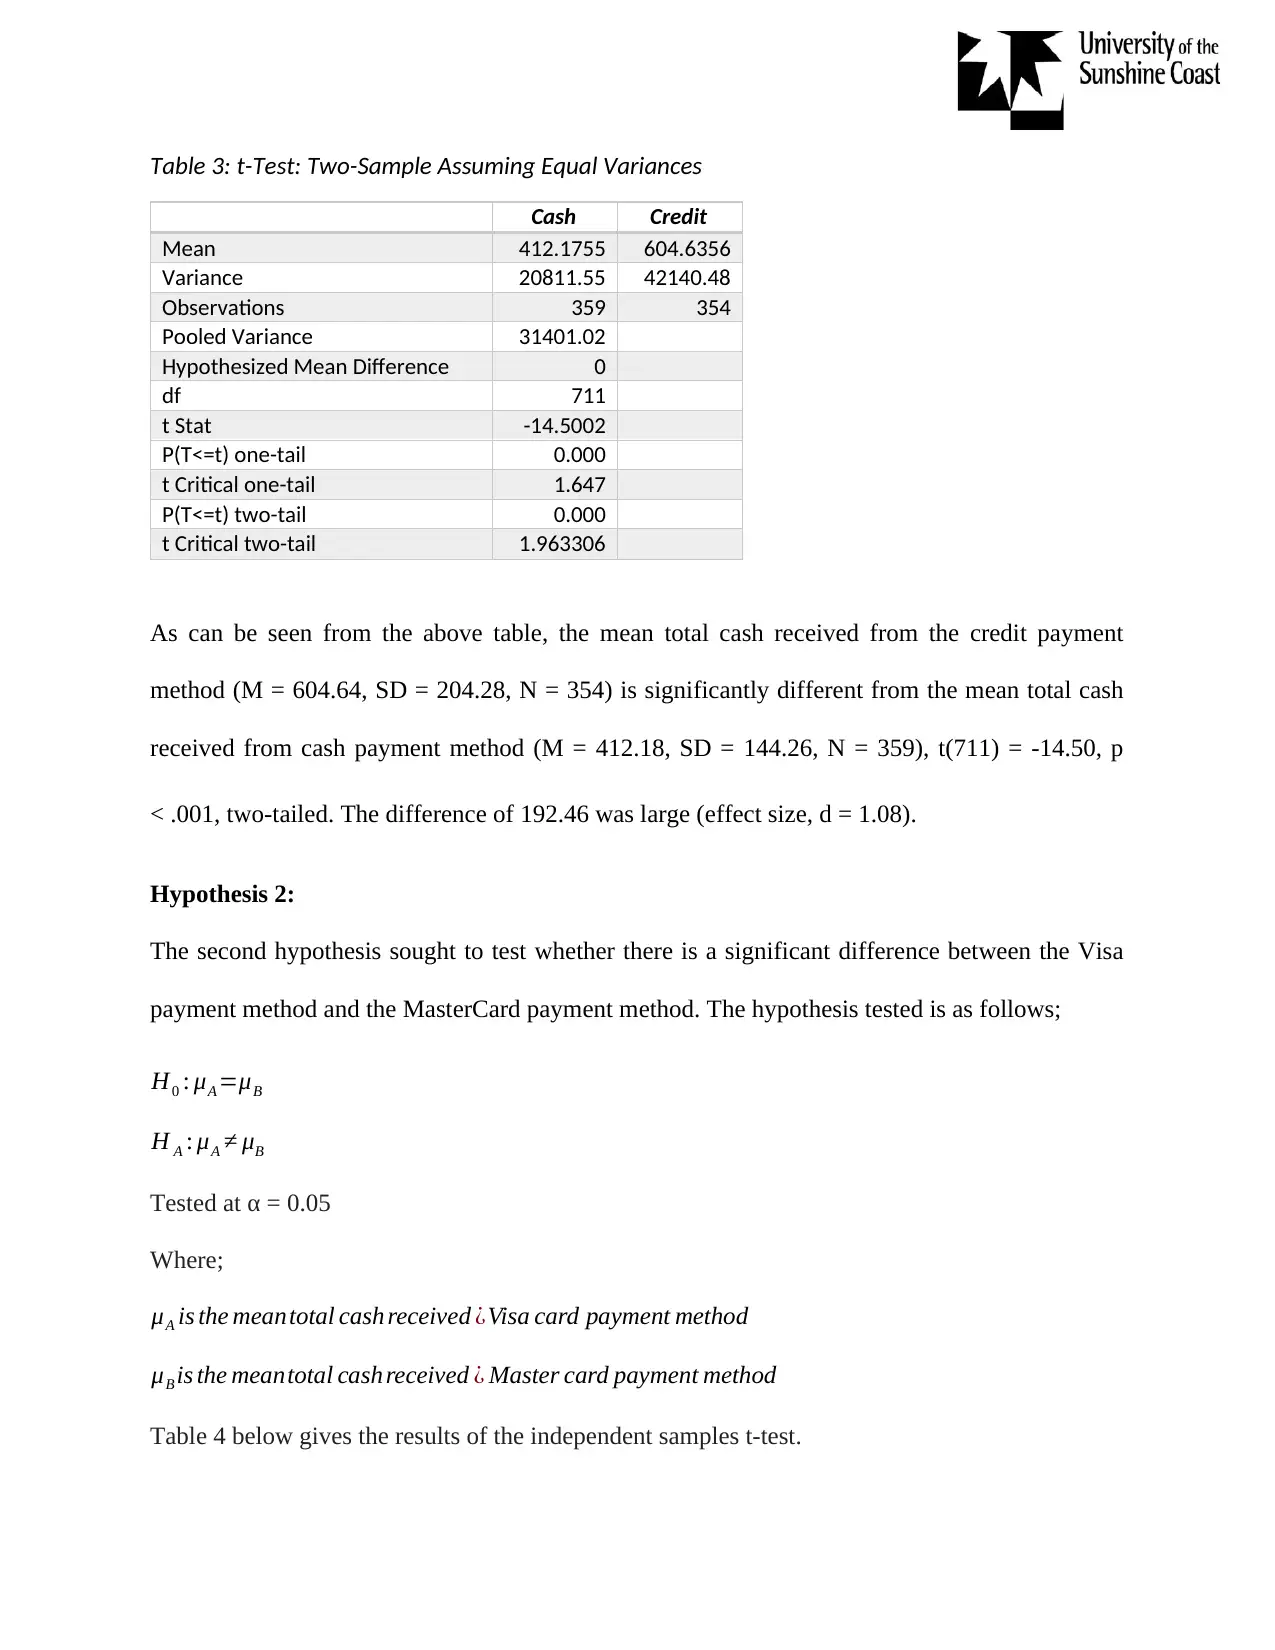
Table 3: t-Test: Two-Sample Assuming Equal Variances
Cash Credit
Mean 412.1755 604.6356
Variance 20811.55 42140.48
Observations 359 354
Pooled Variance 31401.02
Hypothesized Mean Difference 0
df 711
t Stat -14.5002
P(T<=t) one-tail 0.000
t Critical one-tail 1.647
P(T<=t) two-tail 0.000
t Critical two-tail 1.963306
As can be seen from the above table, the mean total cash received from the credit payment
method (M = 604.64, SD = 204.28, N = 354) is significantly different from the mean total cash
received from cash payment method (M = 412.18, SD = 144.26, N = 359), t(711) = -14.50, p
< .001, two-tailed. The difference of 192.46 was large (effect size, d = 1.08).
Hypothesis 2:
The second hypothesis sought to test whether there is a significant difference between the Visa
payment method and the MasterCard payment method. The hypothesis tested is as follows;
H0 : μA =μB
H A : μA ≠ μB
Tested at α = 0.05
Where;
μA is the meantotal cash received ¿Visa card payment method
μB is the meantotal cash received ¿ Master card payment method
Table 4 below gives the results of the independent samples t-test.
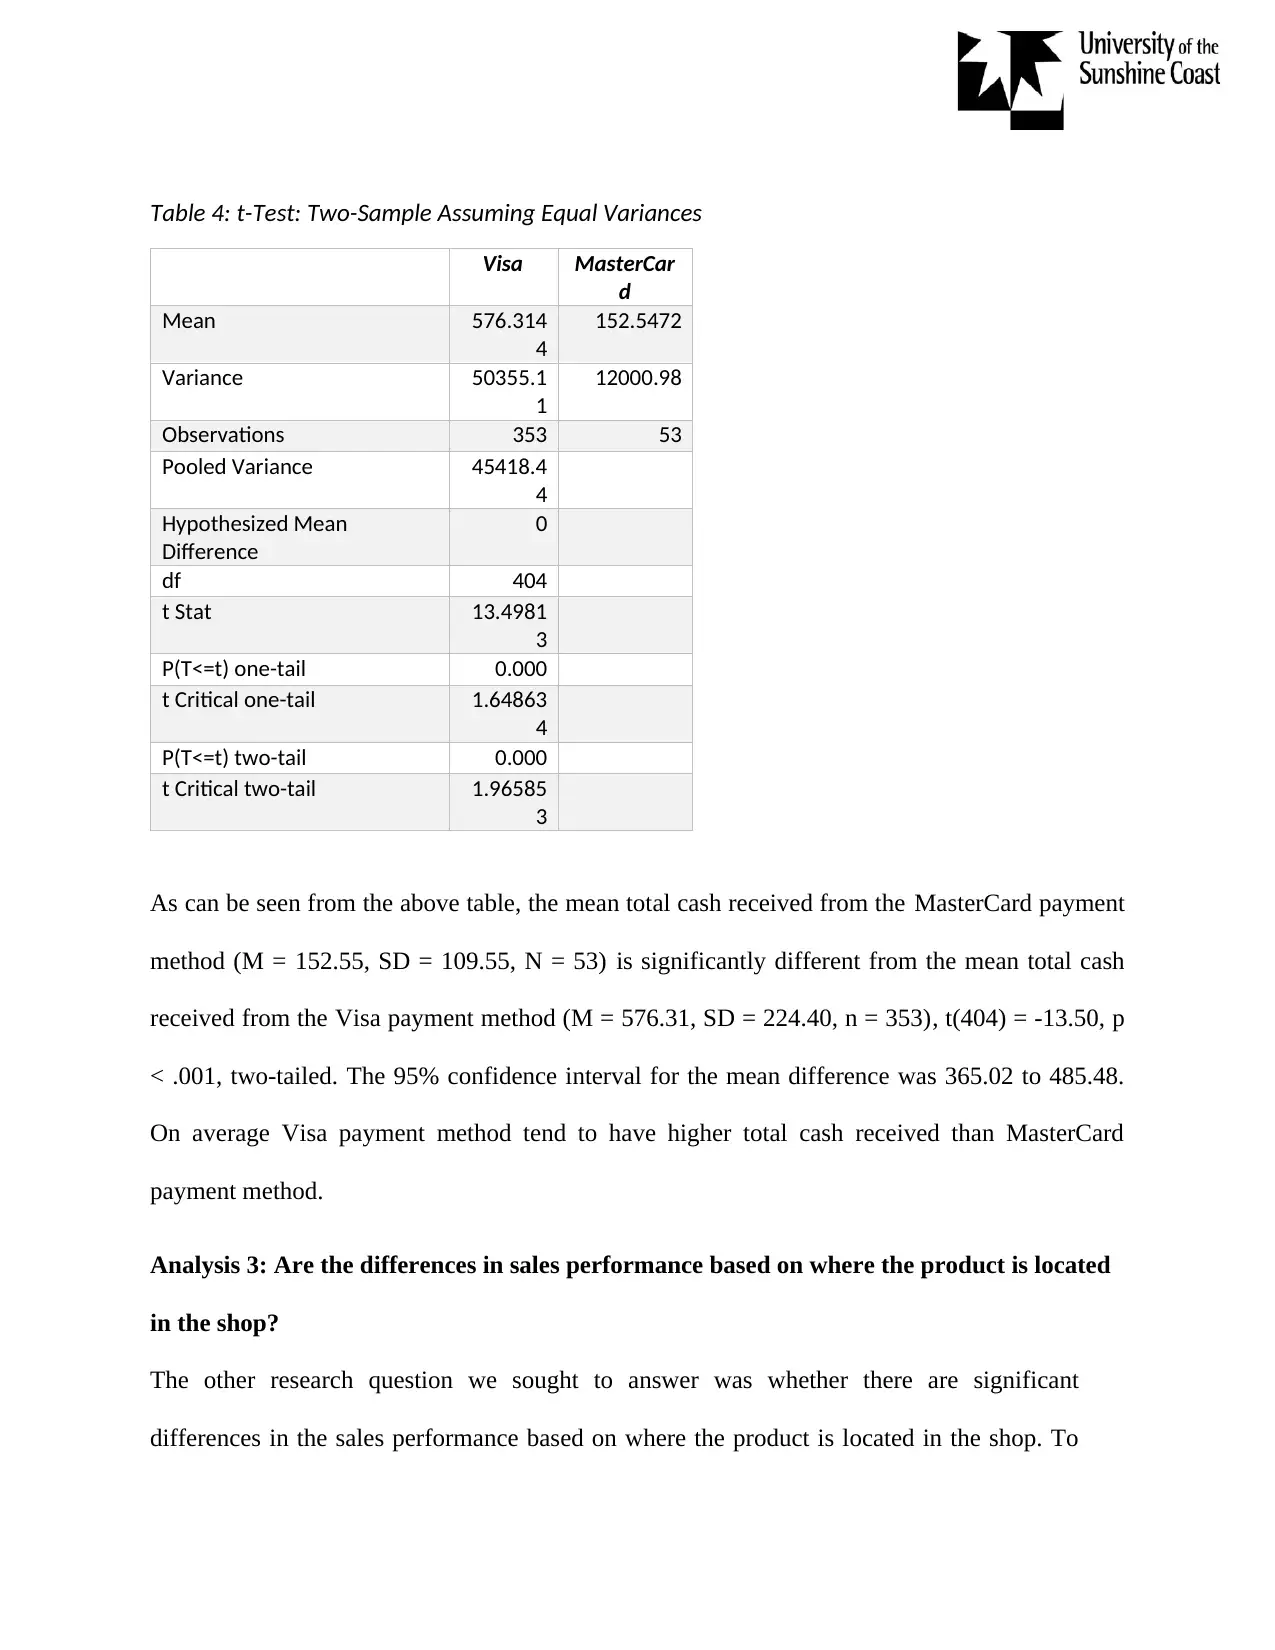
Table 4: t-Test: Two-Sample Assuming Equal Variances
Visa MasterCar
d
Mean 576.314
4
152.5472
Variance 50355.1
1
12000.98
Observations 353 53
Pooled Variance 45418.4
4
Hypothesized Mean
Difference
0
df 404
t Stat 13.4981
3
P(T<=t) one-tail 0.000
t Critical one-tail 1.64863
4
P(T<=t) two-tail 0.000
t Critical two-tail 1.96585
3
As can be seen from the above table, the mean total cash received from the MasterCard payment
method (M = 152.55, SD = 109.55, N = 53) is significantly different from the mean total cash
received from the Visa payment method (M = 576.31, SD = 224.40, n = 353), t(404) = -13.50, p
< .001, two-tailed. The 95% confidence interval for the mean difference was 365.02 to 485.48.
On average Visa payment method tend to have higher total cash received than MasterCard
payment method.
Analysis 3: Are the differences in sales performance based on where the product is located
in the shop?
The other research question we sought to answer was whether there are significant
differences in the sales performance based on where the product is located in the shop. To
⊘ This is a preview!⊘
Do you want full access?
Subscribe today to unlock all pages.
Trusted by 1+ million students worldwide
test this research question, analysis of variance (ANOVA) test was performed. The test
(ANOVA) checks whether the means of two or more populations are equal. The hypothesis
that we used to test and answer the above research question is given below;
Hypothesis 4:
H0 : μA =μB =μC=μD=μE
H A : At least one of the meansis different
Tested at α = 0.05
Where,
μA is the mean for front location
μB is the mean for left location
μC is the mean for outside front location
μD is the mean for rear location
μE is the mean for right location
Results are presented in table 5 and 6 below;
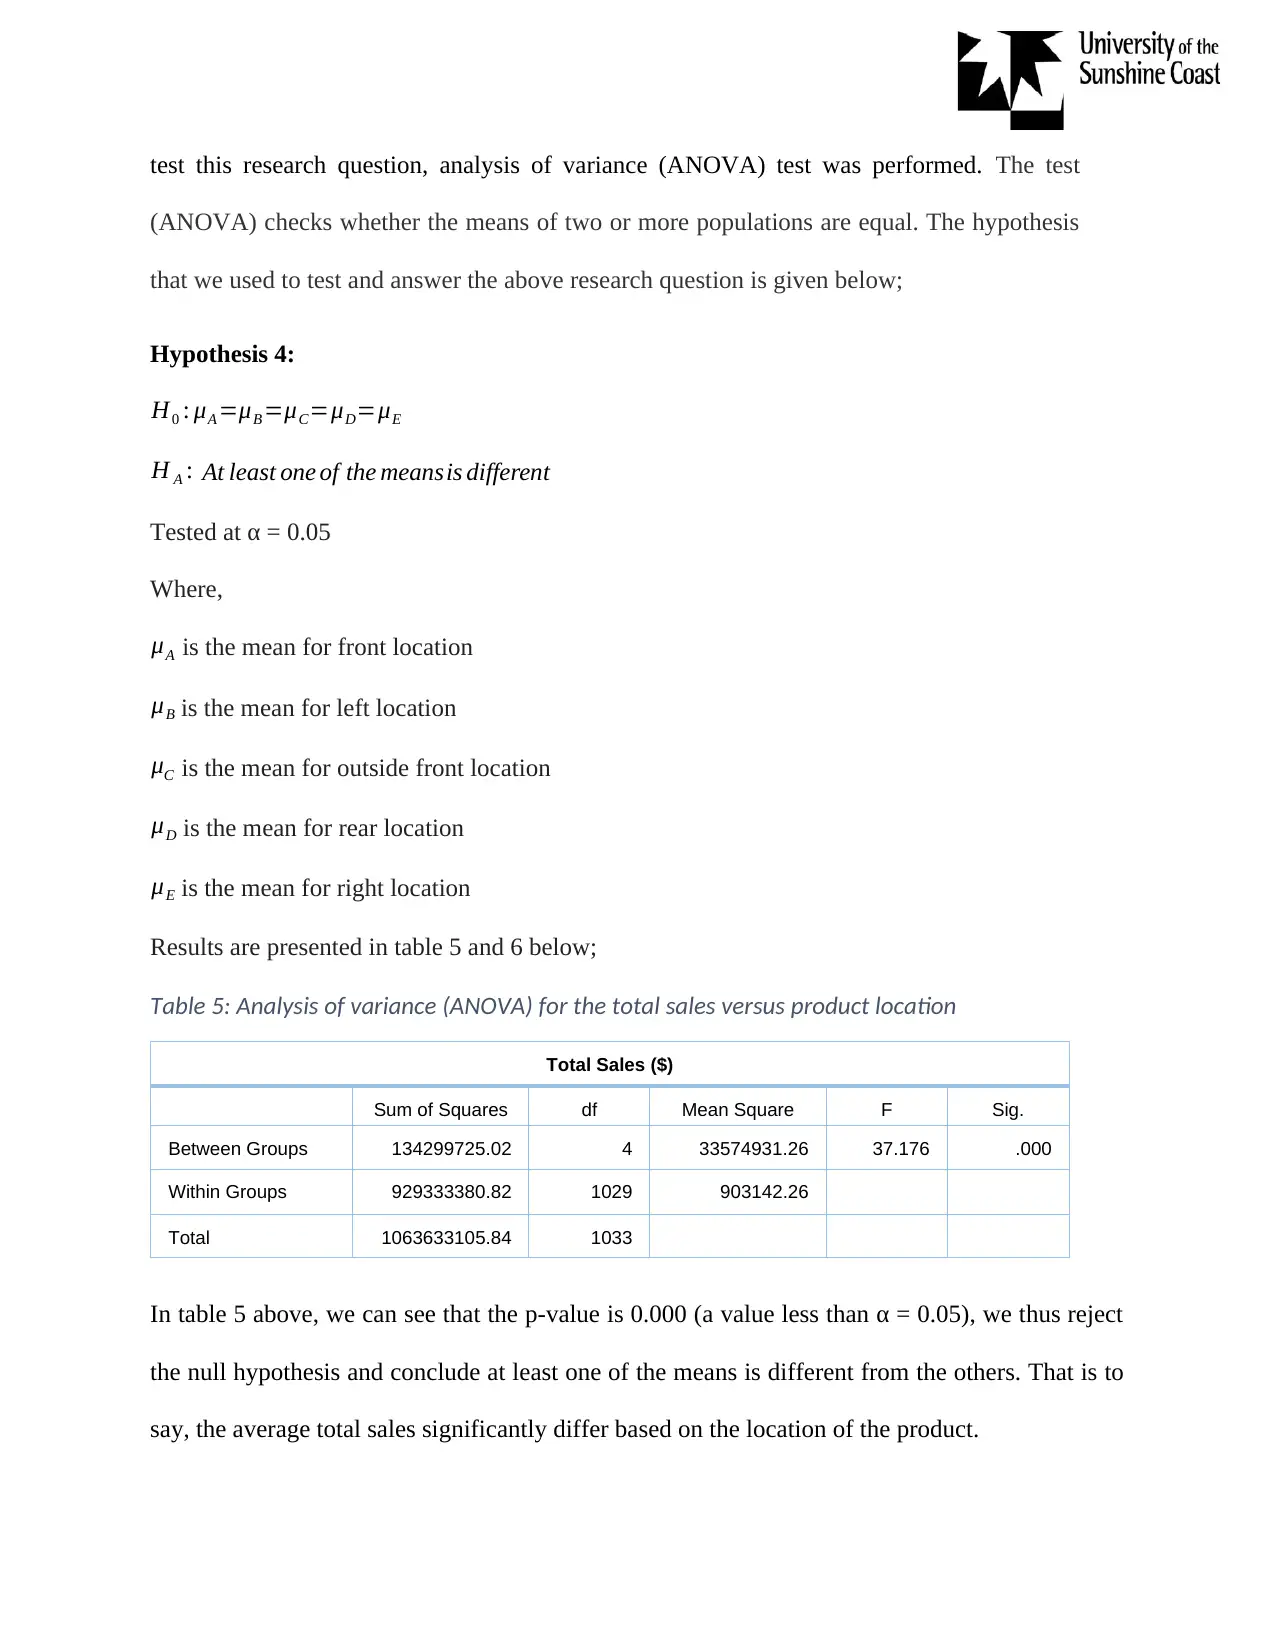
Table 5: Analysis of variance (ANOVA) for the total sales versus product location
Total Sales ($)
Sum of Squares df Mean Square F Sig.
Between Groups 134299725.02 4 33574931.26 37.176 .000
Within Groups 929333380.82 1029 903142.26
Total 1063633105.84 1033
In table 5 above, we can see that the p-value is 0.000 (a value less than α = 0.05), we thus reject
the null hypothesis and conclude at least one of the means is different from the others. That is to
say, the average total sales significantly differ based on the location of the product.
(ANOVA) checks whether the means of two or more populations are equal. The hypothesis
that we used to test and answer the above research question is given below;
Hypothesis 4:
H0 : μA =μB =μC=μD=μE
H A : At least one of the meansis different
Tested at α = 0.05
Where,
μA is the mean for front location
μB is the mean for left location
μC is the mean for outside front location
μD is the mean for rear location
μE is the mean for right location
Results are presented in table 5 and 6 below;
Table 5: Analysis of variance (ANOVA) for the total sales versus product location
Total Sales ($)
Sum of Squares df Mean Square F Sig.
Between Groups 134299725.02 4 33574931.26 37.176 .000
Within Groups 929333380.82 1029 903142.26
Total 1063633105.84 1033
In table 5 above, we can see that the p-value is 0.000 (a value less than α = 0.05), we thus reject
the null hypothesis and conclude at least one of the means is different from the others. That is to
say, the average total sales significantly differ based on the location of the product.
Paraphrase This Document
Need a fresh take? Get an instant paraphrase of this document with our AI Paraphraser
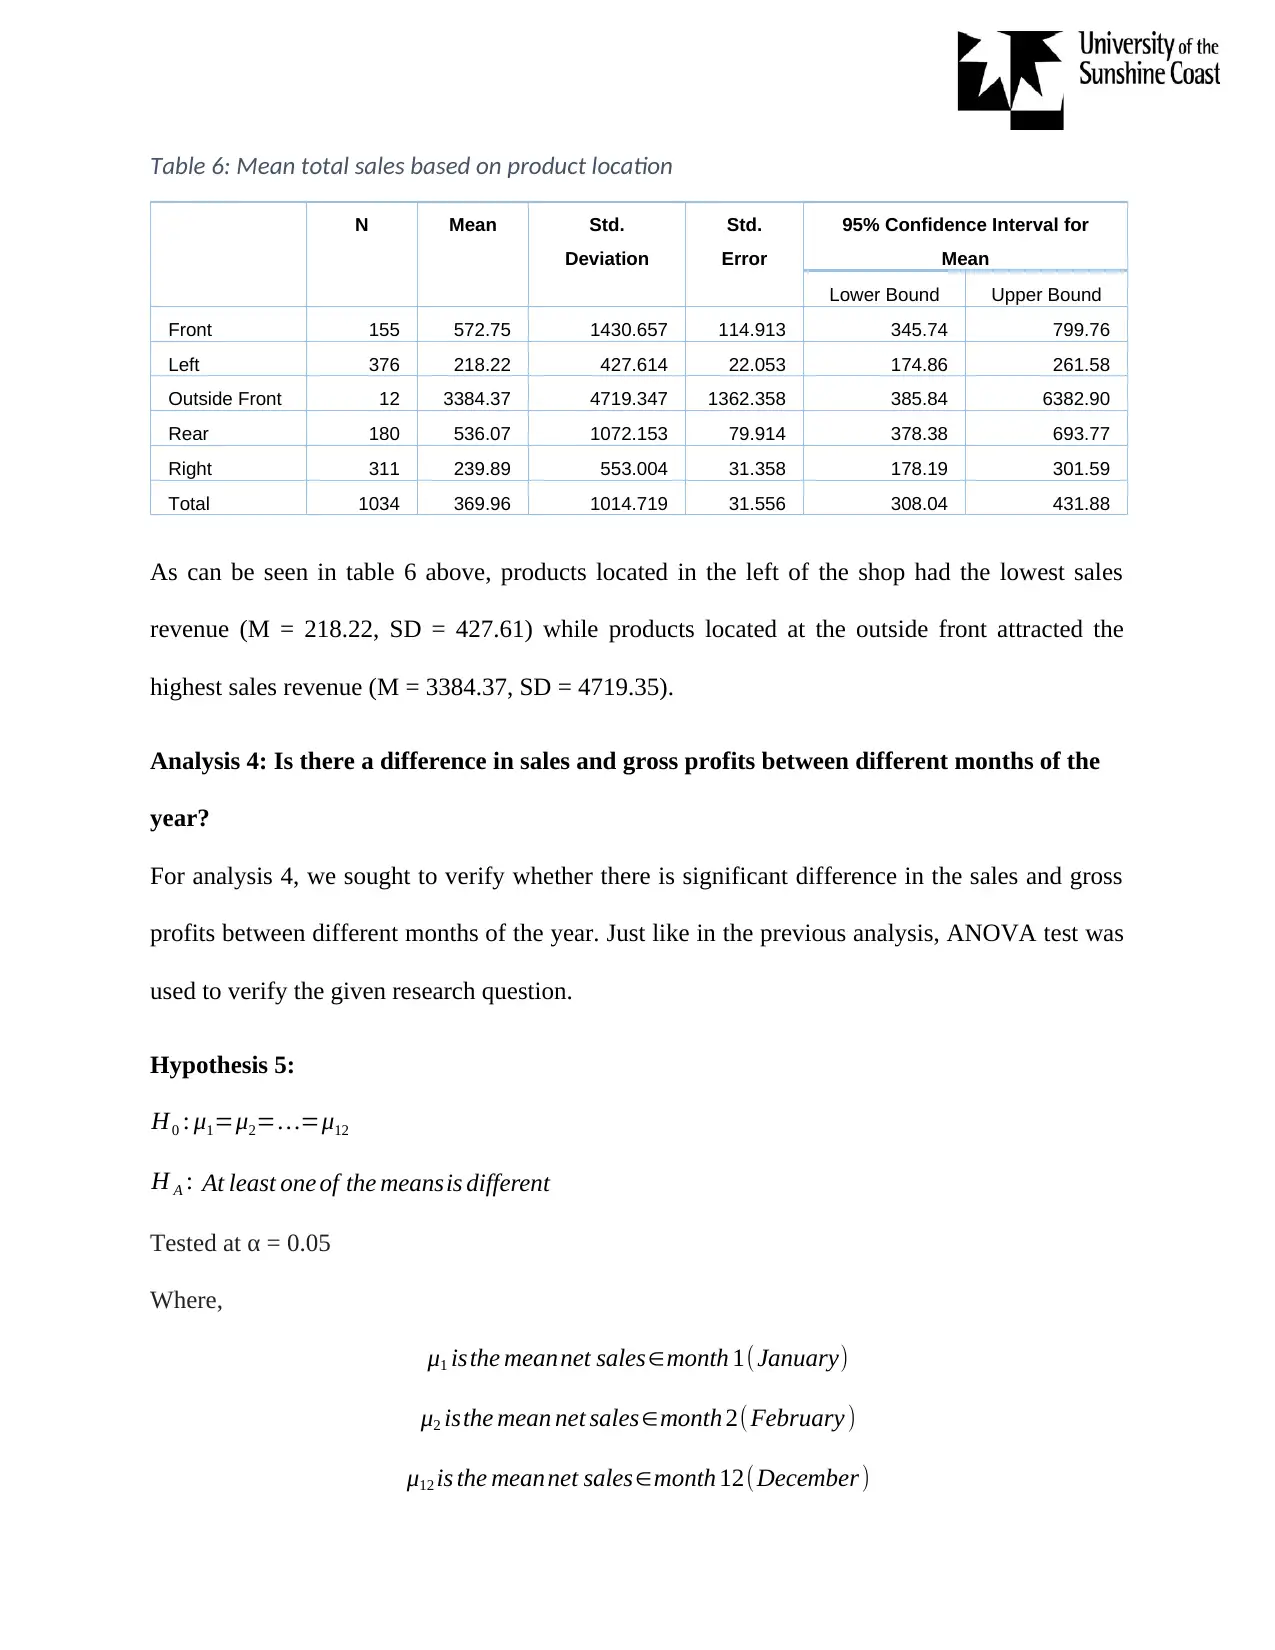
Table 6: Mean total sales based on product location
N Mean Std.
Deviation
Std.
Error
95% Confidence Interval for
Mean
Lower Bound Upper Bound
Front 155 572.75 1430.657 114.913 345.74 799.76
Left 376 218.22 427.614 22.053 174.86 261.58
Outside Front 12 3384.37 4719.347 1362.358 385.84 6382.90
Rear 180 536.07 1072.153 79.914 378.38 693.77
Right 311 239.89 553.004 31.358 178.19 301.59
Total 1034 369.96 1014.719 31.556 308.04 431.88
As can be seen in table 6 above, products located in the left of the shop had the lowest sales
revenue (M = 218.22, SD = 427.61) while products located at the outside front attracted the
highest sales revenue (M = 3384.37, SD = 4719.35).
Analysis 4: Is there a difference in sales and gross profits between different months of the
year?
For analysis 4, we sought to verify whether there is significant difference in the sales and gross
profits between different months of the year. Just like in the previous analysis, ANOVA test was
used to verify the given research question.
Hypothesis 5:
H0 : μ1=μ2=…=μ12
H A : At least one of the meansis different
Tested at α = 0.05
Where,
μ1 isthe meannet sales∈month 1(January)
μ2 isthe mean net sales∈month 2( February )
μ12 is the meannet sales∈month 12(December )
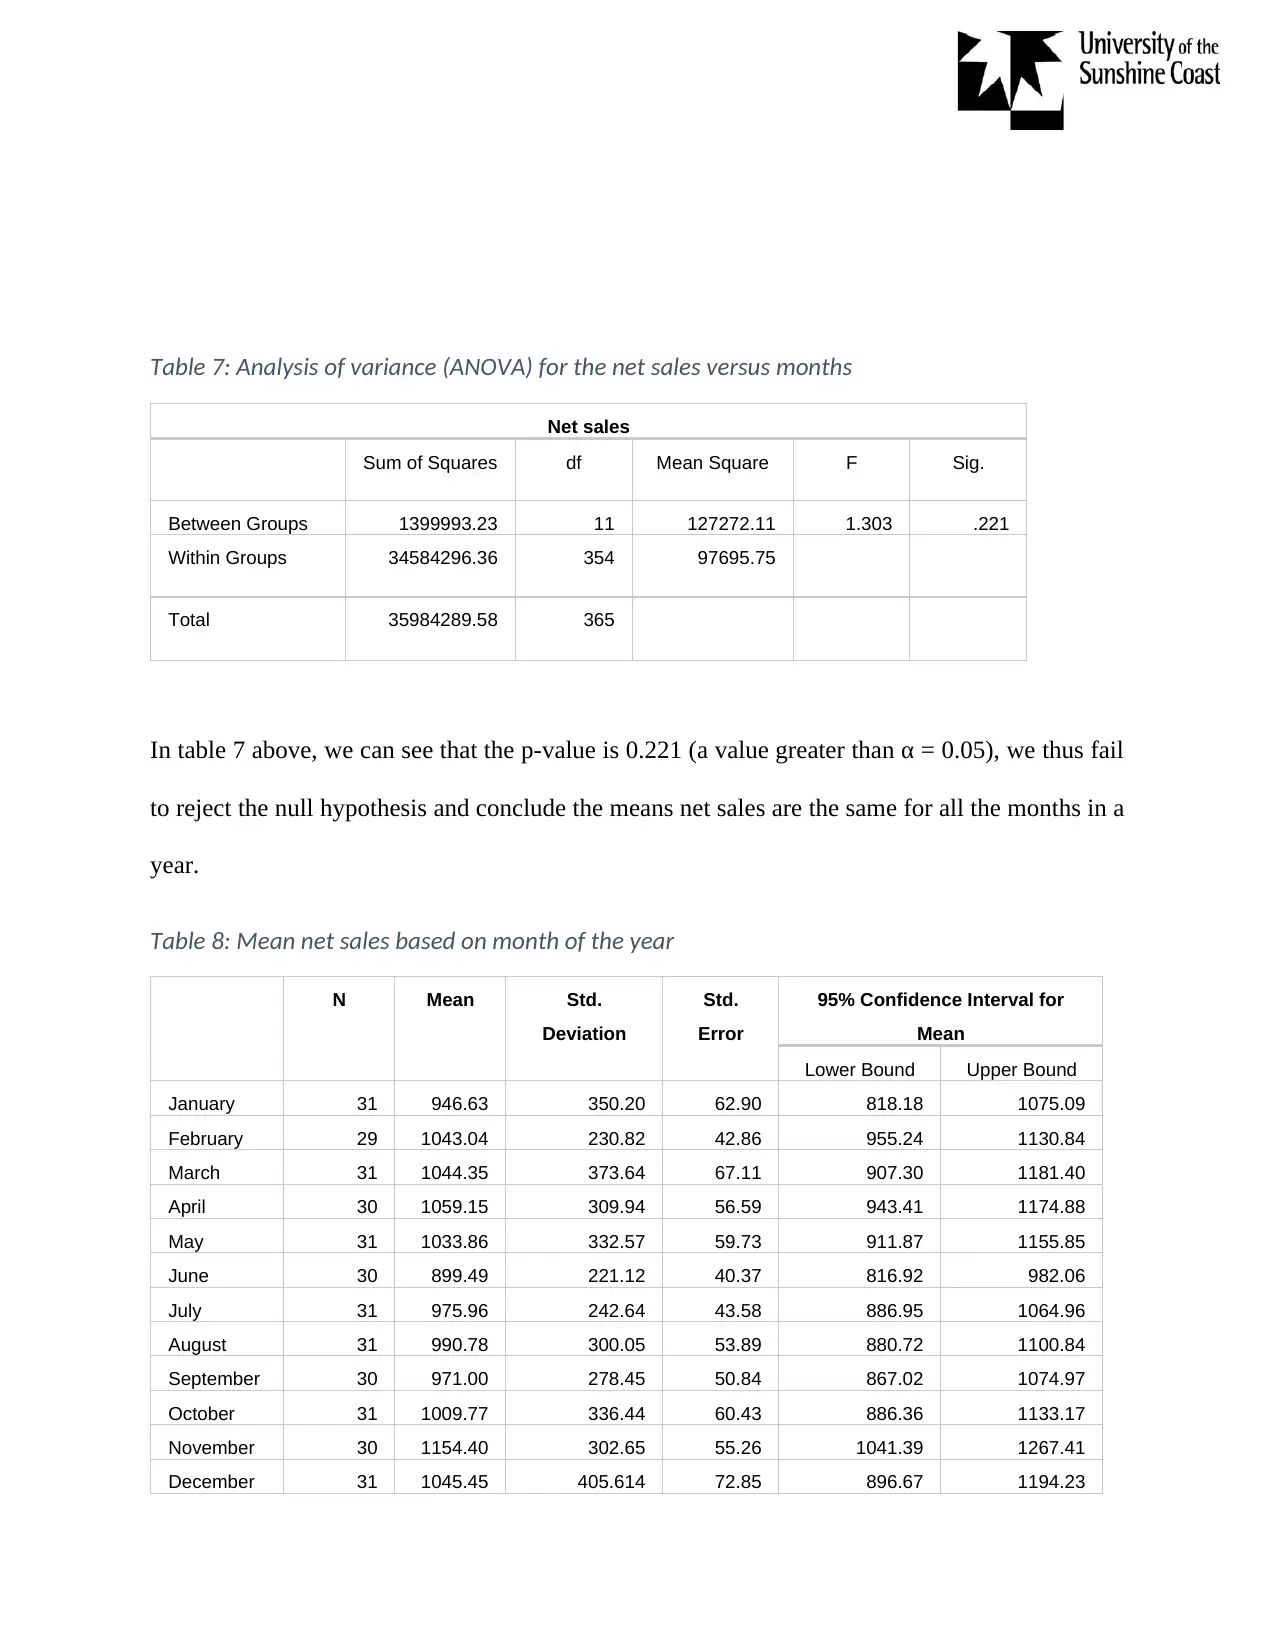
Table 7: Analysis of variance (ANOVA) for the net sales versus months
Net sales
Sum of Squares df Mean Square F Sig.
Between Groups 1399993.23 11 127272.11 1.303 .221
Within Groups 34584296.36 354 97695.75
Total 35984289.58 365
In table 7 above, we can see that the p-value is 0.221 (a value greater than α = 0.05), we thus fail
to reject the null hypothesis and conclude the means net sales are the same for all the months in a
year.
Table 8: Mean net sales based on month of the year
N Mean Std.
Deviation
Std.
Error
95% Confidence Interval for
Mean
Lower Bound Upper Bound
January 31 946.63 350.20 62.90 818.18 1075.09
February 29 1043.04 230.82 42.86 955.24 1130.84
March 31 1044.35 373.64 67.11 907.30 1181.40
April 30 1059.15 309.94 56.59 943.41 1174.88
May 31 1033.86 332.57 59.73 911.87 1155.85
June 30 899.49 221.12 40.37 816.92 982.06
July 31 975.96 242.64 43.58 886.95 1064.96
August 31 990.78 300.05 53.89 880.72 1100.84
September 30 971.00 278.45 50.84 867.02 1074.97
October 31 1009.77 336.44 60.43 886.36 1133.17
November 30 1154.40 302.65 55.26 1041.39 1267.41
December 31 1045.45 405.614 72.85 896.67 1194.23
⊘ This is a preview!⊘
Do you want full access?
Subscribe today to unlock all pages.
Trusted by 1+ million students worldwide
1 out of 17
Related Documents


Your All-in-One AI-Powered Toolkit for Academic Success.
+13062052269
info@desklib.com
Available 24*7 on WhatsApp / Email
![[object Object]](/_next/static/media/star-bottom.7253800d.svg)
Unlock your academic potential
Copyright © 2020–2026 A2Z Services. All Rights Reserved. Developed and managed by ZUCOL.