Comprehensive Review: Principles of Business Analytics in Industry

Verified

Added on  2023/06/03

|15
|2703
|473
Report
AI Summary
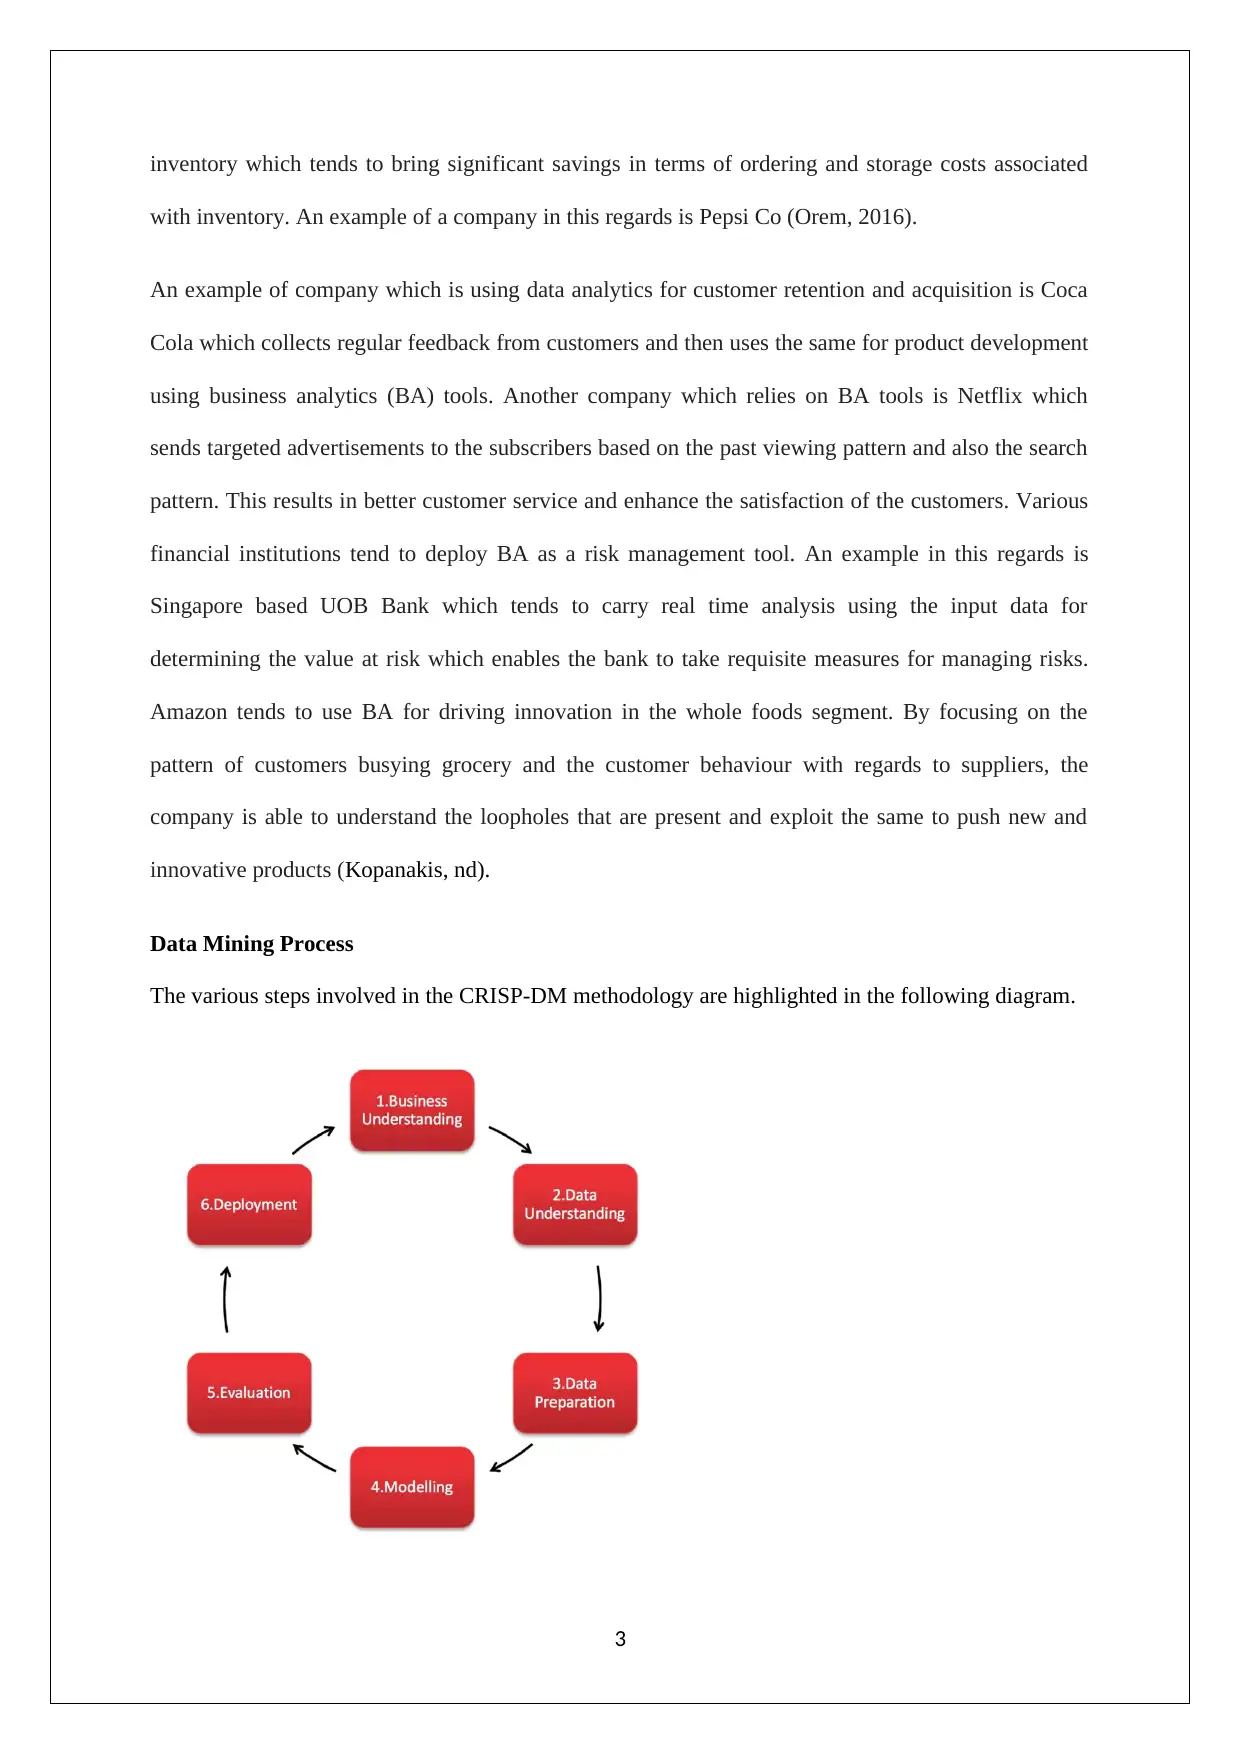
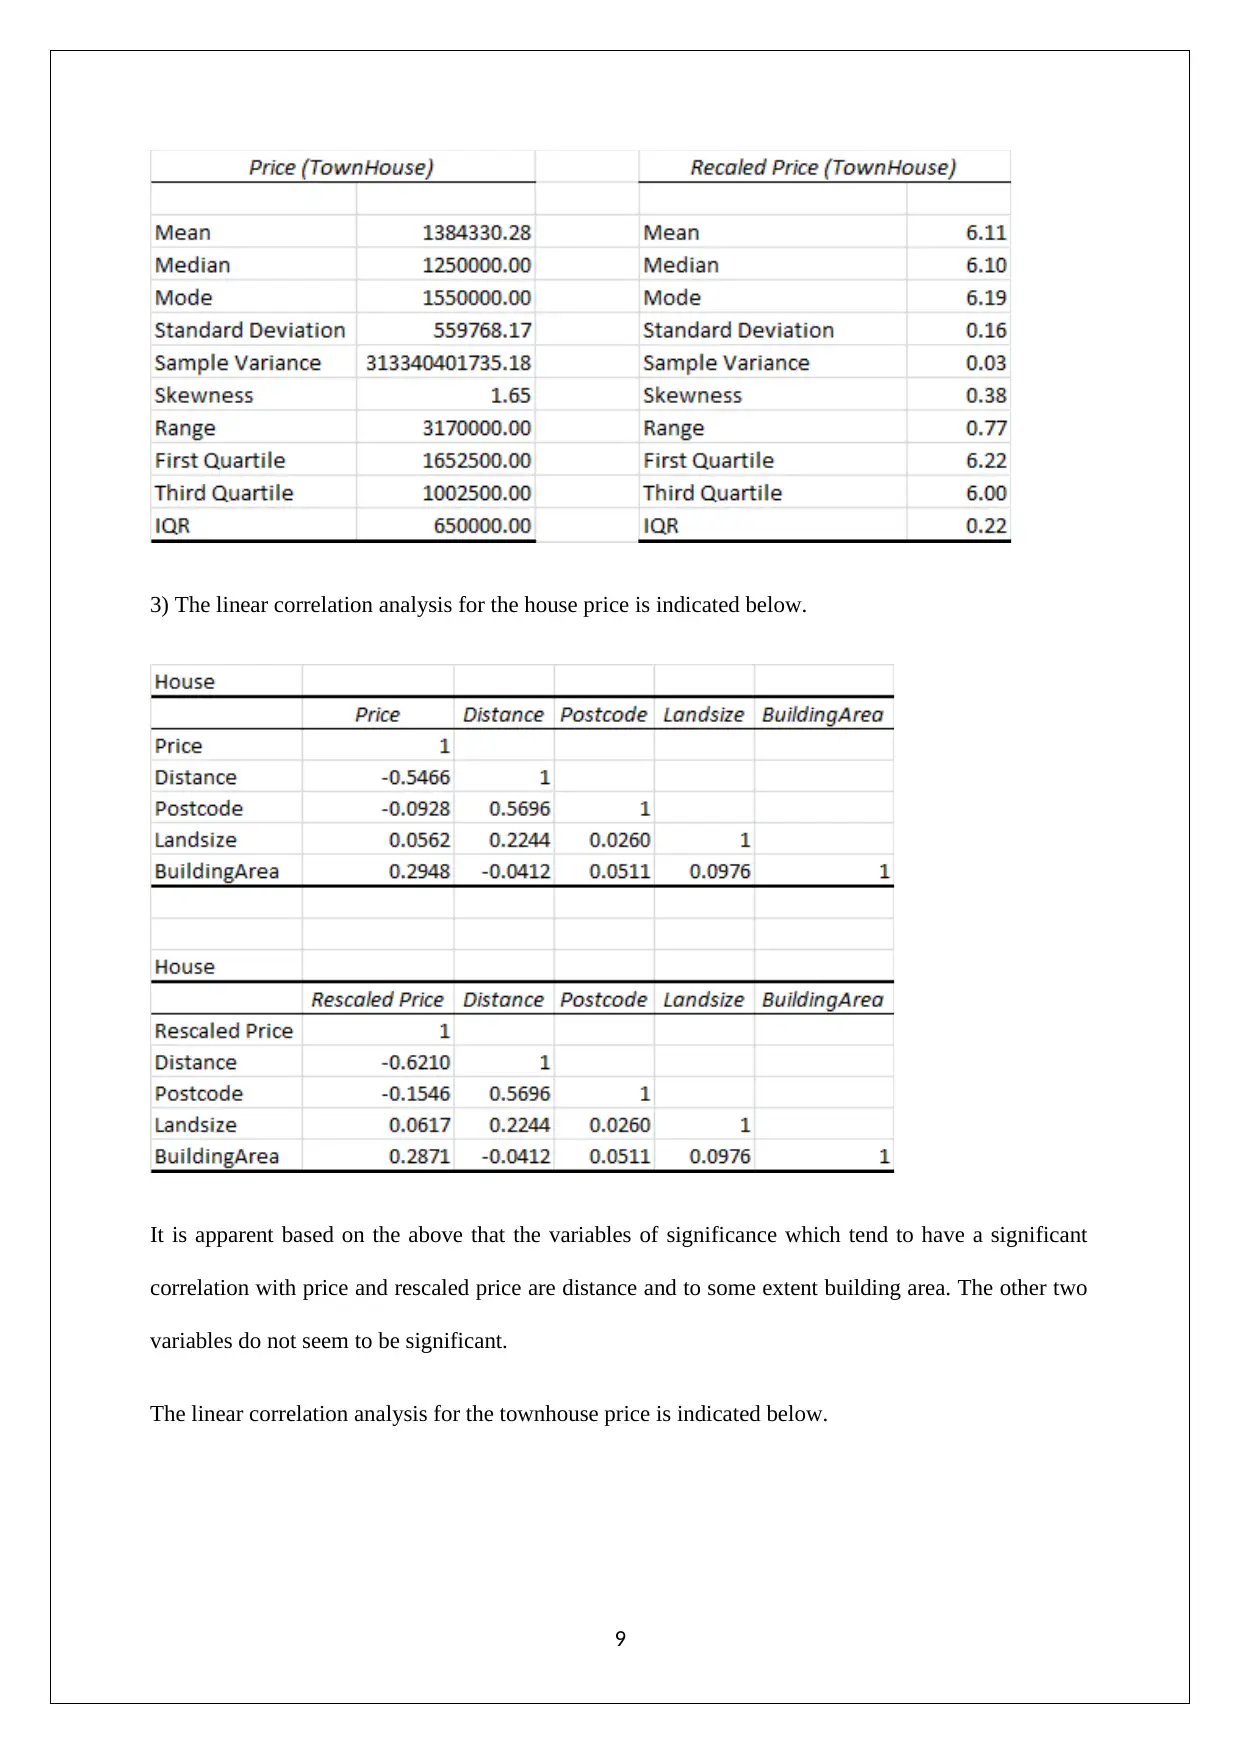
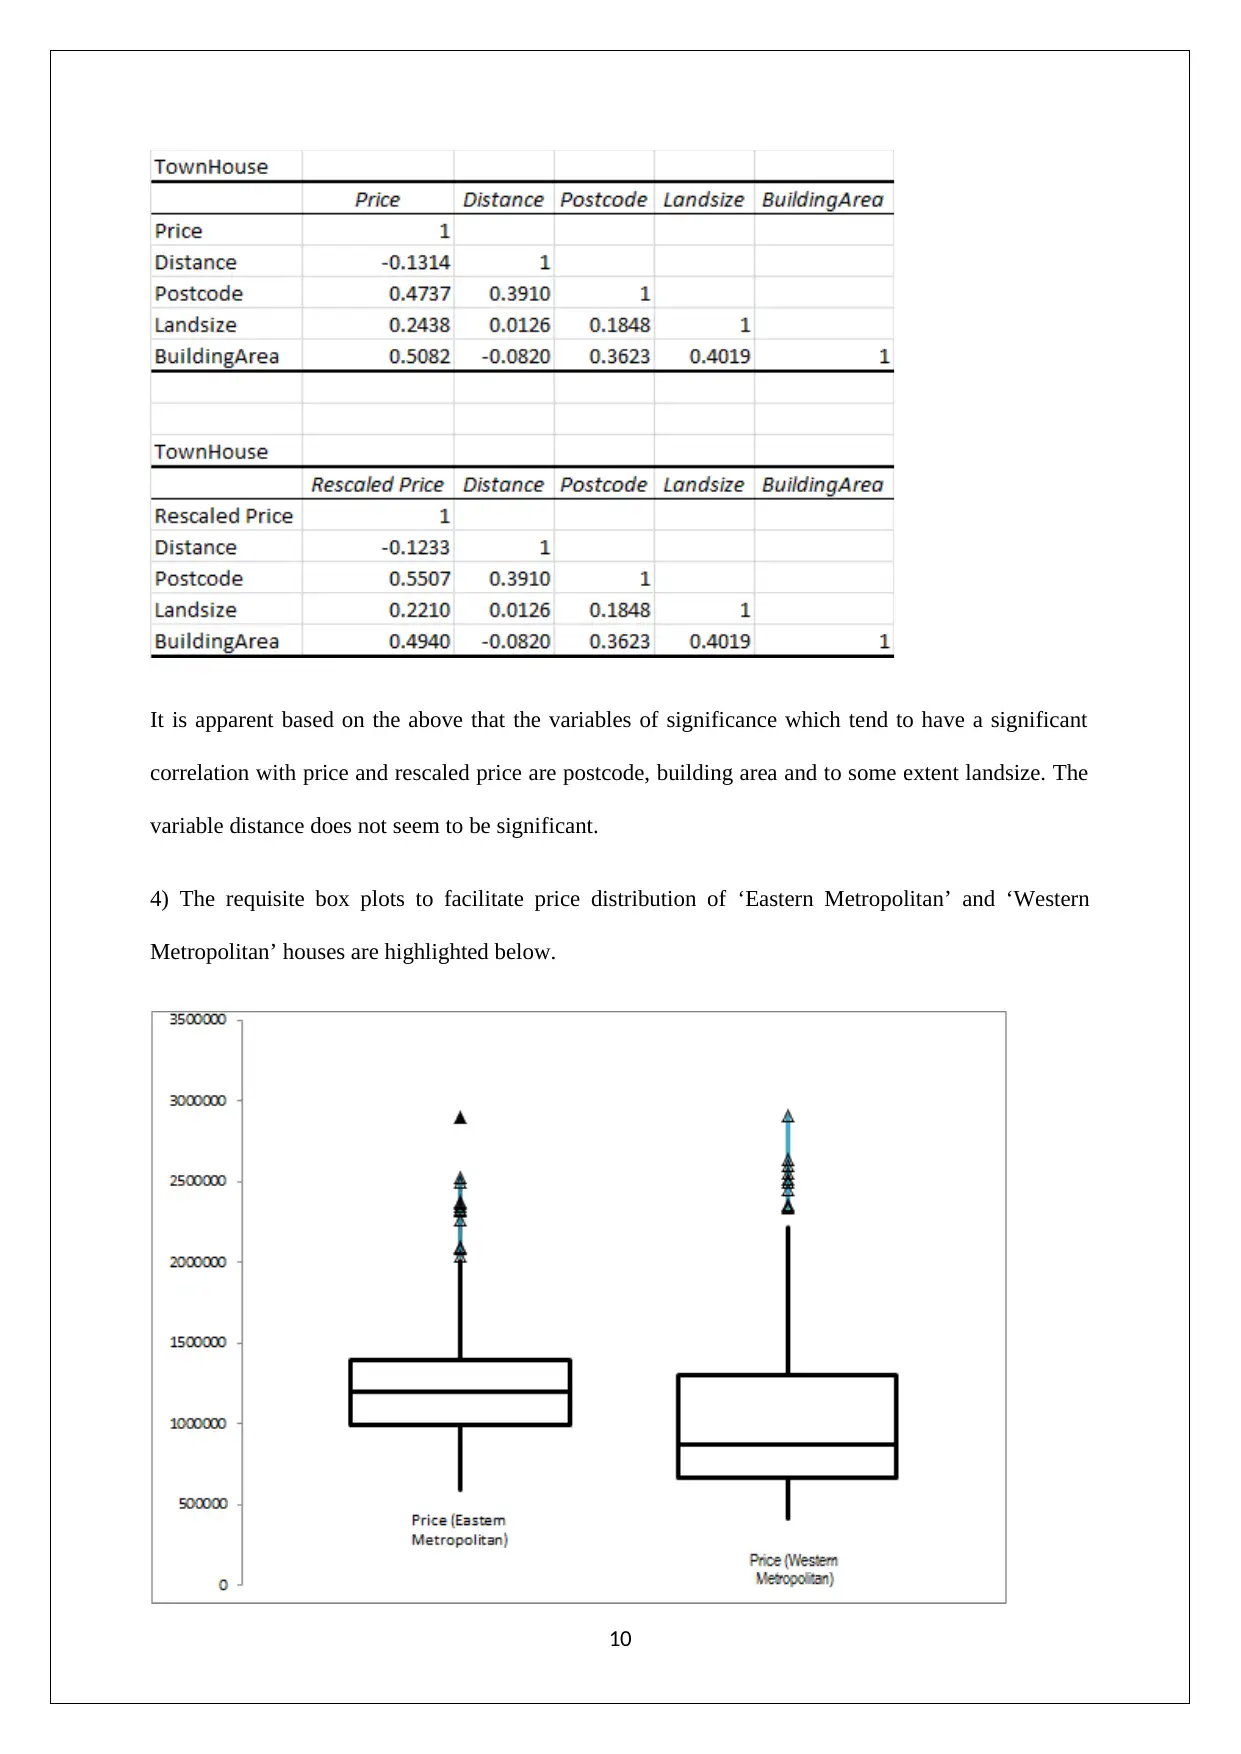
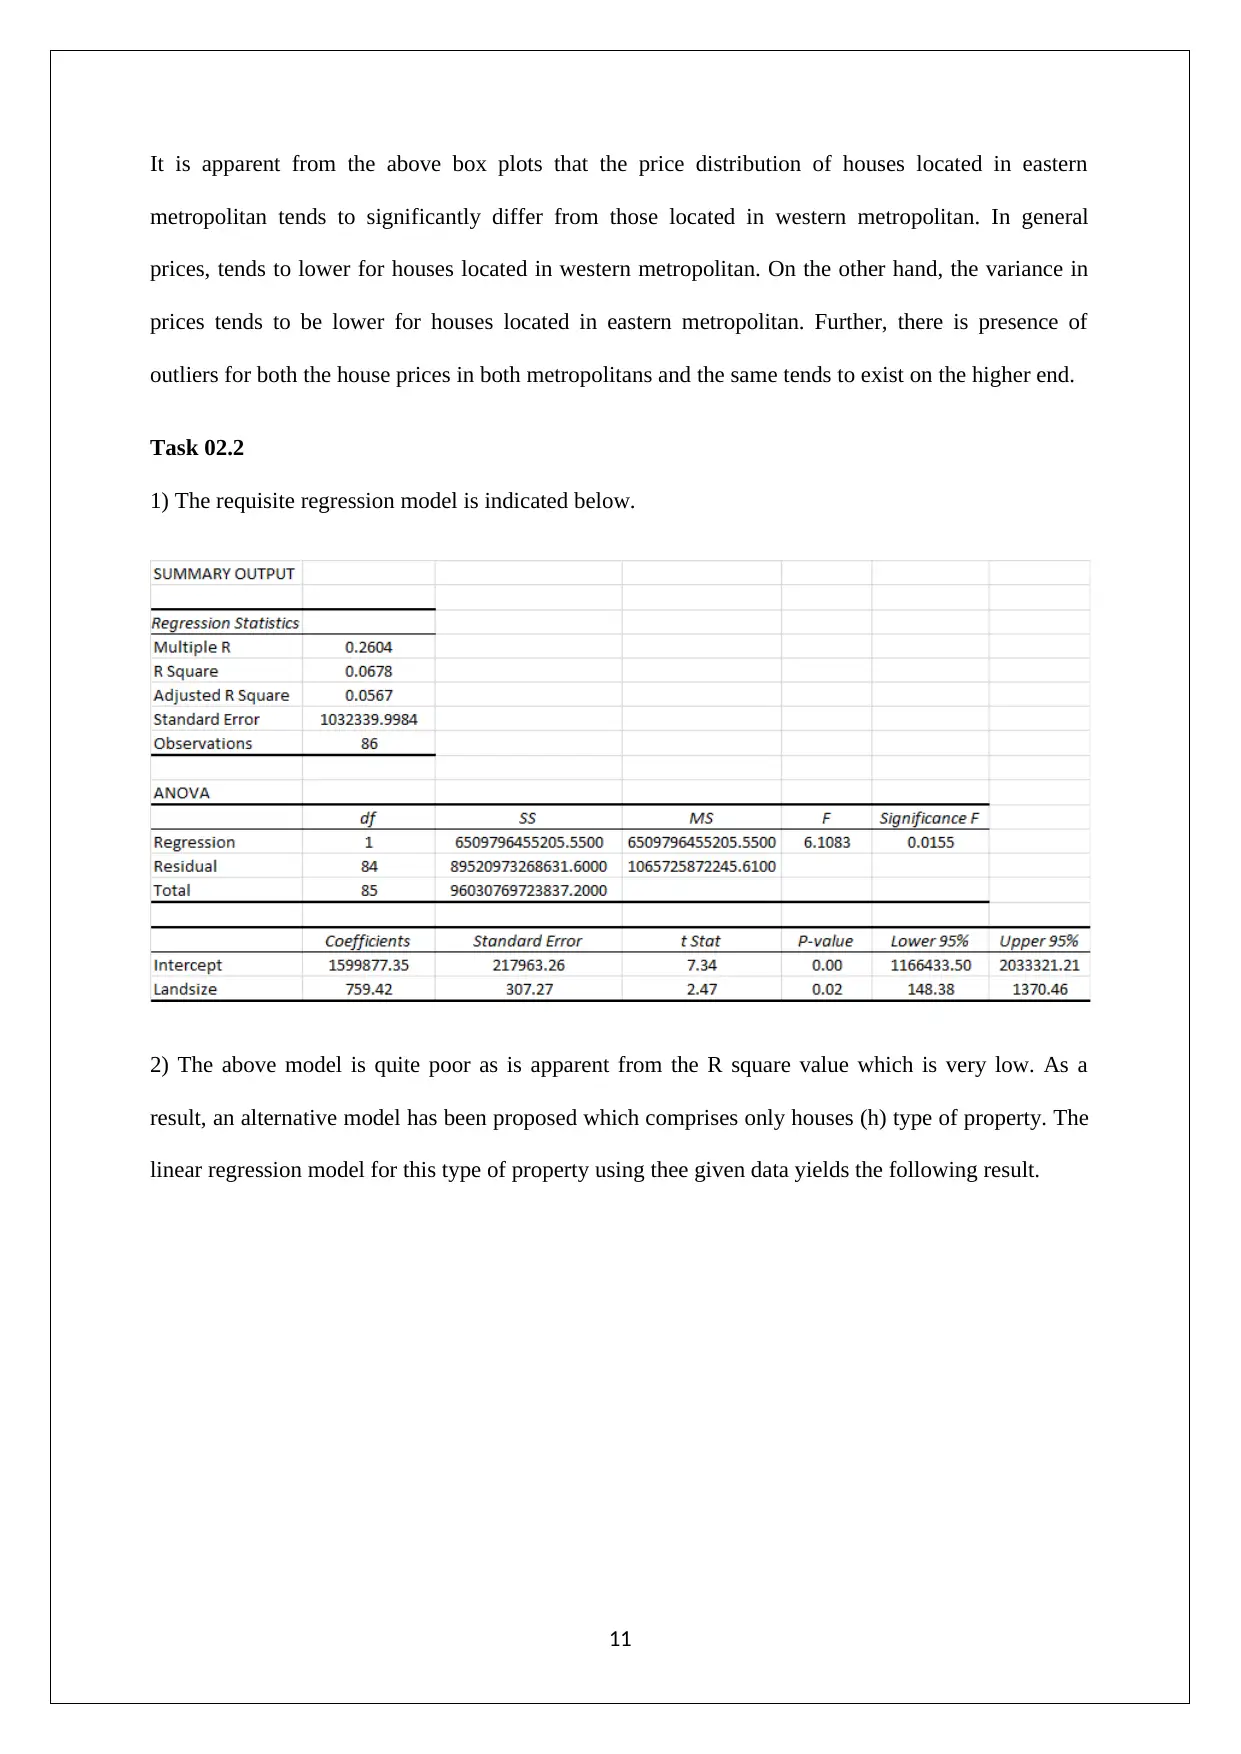
This report provides a comprehensive review of business analytics principles and their application across various industries. It defines business analytics, explores the analytics ecosystem (descriptive, predictive, prescriptive, and exploratory analytics), and illustrates their adoption in key business functions. The report also details the data mining process (CRISP-DM) and the challenges of implementing data mining and business analytics in agile business environments. Furthermore, it differentiates between business intelligence and business analytics, highlighting the challenges of achieving analytic leadership and culture in practice. The second task focuses on real estate data analysis in the Melbourne market, utilizing descriptive statistics to generate insights into the booming real estate market, specifically for Domain sights. The analysis includes histograms, descriptive statistics, correlation analysis, and box plots to understand price distributions and influential factors for houses and townhouses, concluding that different property types are influenced by varying factors, which is supported by regression analysis.
Document Page
Principles of Business Analytics
STUDENT ID:
[Pick the date]
tabler-icon-diamond-filled.svg

Paraphrase This Document

Need a fresh take? Get an instant paraphrase of this document with our AI Paraphraser
Document Page
TABLE OF CONTENTS
Task 01..................................................................................................................................................1
Introduction.......................................................................................................................................1
Usage of Business Analytics..............................................................................................................2
Data Mining Process..........................................................................................................................3
Comparison with Business Intelligence & Challenges......................................................................4
Conclusion.........................................................................................................................................5
Task 02..................................................................................................................................................5
Introduction.......................................................................................................................................5
Task 2.01...........................................................................................................................................6
Task 02.2.........................................................................................................................................10
Task 02.3 (Conclusion)....................................................................................................................12
References...........................................................................................................................................13
1
Document Page
Task 01
Introduction
Business analytics may be defined as the underlying technologies, skills and practices meant for past
business performance investigation coupled with exploration using iterative process with the objective
of gaining insight with regards to future performance of business and aid in planning process. It is
noteworthy that while business analytics does refer to past performance but it is primarily with the
objective of gaining understanding of future business performance. This process requires extensive
use of statistical techniques which include both predictive and exploratory modelling. The objective
of this report is to highlight the highlight the utility of business analytics in various fields,
distinguishing it from business intelligence and highlighting the underlying challenges involved in
using both data mining and business analytics.
Usage of Business Analytics
Business analytics has four main types of tools namely descriptive, predictive, prescriptive and
exploratory analytics. Descriptive analytics tends to aim at gaining insight with regards to historical
data and thereby aims to summarise the historical data in order to derive key learning. The focus of
the predictive analytics is to deploy statistical tools related to predictive modelling so as to derive
future predictions. Prescriptive analytics as the name suggests tends to deploy tools such as
simulations and optimisation techniques in order to outline the best possible decision. Exploratory
analytics tends to focus on exploring using various models so as to enhance understanding which can
be further used.
A particular usage of predictive analytics is being made by online retailers to identify the potential site
path which is more likely to lead to sale or abandoning of cart. The customer navigation data is used
in this regards. Descriptive analytics tool are quite useful in analysing stock behaviour by referring to
the empirical performance of the stock. Besides, in order to decide on the product price, prescriptive
analytics tools are used using various market variables. A key application of business analytics may
be observed in enhancing supply chain efficiency by managing inventory so as to avoid excess
2
Document Page
inventory which tends to bring significant savings in terms of ordering and storage costs associated
with inventory. An example of a company in this regards is Pepsi Co (Orem, 2016).
An example of company which is using data analytics for customer retention and acquisition is Coca
Cola which collects regular feedback from customers and then uses the same for product development
using business analytics (BA) tools. Another company which relies on BA tools is Netflix which
sends targeted advertisements to the subscribers based on the past viewing pattern and also the search
pattern. This results in better customer service and enhance the satisfaction of the customers. Various
financial institutions tend to deploy BA as a risk management tool. An example in this regards is
Singapore based UOB Bank which tends to carry real time analysis using the input data for
determining the value at risk which enables the bank to take requisite measures for managing risks.
Amazon tends to use BA for driving innovation in the whole foods segment. By focusing on the
pattern of customers busying grocery and the customer behaviour with regards to suppliers, the
company is able to understand the loopholes that are present and exploit the same to push new and
innovative products (Kopanakis, nd).
Data Mining Process
The various steps involved in the CRISP-DM methodology are highlighted in the following diagram.
3
tabler-icon-diamond-filled.svg

Paraphrase This Document

Need a fresh take? Get an instant paraphrase of this document with our AI Paraphraser
Document Page
The first step of the process is to understand the business objectives and also pay attention to the
various constraints and also key success factors that could impact outcome. Further, the current
situation is analysed coupled with determination of data mining goals which leads to project plan.
The second step is to obtain requisite data, describe and explore the same along with verification of
data quality. The third step involves preparation of data which involves processes such as cleaning of
data, construction and integration of data. The fourth step relates to modelling whereby a suitable
modelling technique is selected after considering the underlying assumptions and if the available data
tends to satisfy the same. A test design is generated which is used to build the model which is tested
to check the robustness and suitability. The fifth step relates to evaluation of the results from the data
mining models and also a review is conducted before deployment. Once the evaluation is done and
satisfactory results are obtained, the last step of deployment is carried out. Here, maintenance and
monitoring are crucial functions so as to ensure that desired results are produced and prompt
corrective actions are taken if required (SmartVision, nd).
Comparison with Business Intelligence & Challenges
The key difference between BA and Business Intelligence (BI) is that the former is more focused on
future prediction unlike the latter which is more focused on using the data for taking decisions in the
present. Further, it can also be stated that the business intelligence is a part of BA especially
considering the descriptive and exploratory tools which belong to the regime of business intelligence
(Roth, 2017). While both tools tend to rely on the past data analysis and statistical analysis but the
array of tools is more wider for BA as compared to Business Intelligence which should not be
surprising considering the forward looking focus of the BA which is more complex as compared to
the environment for BI (Adair, nd).
It is imperative that analytic leadership needs to be present in order to exploit the true potential of BA.
One of the key challenges is to garner support from the top management who might be averse of a
paradigm shift to a whole set of BA tools and relying on the same to make critical decisions since this
would be fundamentally different from the traditional manner which the board may be used to.
Another key challenge is from the employees considering the fact that they would need to learn new
4
Document Page
skills in order to imbibe the BA tools. Besides, adequate training needs to be provided to the managers
who would use these tools to make decisions so that the information provided can be used for
enhanced understanding and decision making. An additional challenge could be the organisational
culture especially in a traditional business which does not operate in an agile environment since the
resistance from employees for the paradigm shift could be significant (Rogers, 2016).
Conclusion
Based on the above analysis, it is apparent that BA tools tend to find an extensive application in a host
of industries and across verticals. Further, considering the rampant use, it is also apparent that BA
tools are used for building competitive advantage by various firms. A crucial process of BA is data
mining considering the importance of analysing data for deriving crucial information. The process of
data mining involves multiple steps which have been indicated. Further, the difference between BA
and BI has been highlighted especially with reference to extensive use of predictive and prescriptive
tools in BA which is not the case with BI. Also, there are various challenges involved with regards to
building an analytical leadership and culture required for imbibing BA.
5
Document Page
Task 02
Introduction
The objective of this report is to analyse the real estate data with regards to the Melbourne market
using descriptive statistics tools in order to generate insights in relation to the booming real estate
market. This can be used by Domain sights with regards to the real estate buyer advocacy which is the
core focus of the firm.
Task 2.01
1) The requisite histograms are indicated below.
It is apparent that the above price distribution of house has a positive skew and is not symmetric in
shape. As a result, the given price distribution is non-normal. In order to improve the distribution the
log scale is used and the revised histogram is indicated as follows.
6
tabler-icon-diamond-filled.svg

Paraphrase This Document

Need a fresh take? Get an instant paraphrase of this document with our AI Paraphraser
Document Page
The above distribution is significantly better owing to significant reduction in the skew and greater
symmetric shape of the histogram which is more similar to a bell curve.
It is apparent that the above price distribution of townhouse has a positive skew and is not symmetric
in shape. As a result, the given price distribution is non-normal. In order to improve the distribution
the log scale is used and the revised histogram is indicated as follows.
7
Document Page
The above distribution is significantly better owing to significant reduction in the skew and greater
symmetric shape of the histogram. However, the distribution still continues to be non- normal owing
to significant positive skew.
2) The key descriptive statistics are as highlighted below.
8
Document Page
3) The linear correlation analysis for the house price is indicated below.
It is apparent based on the above that the variables of significance which tend to have a significant
correlation with price and rescaled price are distance and to some extent building area. The other two
variables do not seem to be significant.
The linear correlation analysis for the townhouse price is indicated below.
9
tabler-icon-diamond-filled.svg

Paraphrase This Document

Need a fresh take? Get an instant paraphrase of this document with our AI Paraphraser
Document Page
It is apparent based on the above that the variables of significance which tend to have a significant
correlation with price and rescaled price are postcode, building area and to some extent landsize. The
variable distance does not seem to be significant.
4) The requisite box plots to facilitate price distribution of ‘Eastern Metropolitan’ and ‘Western
Metropolitan’ houses are highlighted below.
10
Document Page
It is apparent from the above box plots that the price distribution of houses located in eastern
metropolitan tends to significantly differ from those located in western metropolitan. In general
prices, tends to lower for houses located in western metropolitan. On the other hand, the variance in
prices tends to be lower for houses located in eastern metropolitan. Further, there is presence of
outliers for both the house prices in both metropolitans and the same tends to exist on the higher end.
Task 02.2
1) The requisite regression model is indicated below.
2) The above model is quite poor as is apparent from the R square value which is very low. As a
result, an alternative model has been proposed which comprises only houses (h) type of property. The
linear regression model for this type of property using thee given data yields the following result.
11
chevron_up_icon
1 out of 15
circle_padding
hide_on_mobile
zoom_out_icon
[object Object]