Business Analytics: Logistics Organization Process and System Analysis
VerifiedAdded on 2023/06/05
|20
|3748
|442
Report
AI Summary
This business analytics report provides a comprehensive analysis of a logistics organization, focusing on its processes and systems. The report begins with an industry scenario and identifies key business problems, followed by a SWOT analysis to assess the organization's strengths, weaknesses, opportunities, and threats. It includes an organizational chart and stakeholder map to illustrate relationships and responsibilities. Context and business use case diagrams are presented to define the system's boundaries and functionalities, while system use case diagrams detail external requirements and benefits. The report further delves into use case descriptions, class and object diagrams, and state machine diagrams to model system behavior. An as-is diagram illustrates the current state, followed by activity classification and evaluation, cycle time efficiency analysis, and an issue register with proposed changes. Finally, a proposed to-be diagram using BPMN model visualizes the future state with process improvements. This detailed analysis aims to provide actionable insights for optimizing the logistics organization's operations.
Business Analytics
Paraphrase This Document
Need a fresh take? Get an instant paraphrase of this document with our AI Paraphraser
Table of Contents
1 Introduction.......................................................................................................................1
2 Part A.................................................................................................................................2
2.1 Industry Scenario and Business Problems..............................................................2
2.2 SWOT analysis...........................................................................................................3
2.3 Organization Chart and Stakeholder Map.............................................................4
2.4 Context Diagram.......................................................................................................5
2.5 Business Use case Diagrams.....................................................................................5
2.6 System Use case Diagrams........................................................................................6
3 Part B.................................................................................................................................7
3.1 Use case Description for all Systems........................................................................8
3.2 Class and Object Diagram........................................................................................9
3.3 State Machine Diagram..........................................................................................10
3.4 As- Is Diagram.........................................................................................................11
3.5 Activity Classification and Evaluation..................................................................13
3.6 Cycle time efficiency................................................................................................14
3.7 Issue Register and Proposed Changes...................................................................14
3.8 Proposed To-Be Diagram BPMN Model...............................................................15
4 Conclusion.......................................................................................................................17
References...............................................................................................................................18
1 Introduction
This project aims to create the business analysis report for a business case study. This
project includes the following requirements like business use cases, package diagram,
structure diagram, activity diagram, system use case diagrams, decision tables, state machine
diagram and class diagrams. These are will be analysed and discussed in detail.
1
2 Part A
2.1 Industry Scenario and Business Problems
This task is choose the one industry to perform the process by using the help desk office
that handles requests from the clients that are employees and various stake holders of a
company. Here, we are choosing the logistics organization process that performed by using
the help desk office. Logistics as a business results from the expanding unpredictability of
providing manufacturers with materials and transporting out products. Logistics organizations
for the most part represent considerable authority in the transportation, distribution, storing
and bundling of items. Manufacturing organizations frequently utilize outside associations to
execute logistics capacities. This enables producers to center around the center business of
Manufacturing. Manufacturing organizations regularly require some logistics machine to
work legitimately, yet they may outsource a considerable lot of the logistics capacities not
straightforwardly connected with manufacturing exercises.
This assignment intends to break down the Tesco PLC Company in light of the fact that
is the one of coordination’s association. This association is the British multinational market
chain. In Welwyn Garden city, United Kingdom, England and Hertfordshire, it's headquarter
is available. On the planet, it is positioned as the third greatest retailer because of its
advantages and it is likewise has packed away second greatest retailer position on the planet
for its pay. It is available in 12 countries among Europe and Asia. It offers the going with
things in nine interesting classes like Apparel, Bakery, Deli, Dairy, Fresh Produce, General
Merchandise, Grocery, Liquor, and Meat. It constructs the advantages by pushing in the
unwavering quality plot with two levels like Gold and Silver. The Tesco advance towards the
transforming into the UK greatest supermarket chain and it basically changed the country's
market business. It in like manner dispatches the club card point that is cardholders are can
assemble the one club card point for every one Europe they spend in the Tesco Store and
Website. This method is used to enables the association to assemble the data on purchase
direct of customers and utilize it to makes the changed offers and lead the concentrated on
support fights. This association must be contribute the client maintenance and diminishes the
advertising consumption in light of the fact that the present offers are does not lessens the
showcasing use.
2
⊘ This is a preview!⊘
Do you want full access?
Subscribe today to unlock all pages.
Trusted by 1+ million students worldwide
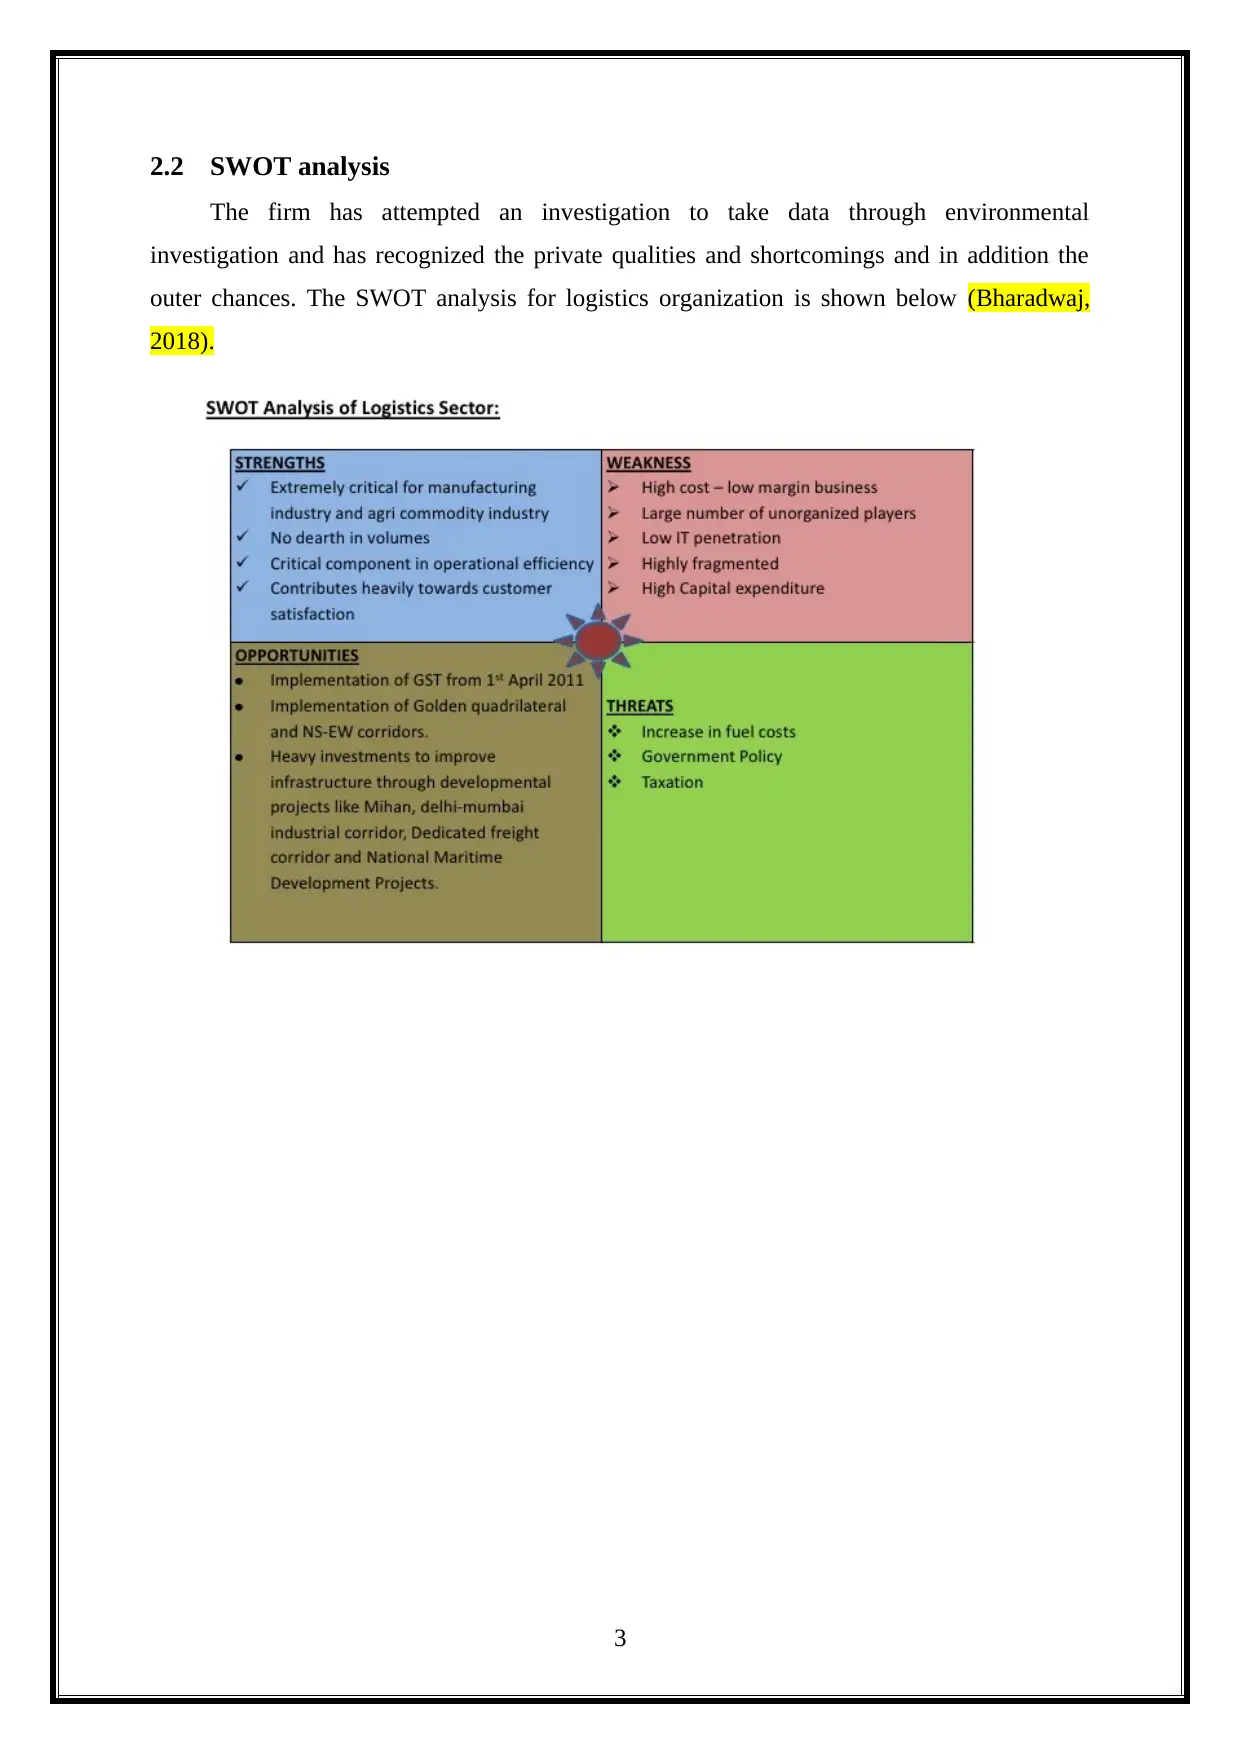
2.2 SWOT analysis
The firm has attempted an investigation to take data through environmental
investigation and has recognized the private qualities and shortcomings and in addition the
outer chances. The SWOT analysis for logistics organization is shown below (Bharadwaj,
2018).
3
The firm has attempted an investigation to take data through environmental
investigation and has recognized the private qualities and shortcomings and in addition the
outer chances. The SWOT analysis for logistics organization is shown below (Bharadwaj,
2018).
3
Paraphrase This Document
Need a fresh take? Get an instant paraphrase of this document with our AI Paraphraser
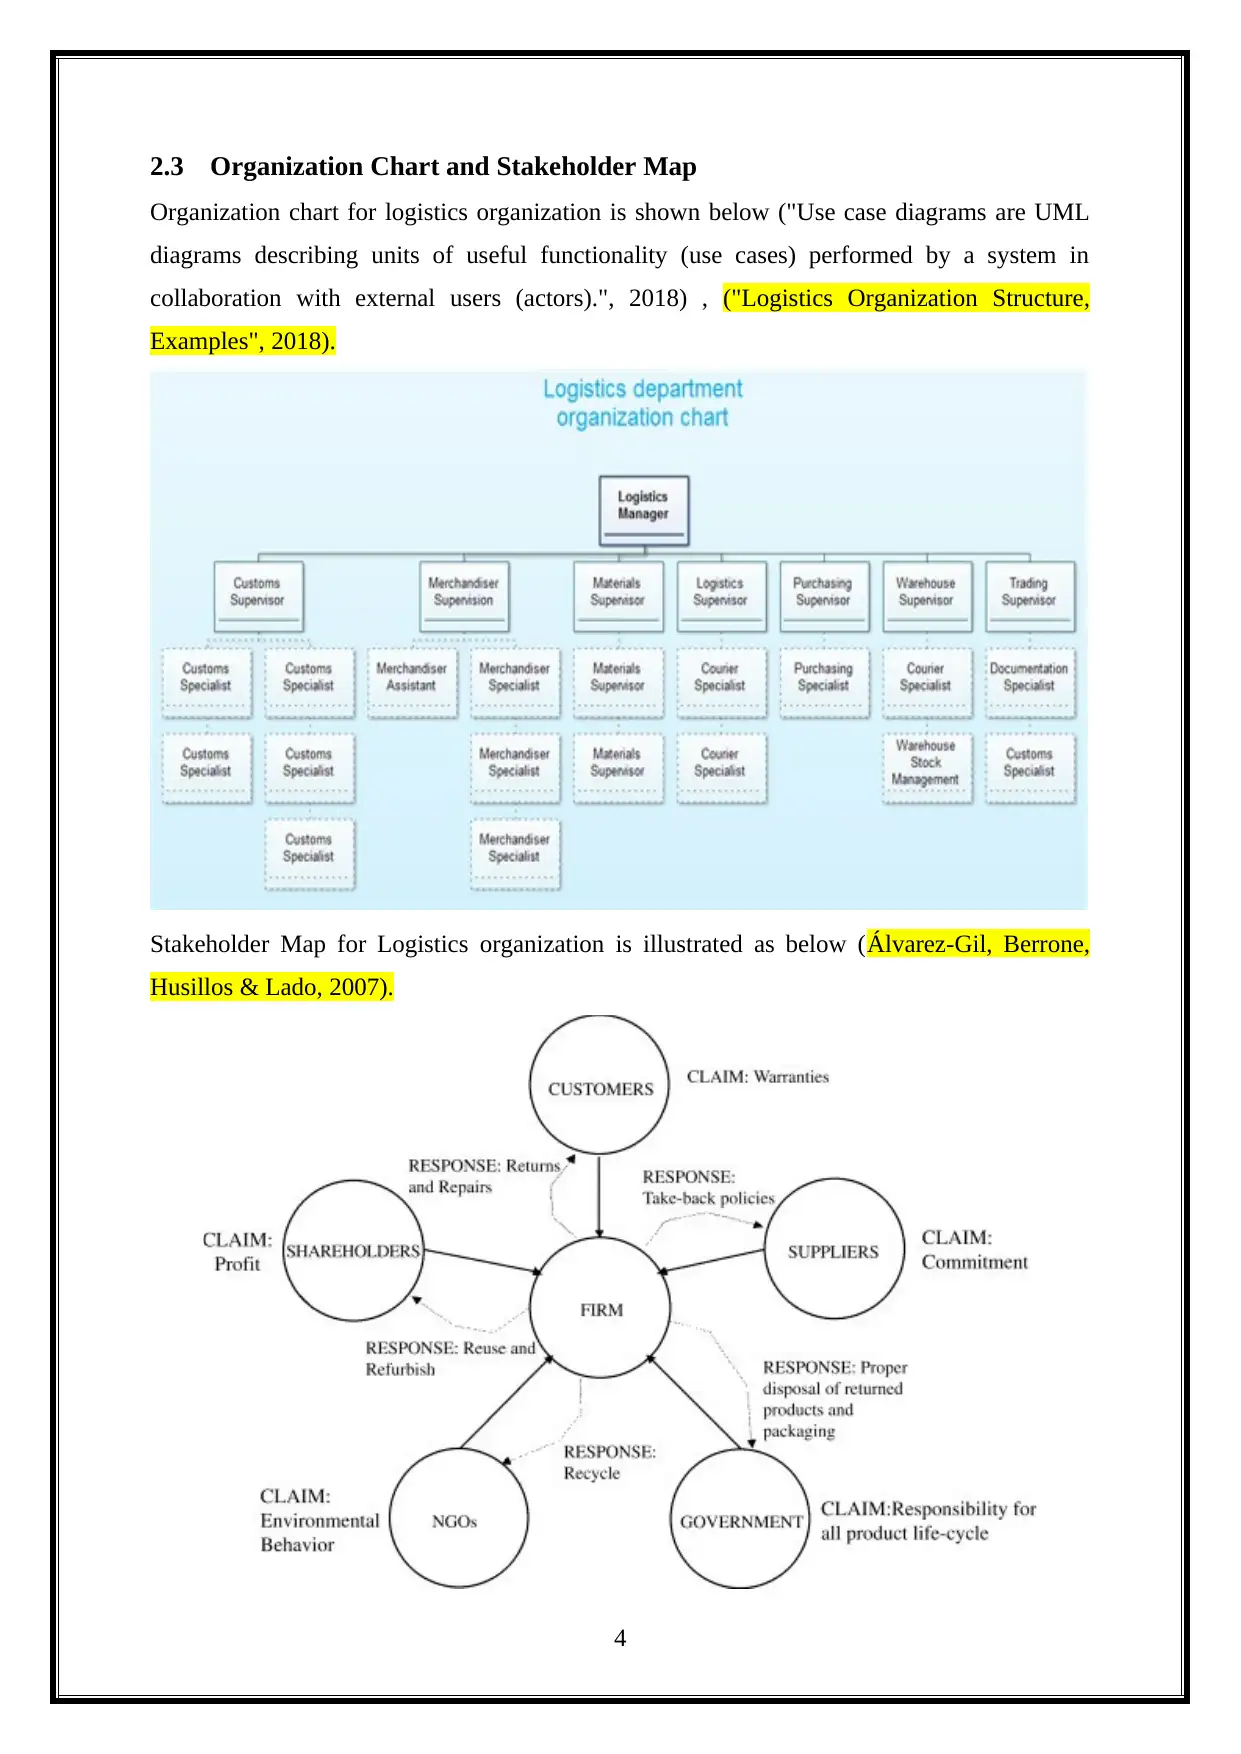
2.3 Organization Chart and Stakeholder Map
Organization chart for logistics organization is shown below ("Use case diagrams are UML
diagrams describing units of useful functionality (use cases) performed by a system in
collaboration with external users (actors).", 2018) , ("Logistics Organization Structure,
Examples", 2018).
Stakeholder Map for Logistics organization is illustrated as below (Álvarez-Gil, Berrone,
Husillos & Lado, 2007).
4
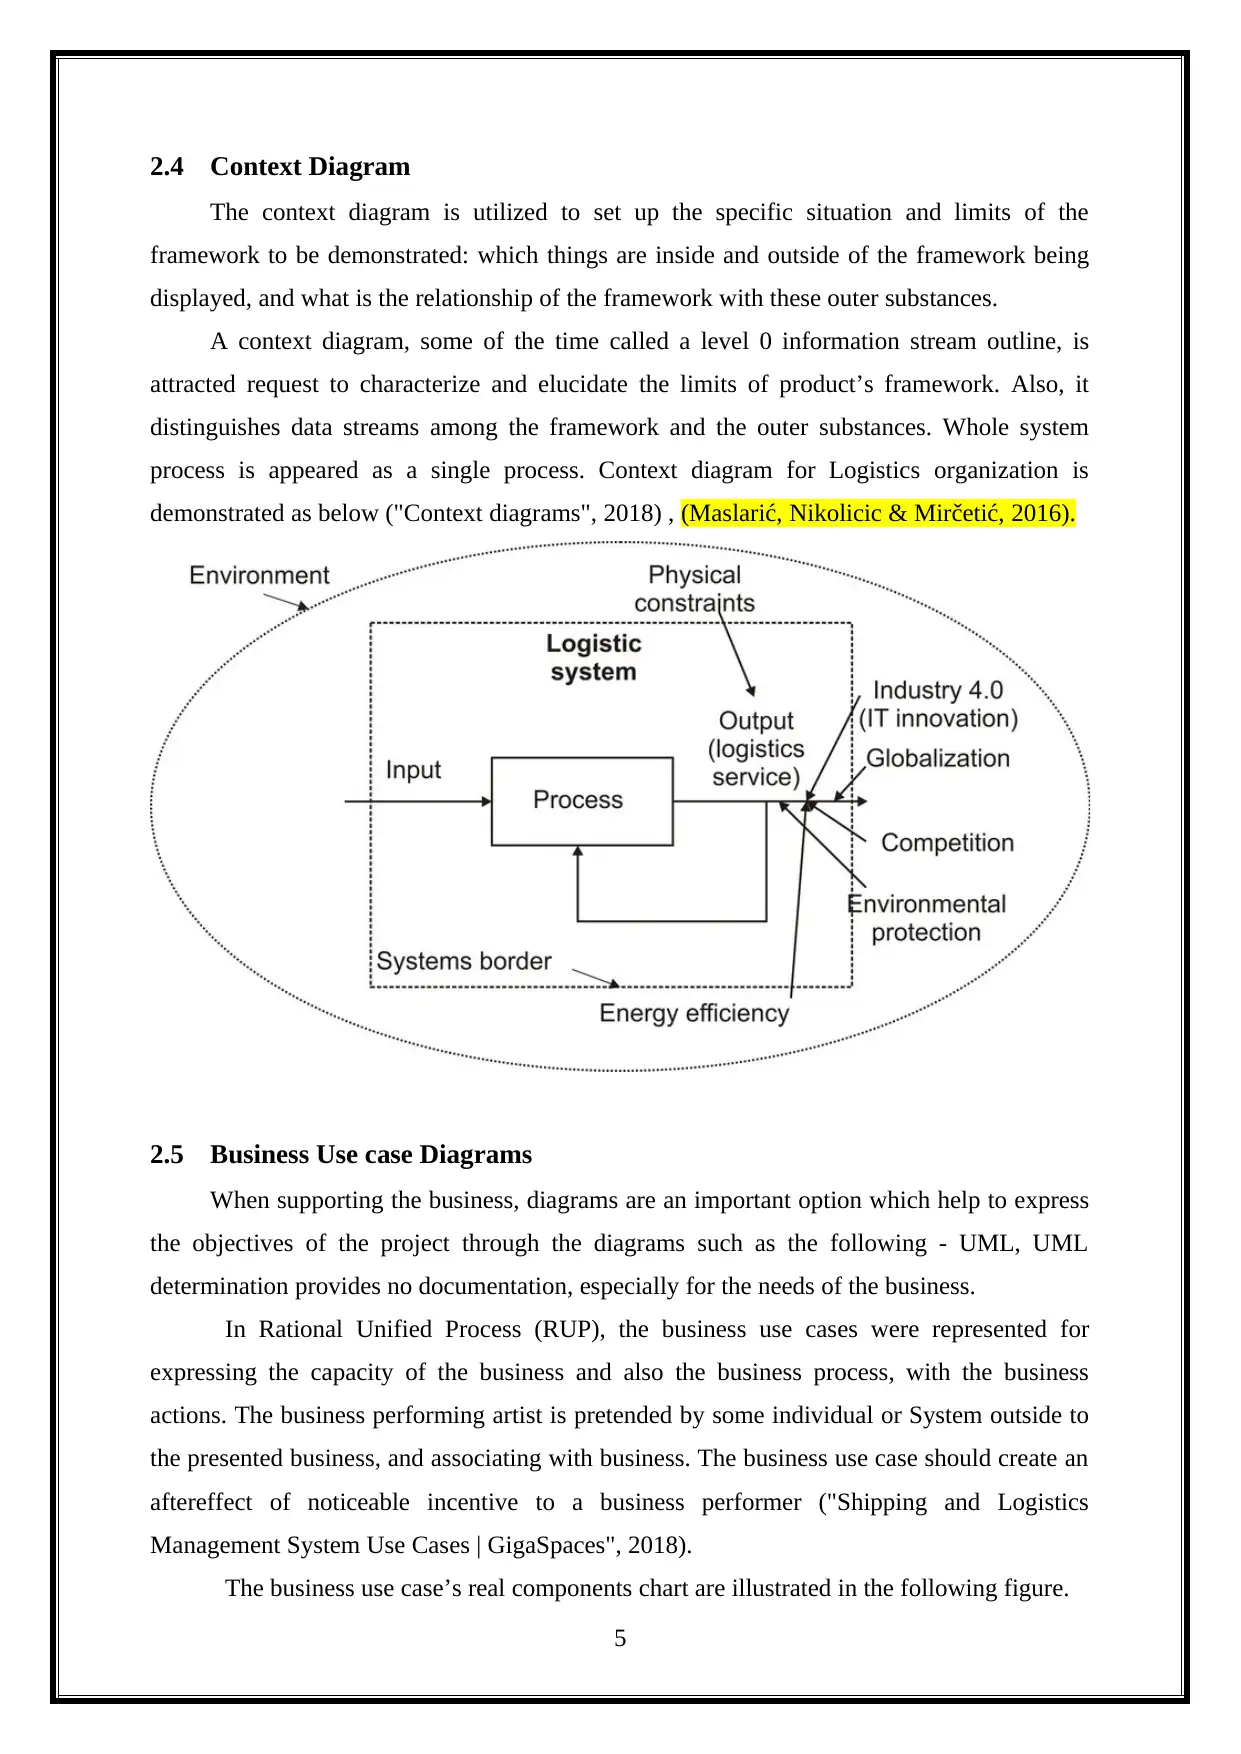
2.4 Context Diagram
The context diagram is utilized to set up the specific situation and limits of the
framework to be demonstrated: which things are inside and outside of the framework being
displayed, and what is the relationship of the framework with these outer substances.
A context diagram, some of the time called a level 0 information stream outline, is
attracted request to characterize and elucidate the limits of product’s framework. Also, it
distinguishes data streams among the framework and the outer substances. Whole system
process is appeared as a single process. Context diagram for Logistics organization is
demonstrated as below ("Context diagrams", 2018) , (Maslarić, Nikolicic & Mirčetić, 2016).
2.5 Business Use case Diagrams
When supporting the business, diagrams are an important option which help to express
the objectives of the project through the diagrams such as the following - UML, UML
determination provides no documentation, especially for the needs of the business.
In Rational Unified Process (RUP), the business use cases were represented for
expressing the capacity of the business and also the business process, with the business
actions. The business performing artist is pretended by some individual or System outside to
the presented business, and associating with business. The business use case should create an
aftereffect of noticeable incentive to a business performer ("Shipping and Logistics
Management System Use Cases | GigaSpaces", 2018).
The business use case’s real components chart are illustrated in the following figure.
5
⊘ This is a preview!⊘
Do you want full access?
Subscribe today to unlock all pages.
Trusted by 1+ million students worldwide
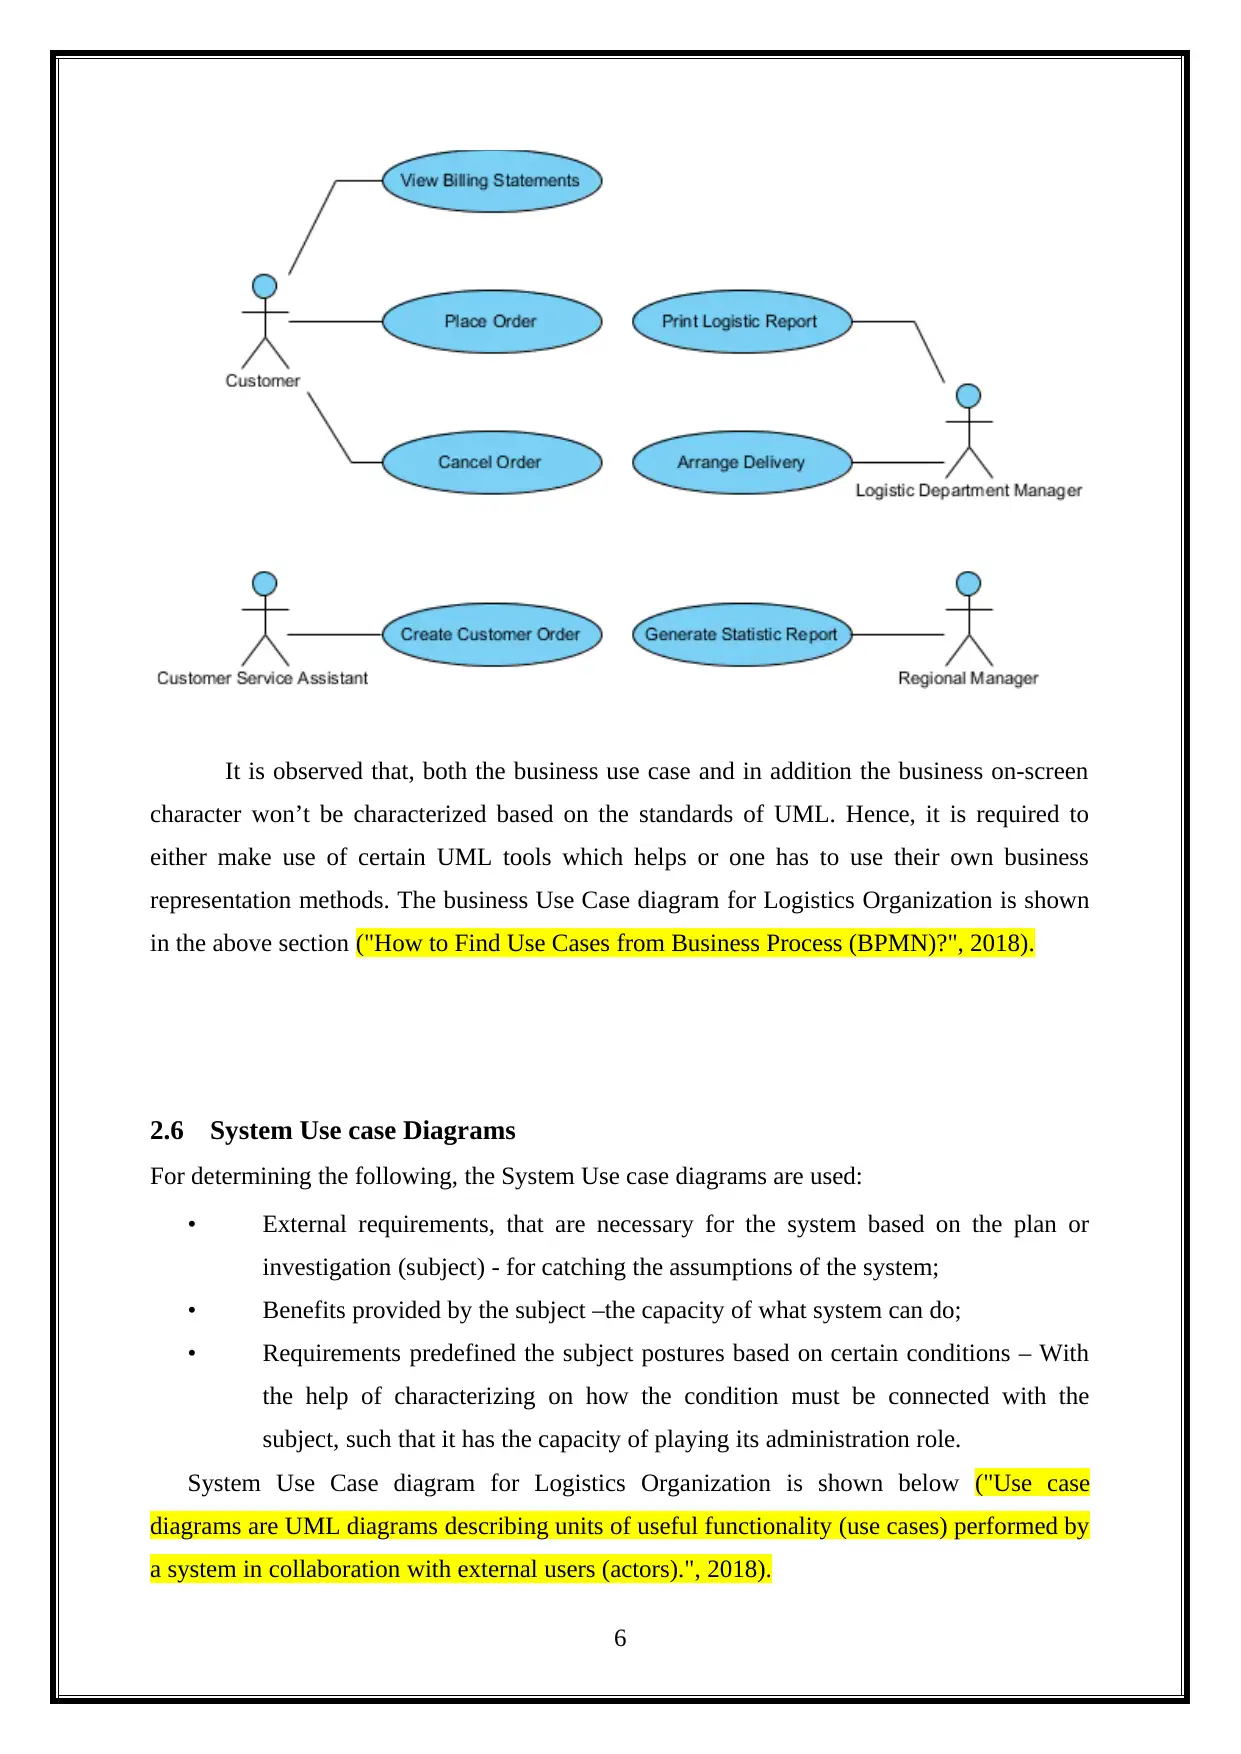
It is observed that, both the business use case and in addition the business on-screen
character won’t be characterized based on the standards of UML. Hence, it is required to
either make use of certain UML tools which helps or one has to use their own business
representation methods. The business Use Case diagram for Logistics Organization is shown
in the above section ("How to Find Use Cases from Business Process (BPMN)?", 2018).
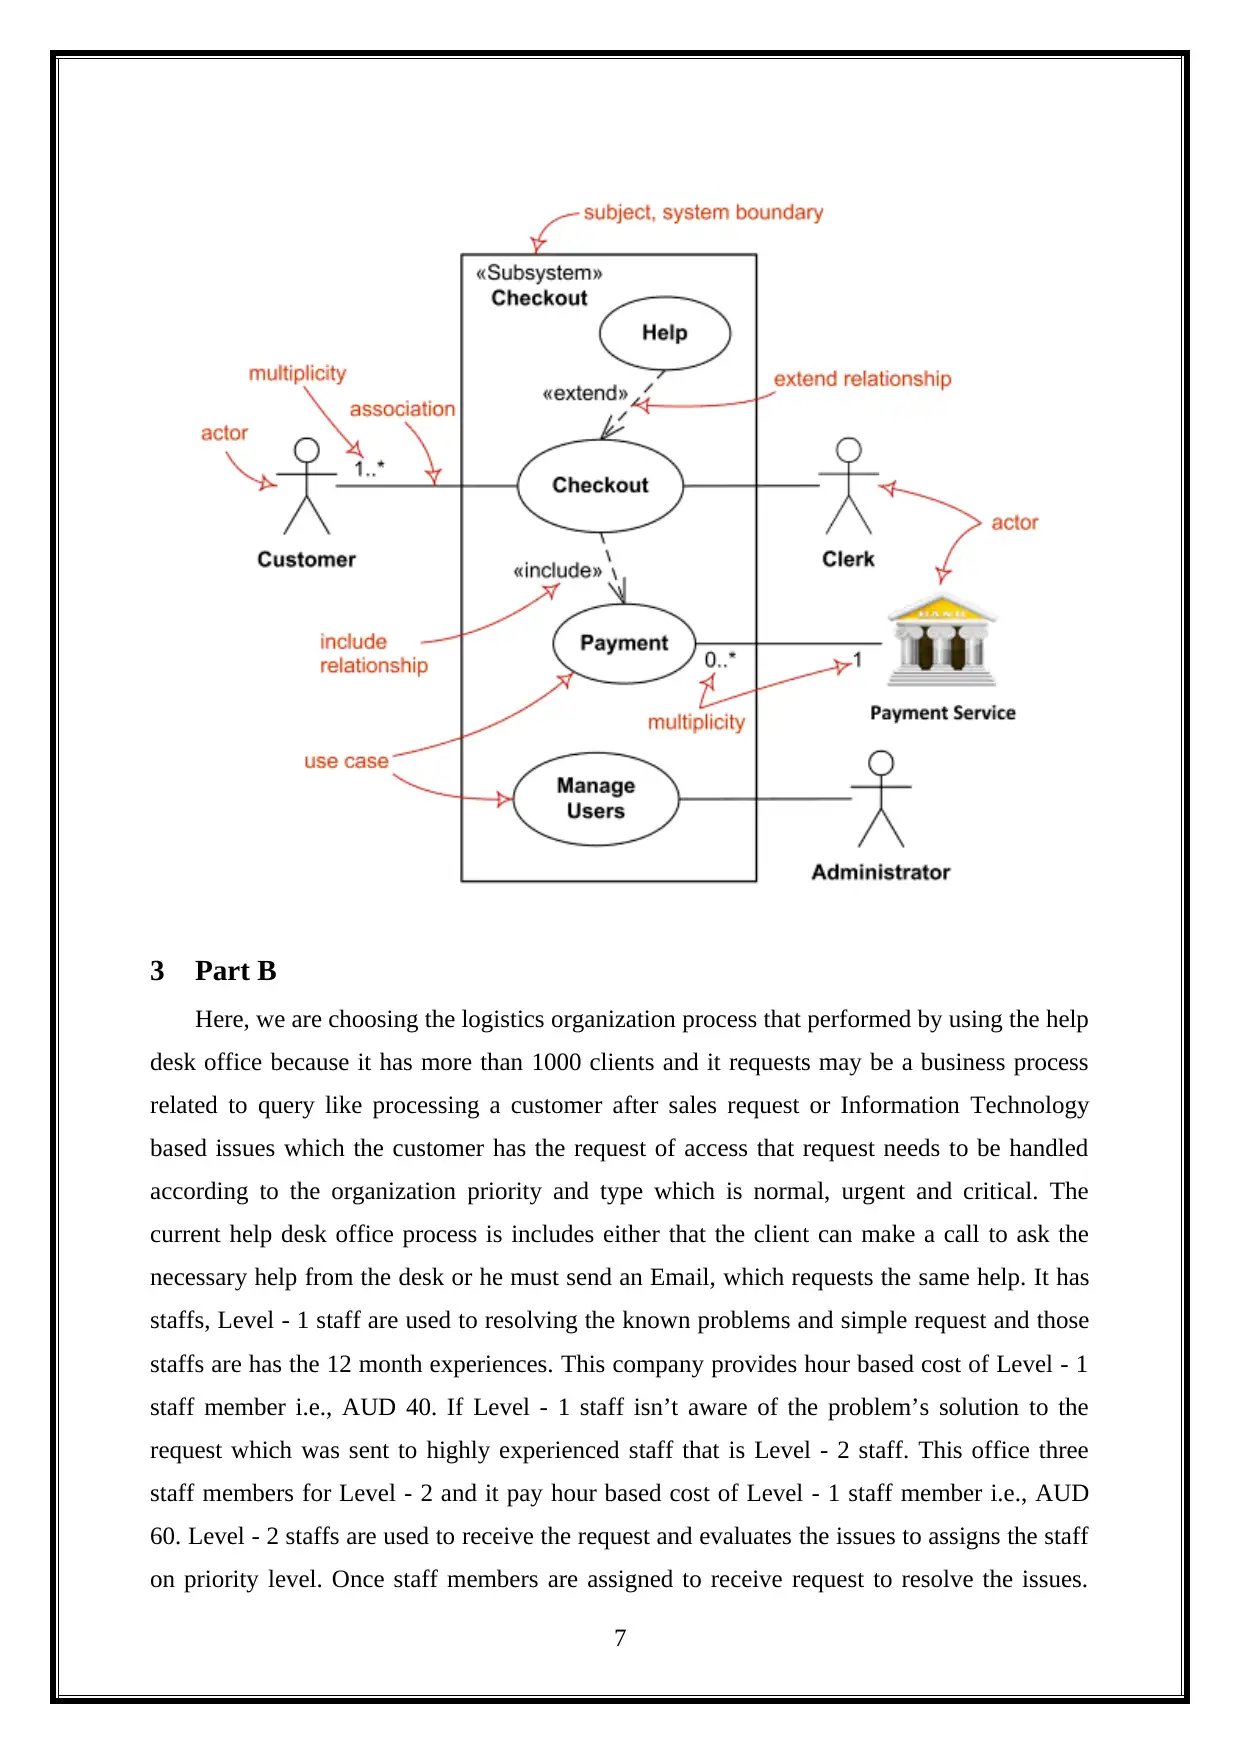
2.6 System Use case Diagrams
For determining the following, the System Use case diagrams are used:
• External requirements, that are necessary for the system based on the plan or
investigation (subject) - for catching the assumptions of the system;
• Benefits provided by the subject –the capacity of what system can do;
• Requirements predefined the subject postures based on certain conditions – With
the help of characterizing on how the condition must be connected with the
subject, such that it has the capacity of playing its administration role.
System Use Case diagram for Logistics Organization is shown below ("Use case
diagrams are UML diagrams describing units of useful functionality (use cases) performed by
a system in collaboration with external users (actors).", 2018).
6
character won’t be characterized based on the standards of UML. Hence, it is required to
either make use of certain UML tools which helps or one has to use their own business
representation methods. The business Use Case diagram for Logistics Organization is shown
in the above section ("How to Find Use Cases from Business Process (BPMN)?", 2018).
2.6 System Use case Diagrams
For determining the following, the System Use case diagrams are used:
• External requirements, that are necessary for the system based on the plan or
investigation (subject) - for catching the assumptions of the system;
• Benefits provided by the subject –the capacity of what system can do;
• Requirements predefined the subject postures based on certain conditions – With
the help of characterizing on how the condition must be connected with the
subject, such that it has the capacity of playing its administration role.
System Use Case diagram for Logistics Organization is shown below ("Use case
diagrams are UML diagrams describing units of useful functionality (use cases) performed by
a system in collaboration with external users (actors).", 2018).
6
Paraphrase This Document
Need a fresh take? Get an instant paraphrase of this document with our AI Paraphraser
3 Part B
Here, we are choosing the logistics organization process that performed by using the help
desk office because it has more than 1000 clients and it requests may be a business process
related to query like processing a customer after sales request or Information Technology
based issues which the customer has the request of access that request needs to be handled
according to the organization priority and type which is normal, urgent and critical. The
current help desk office process is includes either that the client can make a call to ask the
necessary help from the desk or he must send an Email, which requests the same help. It has
staffs, Level - 1 staff are used to resolving the known problems and simple request and those
staffs are has the 12 month experiences. This company provides hour based cost of Level - 1
staff member i.e., AUD 40. If Level - 1 staff isn’t aware of the problem’s solution to the
request which was sent to highly experienced staff that is Level - 2 staff. This office three
staff members for Level - 2 and it pay hour based cost of Level - 1 staff member i.e., AUD
60. Level - 2 staffs are used to receive the request and evaluates the issues to assigns the staff
on priority level. Once staff members are assigned to receive request to resolve the issues.
7
After, the registration of the request is done, the task is to track the system. This system is
used to store the details of client name that is who generated the request, priority level and
request details.
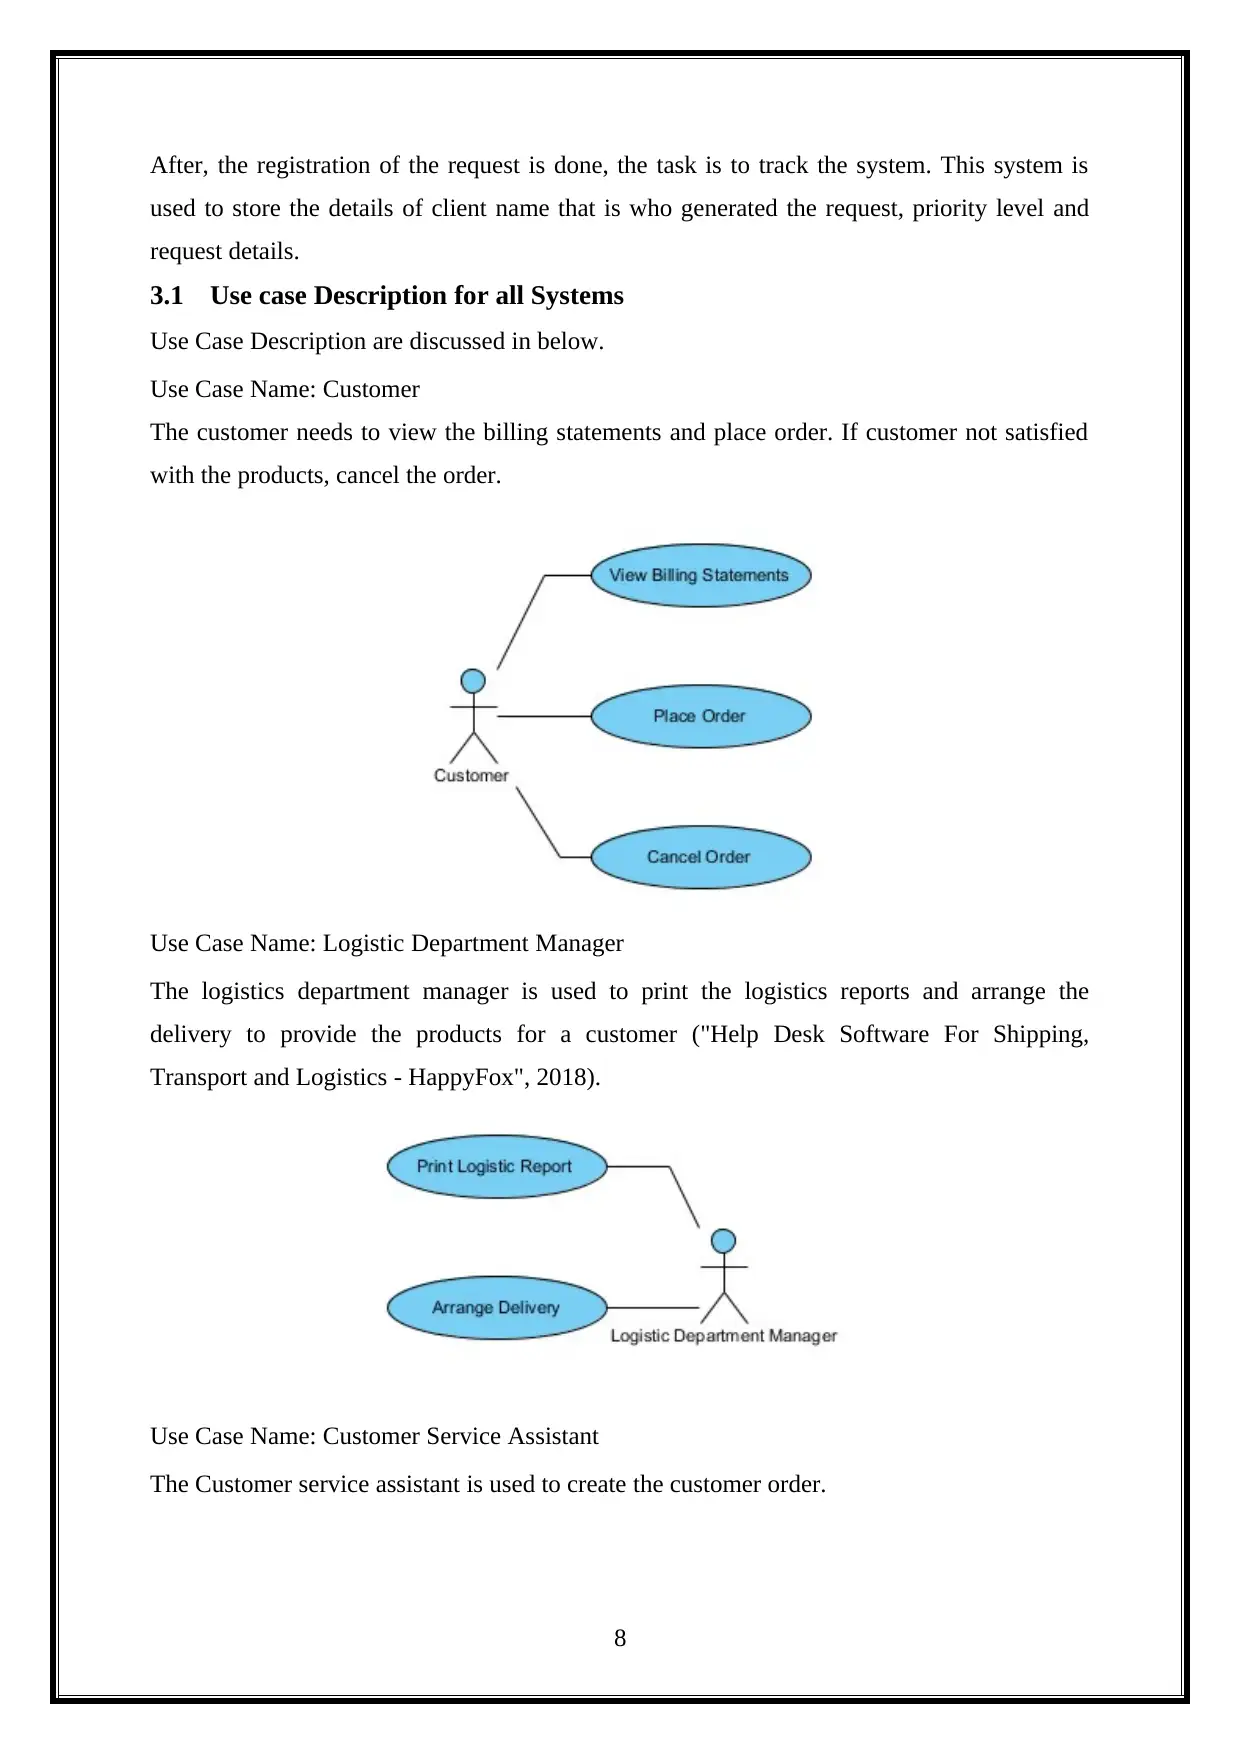
3.1 Use case Description for all Systems
Use Case Description are discussed in below.
Use Case Name: Customer
The customer needs to view the billing statements and place order. If customer not satisfied
with the products, cancel the order.
Use Case Name: Logistic Department Manager
The logistics department manager is used to print the logistics reports and arrange the
delivery to provide the products for a customer ("Help Desk Software For Shipping,
Transport and Logistics - HappyFox", 2018).
Use Case Name: Customer Service Assistant
The Customer service assistant is used to create the customer order.
8
used to store the details of client name that is who generated the request, priority level and
request details.
3.1 Use case Description for all Systems
Use Case Description are discussed in below.
Use Case Name: Customer
The customer needs to view the billing statements and place order. If customer not satisfied
with the products, cancel the order.
Use Case Name: Logistic Department Manager
The logistics department manager is used to print the logistics reports and arrange the
delivery to provide the products for a customer ("Help Desk Software For Shipping,
Transport and Logistics - HappyFox", 2018).
Use Case Name: Customer Service Assistant
The Customer service assistant is used to create the customer order.
8
⊘ This is a preview!⊘
Do you want full access?
Subscribe today to unlock all pages.
Trusted by 1+ million students worldwide
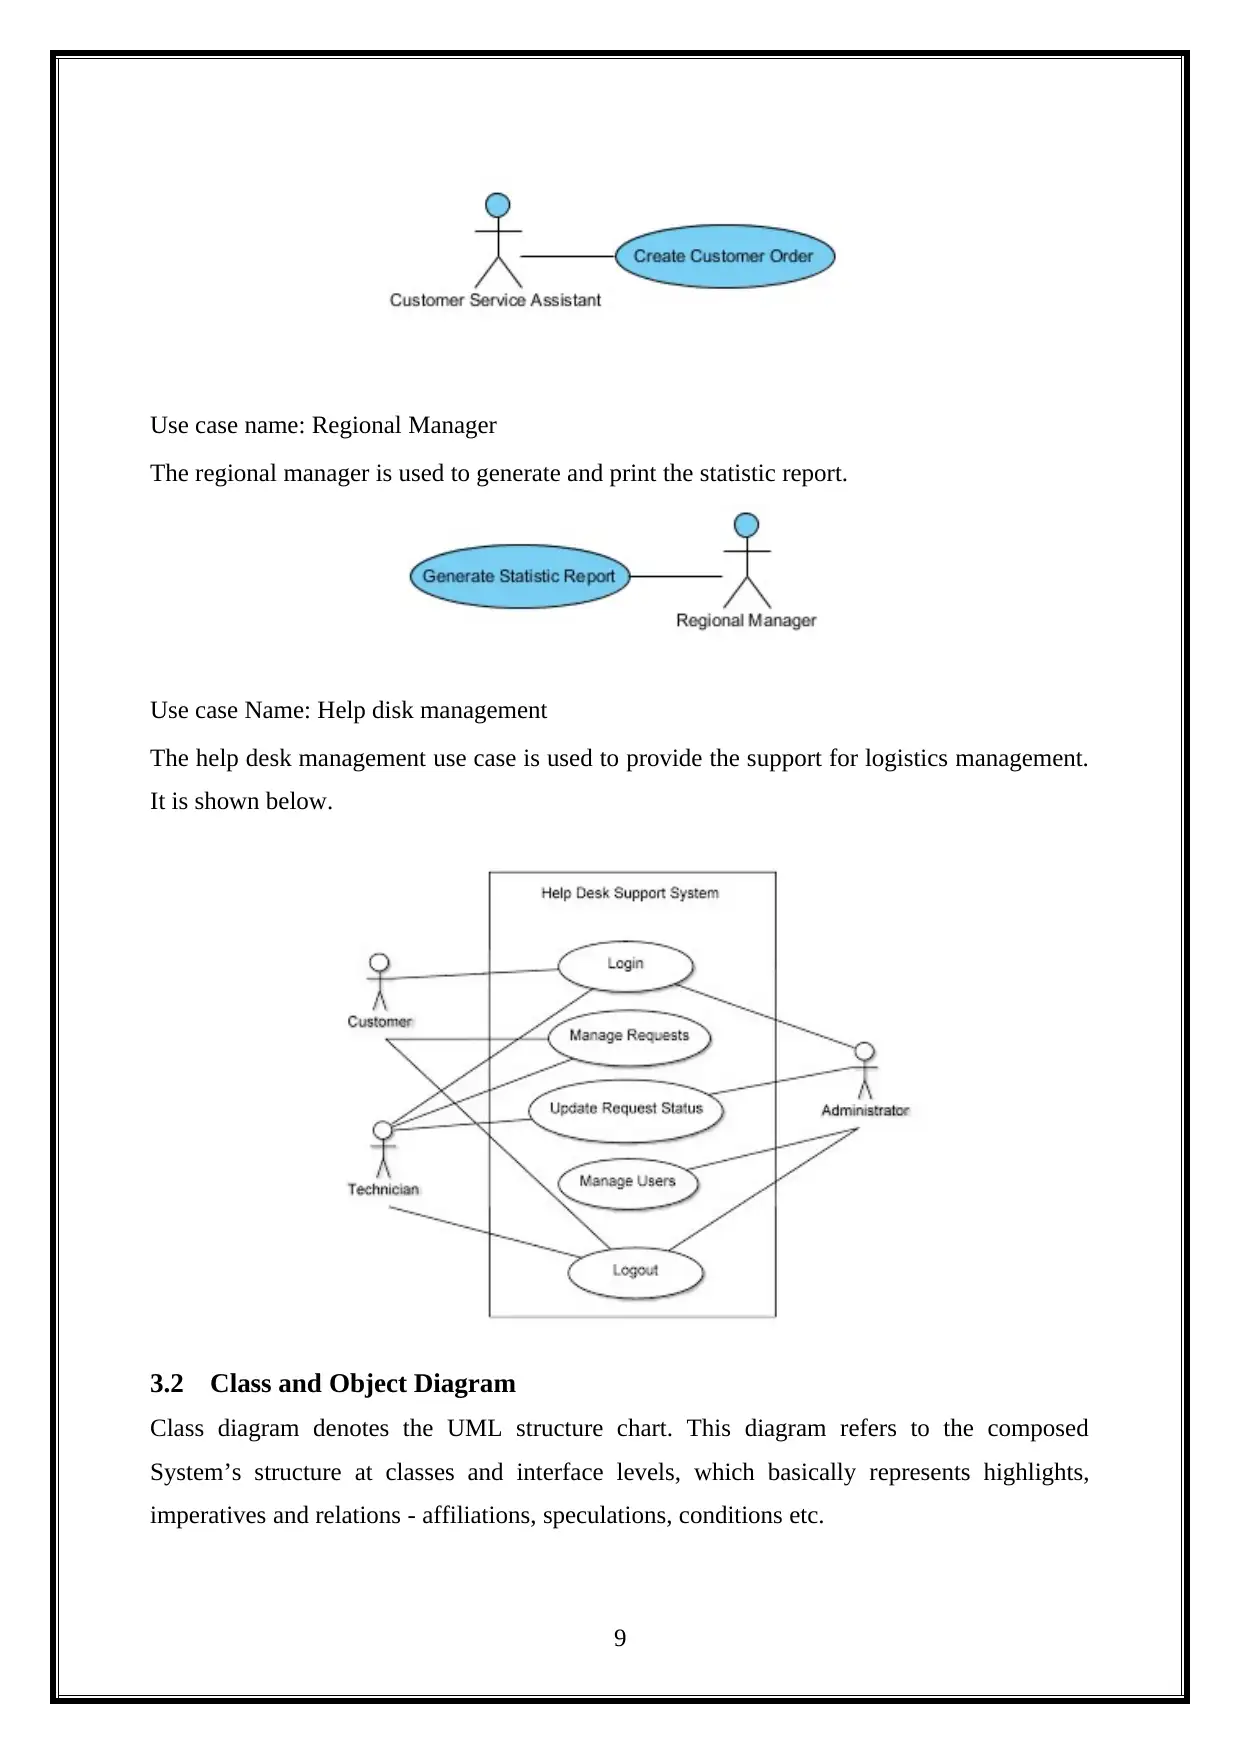
Use case name: Regional Manager
The regional manager is used to generate and print the statistic report.
Use case Name: Help disk management
The help desk management use case is used to provide the support for logistics management.
It is shown below.
3.2 Class and Object Diagram
Class diagram denotes the UML structure chart. This diagram refers to the composed
System’s structure at classes and interface levels, which basically represents highlights,
imperatives and relations - affiliations, speculations, conditions etc.
9
Paraphrase This Document
Need a fresh take? Get an instant paraphrase of this document with our AI Paraphraser
Some normal sorts of class diagrams are ("UML Class and Object Diagrams Overview -
common types of UML structure diagrams.", 2018):
• Domain demonstrate diagram,
• Diagram of usage classes.
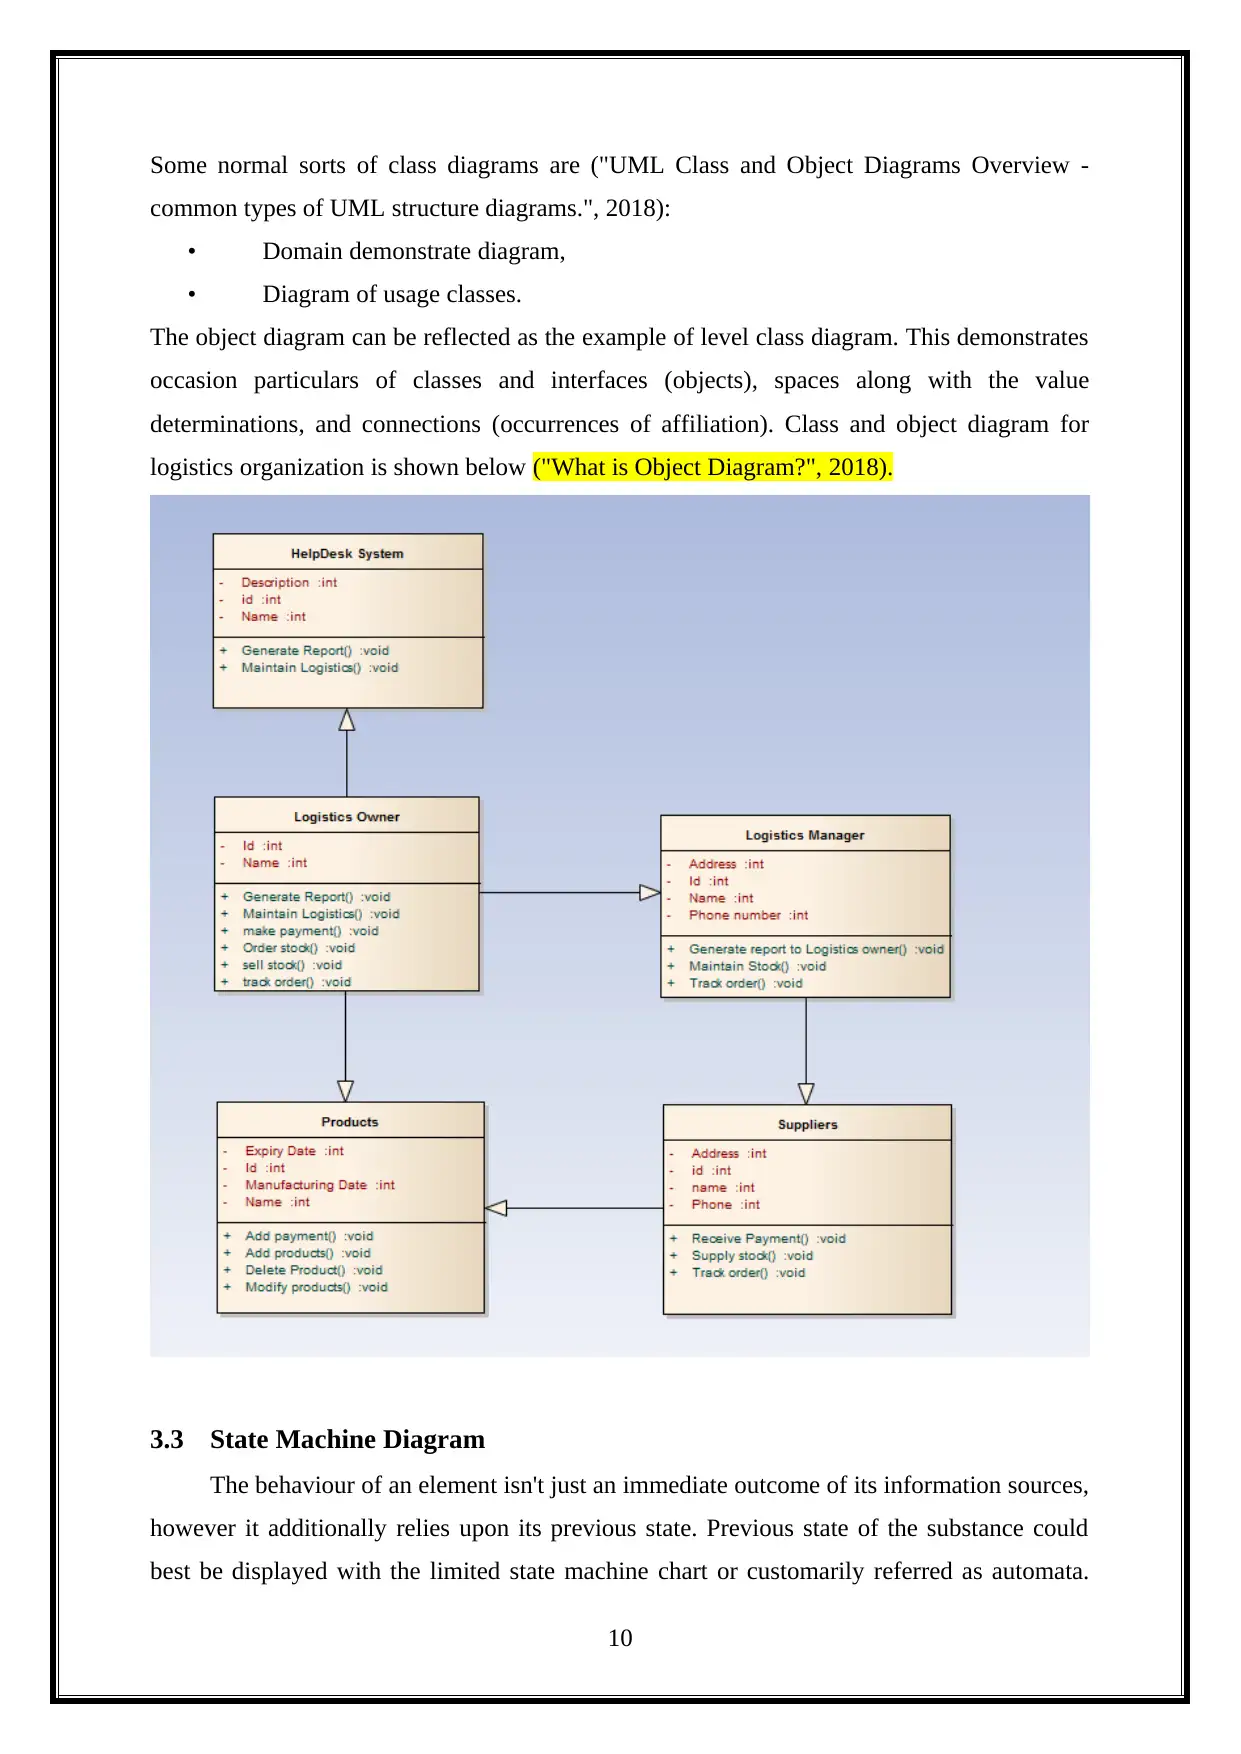
The object diagram can be reflected as the example of level class diagram. This demonstrates
occasion particulars of classes and interfaces (objects), spaces along with the value
determinations, and connections (occurrences of affiliation). Class and object diagram for
logistics organization is shown below ("What is Object Diagram?", 2018).
3.3 State Machine Diagram
The behaviour of an element isn't just an immediate outcome of its information sources,
however it additionally relies upon its previous state. Previous state of the substance could
best be displayed with the limited state machine chart or customarily referred as automata.
10
common types of UML structure diagrams.", 2018):
• Domain demonstrate diagram,
• Diagram of usage classes.
The object diagram can be reflected as the example of level class diagram. This demonstrates
occasion particulars of classes and interfaces (objects), spaces along with the value
determinations, and connections (occurrences of affiliation). Class and object diagram for
logistics organization is shown below ("What is Object Diagram?", 2018).
3.3 State Machine Diagram
The behaviour of an element isn't just an immediate outcome of its information sources,
however it additionally relies upon its previous state. Previous state of the substance could
best be displayed with the limited state machine chart or customarily referred as automata.
10
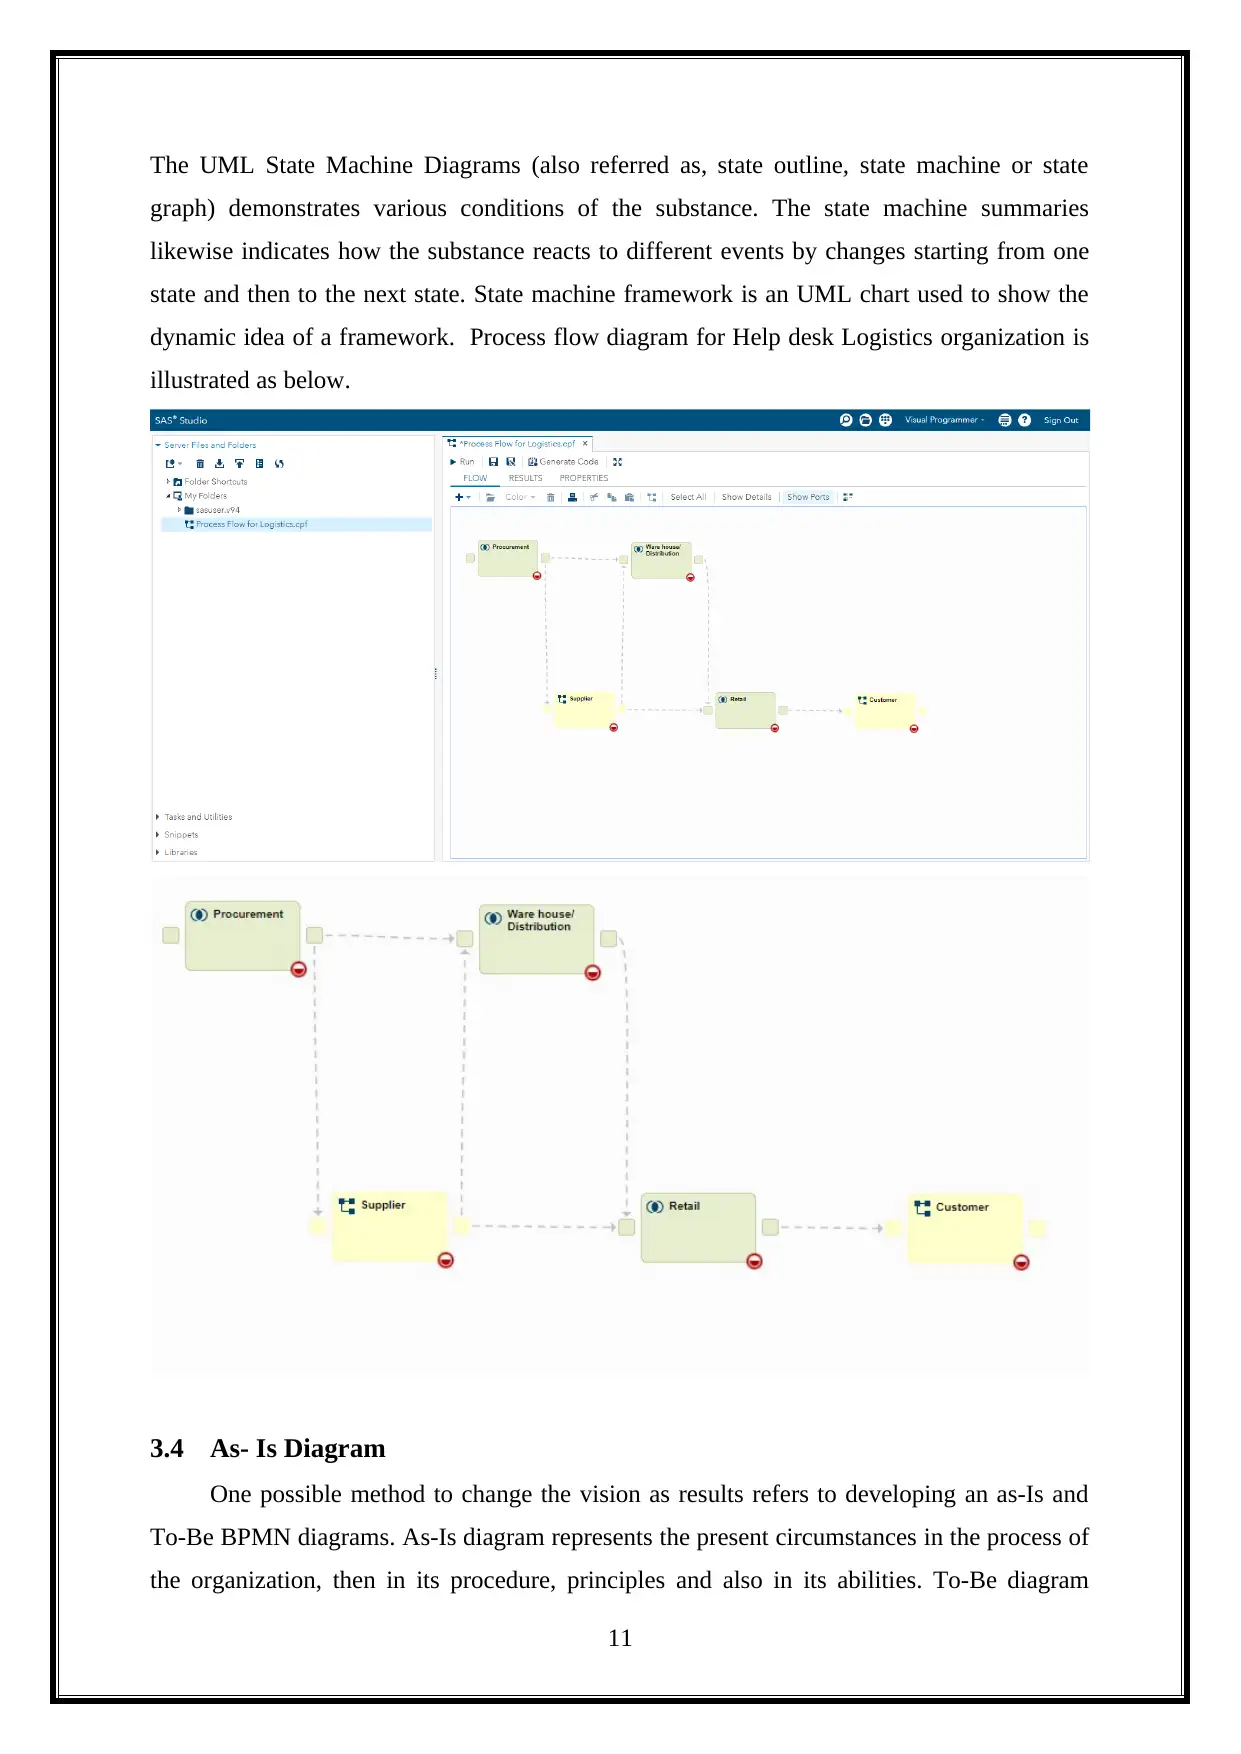
The UML State Machine Diagrams (also referred as, state outline, state machine or state
graph) demonstrates various conditions of the substance. The state machine summaries
likewise indicates how the substance reacts to different events by changes starting from one
state and then to the next state. State machine framework is an UML chart used to show the
dynamic idea of a framework. Process flow diagram for Help desk Logistics organization is
illustrated as below.
3.4 As- Is Diagram
One possible method to change the vision as results refers to developing an as-Is and
To-Be BPMN diagrams. As-Is diagram represents the present circumstances in the process of
the organization, then in its procedure, principles and also in its abilities. To-Be diagram
11
⊘ This is a preview!⊘
Do you want full access?
Subscribe today to unlock all pages.
Trusted by 1+ million students worldwide
1 out of 20
Related Documents


Your All-in-One AI-Powered Toolkit for Academic Success.
+13062052269
info@desklib.com
Available 24*7 on WhatsApp / Email
![[object Object]](/_next/static/media/star-bottom.7253800d.svg)
Unlock your academic potential
Copyright © 2020–2026 A2Z Services. All Rights Reserved. Developed and managed by ZUCOL.