MITS6002 Business Analytics Assignment 3: Report Analysis

Verified

Added on  2023/03/31

|10
|1252
|366
Report
AI Summary
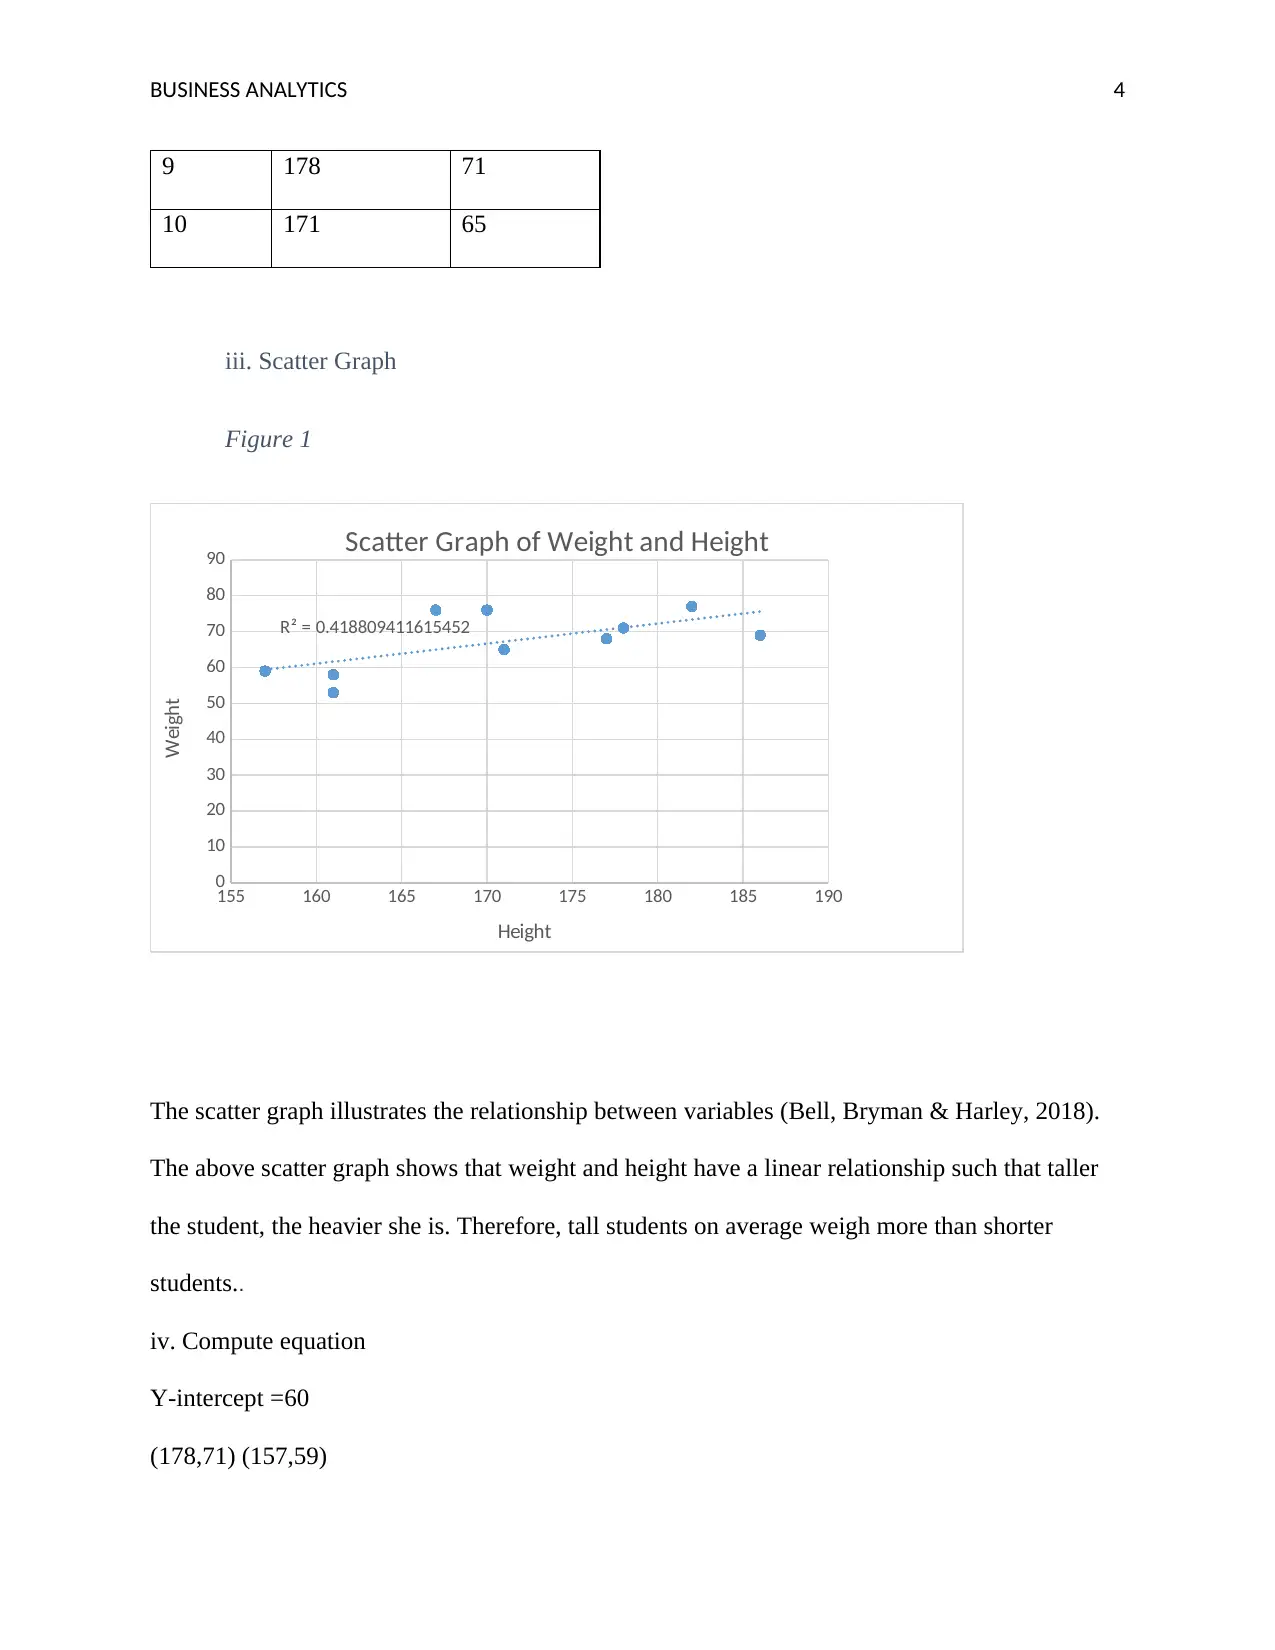
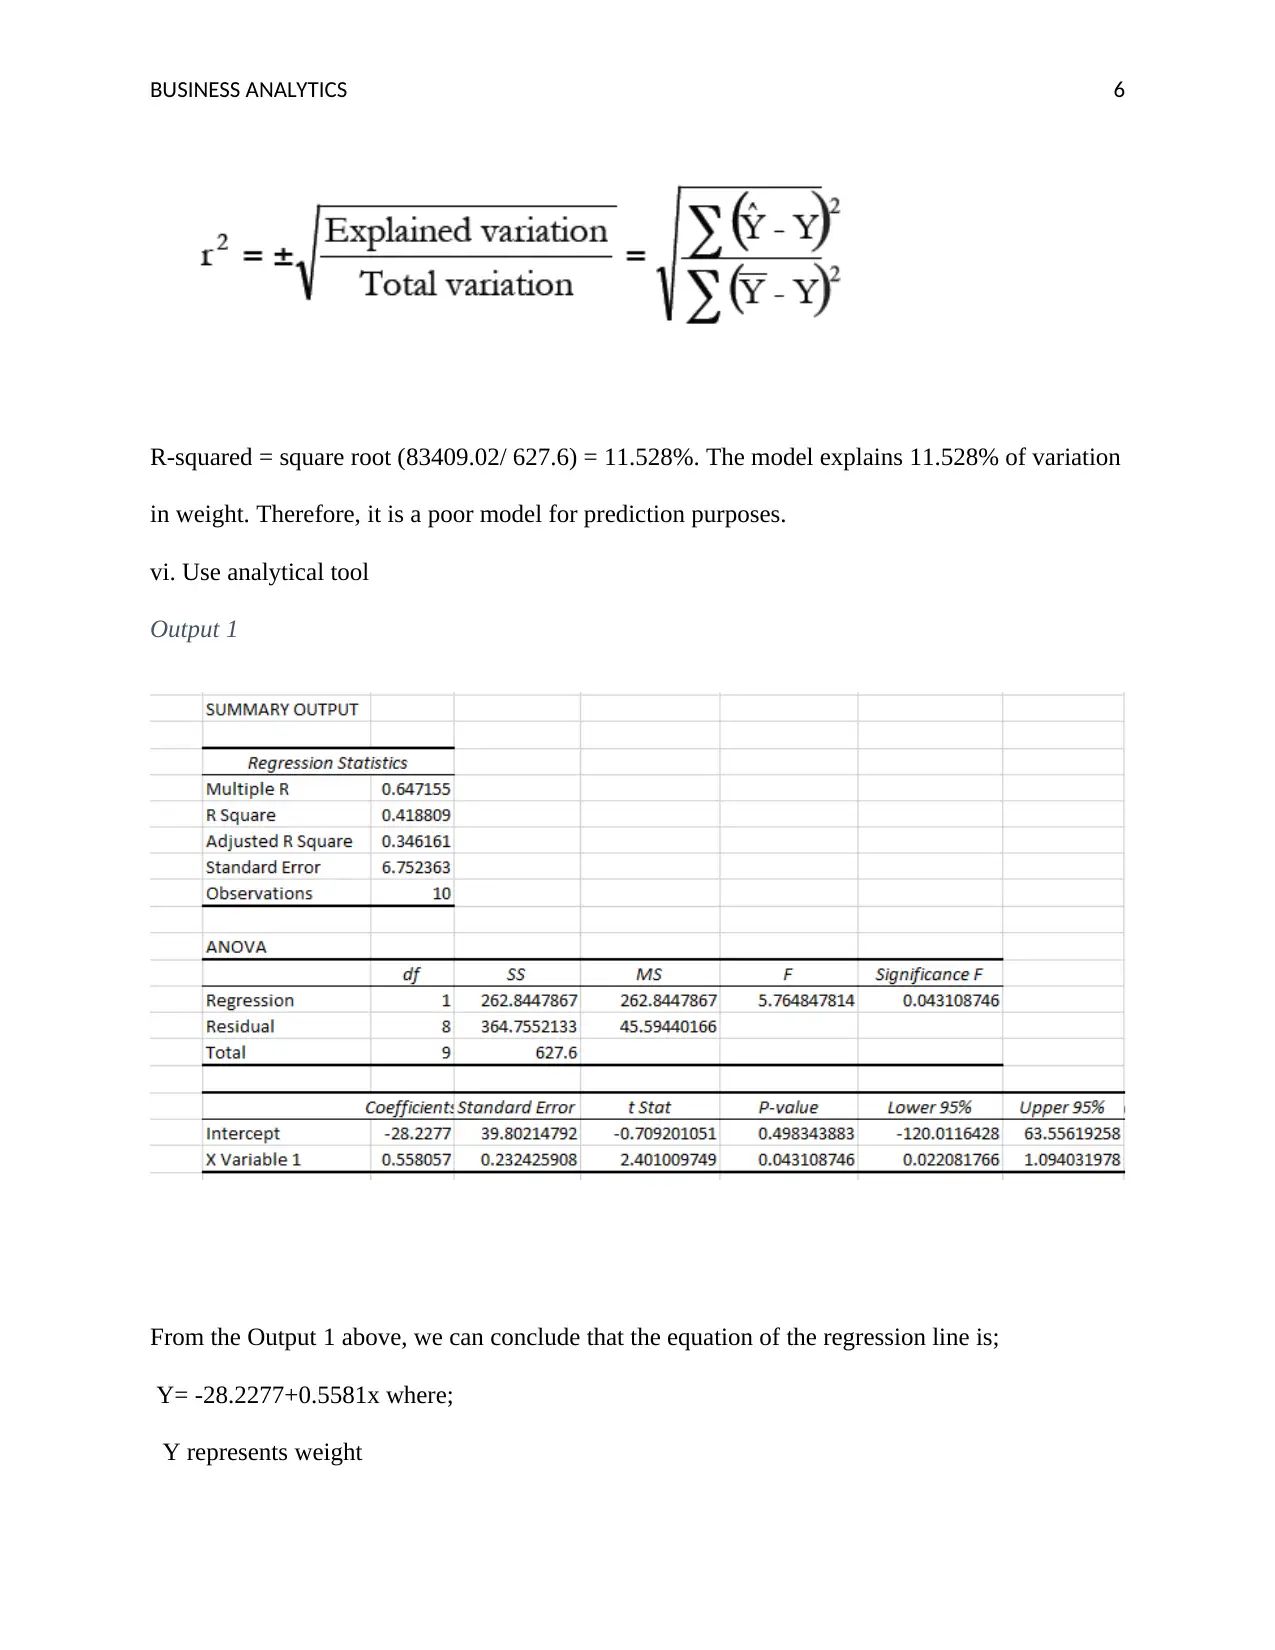
This report presents a comprehensive analysis of a business analytics assignment, addressing key aspects of data analysis and its applications in the retail sector. The report begins with an evaluation of a retail insights report, assessing its quality of visualizations, presentability, and the information provided. It identifies key insights and their implications for decision-making, providing a concise abstract summarizing the report's findings and suggesting areas for improvement. The second part of the report focuses on regression analysis, demonstrating its practical use through a case study involving height and weight data. It includes a scatterplot analysis, equation derivation, and R-squared calculation to assess the model's goodness of fit. Finally, the report delves into classification and prediction methods, contrasting their applications and providing examples of classification techniques such as neural networks and clustering in data mining, illustrating their utility in business contexts such as customer segmentation and fraud detection.
tabler-icon-diamond-filled.svg

Contribute Materials

Your contribution can guide someone’s learning journey. Share your documents today.
Document Page
Running head: BUSINESS ANALYTICS 1
Business Analytics
Student’s Name:
Institutional Affiliation
tabler-icon-diamond-filled.svg

Secure Best Marks with AI Grader

Need help grading? Try our AI Grader for instant feedback on your assignments.
Document Page
BUSINESS ANALYTICS 2
Business Analytics
Q1
i The presentation of the report is good. The report explains the topic at hand using
writings supported by attractive visualizations such bar graphs and pictures. The
visualizations are of desirable quality and hence can attract readers to read to establish the
information presented in the report. The information provided is also presented in a
professional language builds the trust of the reader on the correctness of the insights.
ii The report shows that majority of retail industry players have adopted innovative
strategies. Therefore, this aids in decision making by motivating firms in the industry to
innovate to avoid losing customers.
The retailers expect a return on their investment in innovation in a short period of time
with around 80% of investors expecting returns within a period of one year. With these
retailers receiving an average return of two dollars for every dollar invested in
innovation, managers need to consider the importance of innovation in raising
productivity and competitiveness.
iii The report discusses the state of the Australian retail industry. The report highlights that
the industry is competitive and participants are keen to enhance efficiencies through the
use of innovation and technology. However, some participants tend to have been left
behind in leveraging technology. The report indicates that the industry is operating above
the country’s average in adopting technology with around 87% of retailers being either
innovative active or improvers while around 3 percent have abandoned technology
completely. The major driver of innovation in the retail sector is the improvement of
efficiency and productivity.
Document Page
BUSINESS ANALYTICS 3
iv Although the report is good, the number of charts in the presentation should be reduced
without losing information. It is possible to incorporate a few visualizations that are
easily comprehensible and rich in information (Ward, Grinstein & Keim, 2015). This will
make the report shorter and information rich.
Q2
i Regression analysis can be used in cost estimation while predicting the relationship
between costs incurred and the level of business level of activity (Kaplan, 2015). For
instance, a car repair company can use regression analysis to estimate the total cost of
repairing a given number of cars. In this scenario, total variable cost is the dependent
variable while the number of cars repaired becomes the independent variable. Regression
analysis leads to development of an equation in the form of Y=a+bx such that the
dependent variable Y can be estimated given the value of the independent variable X.
ii Height and Weight Dataset
Table 1
Height (cm) Weight (Kg)
1 182 77
2 161 58
3 161 53
4 177 68
5 157 59
6 170 76
7 167 76
8 186 69
Document Page
BUSINESS ANALYTICS 4
9 178 71
10 171 65
iii. Scatter Graph
Figure 1
155 160 165 170 175 180 185 190
0
10
20
30
40
50
60
70
80
90
R² = 0.418809411615452
Scatter Graph of Weight and Height
Height
Weight
The scatter graph illustrates the relationship between variables (Bell, Bryman & Harley, 2018).
The above scatter graph shows that weight and height have a linear relationship such that taller
the student, the heavier she is. Therefore, tall students on average weigh more than shorter
students..
iv. Compute equation
Y-intercept =60
(178,71) (157,59)
tabler-icon-diamond-filled.svg

Secure Best Marks with AI Grader

Need help grading? Try our AI Grader for instant feedback on your assignments.
Document Page
BUSINESS ANALYTICS 5
Change in Y/ change in X = (59-71)/ (157-178) =0.5714
Hence trend line equation is Y=60+0.5714x
v. Calculate R-squared
Height (cm)-
X
Weight (Kg)-
Y
Y_hat
Y_hat-Y
(Y_hat-
Y)^2
Y_bar-
Y
(Y_bar-
Y)^2
1 182 77 163.99 86.99 7567.26 -9.8 96.04
2 161 58 153.71 95.71 9160.404 9.2 84.64
3 161 53 152.00 99 9801 14.2 201.64
4 177 68 149.71 81.71 6676.524 -0.8 0.64
5 157 59 149.71 90.71 8228.304 8.2 67.24
6 170 76 157.14 81.14 6583.7 -8.8 77.44
7 167 76 171.42 95.42 9104.976 -8.8 77.44
8 186 69 166.28 97.28 9463.398 -1.8 3.24
9 178 71 161.71 90.71 8228.304 -3.8 14.44
10 171 65 157.71 92.71 8595.144 2.2 4.84
Mean of Y Y_bar= 67.2 Sum=
83409.02
Sum=
627.6
Document Page
BUSINESS ANALYTICS 6
R-squared = square root (83409.02/ 627.6) = 11.528%. The model explains 11.528% of variation
in weight. Therefore, it is a poor model for prediction purposes.
vi. Use analytical tool
Output 1
From the Output 1 above, we can conclude that the equation of the regression line is;
Y= -28.2277+0.5581x where;
Y represents weight
Document Page
BUSINESS ANALYTICS 7
X represents height.
R – Squared
From the output above, it can be depicted that the R-squared value of goodness of fit is
41.8809%. This means that the model explains the variation in weight by 41.8809%. Since
58.1191% of the variation remains unexplained by the model, we conclude that the model does
not adequately explain the variation in the dependent variable. Compared to the calculated
equation and R-squared, the results obtained using the analytical model are better.
QN 3
i Classification predicts categorical class of variables by applying labels of training data to
classify new ones whereas prediction models continuous variables (Aggarwal, 2014). A
researcher will use classification to determine whether a student will pass or Not and use
prediction to estimate the cost of repairing one thousand cars in a garage.
ii Examples of classification methods are discriminant analysis, random forests, logistic
regression, k-nearest neighbors, neural networks, and the naïve Bayes method. These
methods have their unique characteristics (Sajana, Rani & Narayana, 2016). The nature of
variables in the dataset determines the most appropriate method to be applied.
iii
tabler-icon-diamond-filled.svg

Paraphrase This Document

Need a fresh take? Get an instant paraphrase of this document with our AI Paraphraser
Document Page
BUSINESS ANALYTICS 8
The algebraic equation for y1 in terms of input values i1, i2, and weights w is.
Y1= bi+w1i1+w2i2+...+wnxn
i Use of Neural Networks
Analysts consider neural networks as classification layer that lies on top of the data being
managed or stored. To classify, unlabeled data is grouped as per their input similarities. Neural
networks can also help in classifying trained labeled data.
ii Clustering
Clustering in data mining involves grouping together related data. The algorithm allocates data
points to various groups some of which are similar and other not (Chicco, Napoli & Piglione, 2018).
In data analytics, clustering can be used to manage data more efficiently. Clustered data are
easily accessible to the right users.
Businesses can also use clustering to segment their customers according to their characteristics.
Market segmentation which is achieved through clustering customers makes sales campaigns
more successful in generating sales (Ernst & Dolnicar, 2018)
Document Page
BUSINESS ANALYTICS 9
Insurers apply clustering in detecting fraud, and identification of possible risk factors. Insurers
face the risk of moral hazard (Tan, 2018). Therefore, clustering enables them to identify the most
risky clients in order for to charge appropriate rates of premium.
References
Document Page
BUSINESS ANALYTICS 10
Aggarwal, C. C. (Ed.). (2014). Data classification: algorithms and applications. CRC press.
Bell, E., Bryman, A., & Harley, B. (2018). Business research methods. Oxford university press
Chicco, G., Napoli, R., & Piglione, F. (2018). Comparisons among clustering techniques for electricity
customer classification. IEEE Transactions on Power Systems, 21(2), 933-940.
Ernst, D., & Dolnicar, S. (2018). How to avoid random market segmentation solutions. Journal of Travel
Research, 57(1), 69-82.
Kaplan, R. S., & Atkinson, A. A. (2015). Advanced management accounting. PHI Learning.
Sajana, T., Rani, C. S., & Narayana, K. V. (2016). A survey on clustering techniques for big data
mining. Indian journal of Science and Technology, 9(3), 1-12.
Tan, P. N. (2018). Introduction to data mining. Pearson Education India.
Ward, M. O., Grinstein, G., & Keim, D. (2015). Interactive data visualization: foundations, techniques, and
applications. AK Peters/CRC Press.
chevron_up_icon
1 out of 10
circle_padding
hide_on_mobile
zoom_out_icon
logo.png

Your All-in-One AI-Powered Toolkit for Academic Success.

Available 24*7 on WhatsApp / Email

[object Object]