Business Analytics Report: Business Performance and Strategy Analysis
VerifiedAdded on 2022/11/24
|15
|4271
|386
Report
AI Summary
This business analytics report delves into various techniques crucial for informed business decision-making. It explores mathematical models, correlation analysis, and break-even analysis to assess the relationships between variables and their impact on profitability and growth. The report examines a case study involving a company's financial projections, cost behavior, and the effects of advertising expenditure on sales. It includes calculations for profit/loss, five-year projections, and break-even points. Furthermore, it analyzes the impact of different managerial strategies on the company's financial performance, providing insights into factors influencing business success and the application of marginal costing in business strategy formulation. The report concludes with a critical analysis of the benefits and limitations of these analytical tools, offering valuable insights for strategic decision-making.
MODULE: BUSINESS
ANALYTIC
ANALYTIC
Paraphrase This Document
Need a fresh take? Get an instant paraphrase of this document with our AI Paraphraser
TABLE OF CONTENTS
INTRODUCTION...........................................................................................................................1
MAIN BODY...................................................................................................................................1
QUESTION- 1.................................................................................................................................1
a) Mathematical model................................................................................................................1
b) i) Calculation of the profit or loss............................................................................................2
ii) Five year projections...............................................................................................................2
c) Costing and the revenue behaviour..........................................................................................2
QUESTION- 2.................................................................................................................................3
a) Correlation coefficient of the advertising and sales in the company.......................................3
b) Scatter diagram of the data showing the relationship between the two variables...................4
c) Critical analysis of the impact of the advertising expenditure on the sales of the company...4
QUESTION- 3.................................................................................................................................5
a) Calculation of the break-even point and the margin of safety.................................................7
b) Reasons for the adoption of the original plan or amending it as per the Production and the
Marketing manager......................................................................................................................9
c) Other factors that should be considered by the management before committing the any
action for the business..................................................................................................................9
d) Benefits and limitation of the break-even model and its application in the marginal costing
and formulation of the business strategy...................................................................................10
CONCLUSION..............................................................................................................................11
REFERENCES..............................................................................................................................13
INTRODUCTION
In order to make the several decisions in the business has to use the various techniques
like the decision tree, break-even analysis, correlation coefficients etc. to study the relationship
of the various variables. It shows how one of the variables shall be impacting the other and
accordingly the business shall form the business strategy to obtain profitability and growth in the
market. The current project shall be analysing upon the different practical problems and seeking
their solutions to find out the results and what can be inferred by the management and
accordingly how will they perform the further business strategies in the business to perform
effectively. The report shall be containing the description of the mathematical model and the
correlation analysis of the two variables wherein the company shall be finding out the
relationship of the various variables that are functioning in the company and accordingly the
growth strategies shall be defined in the business. Apart from that it shall even highlight the
break-even analysis of the company showing the optimum level of the sales that the company
needs to execute so that the profitability of the company can be maximized for the company. It
shall also reflect the change in the break-even point with the change in the strategies of the
business and accordingly the profitability shall be altered in the business.
MAIN BODY
QUESTION- 1
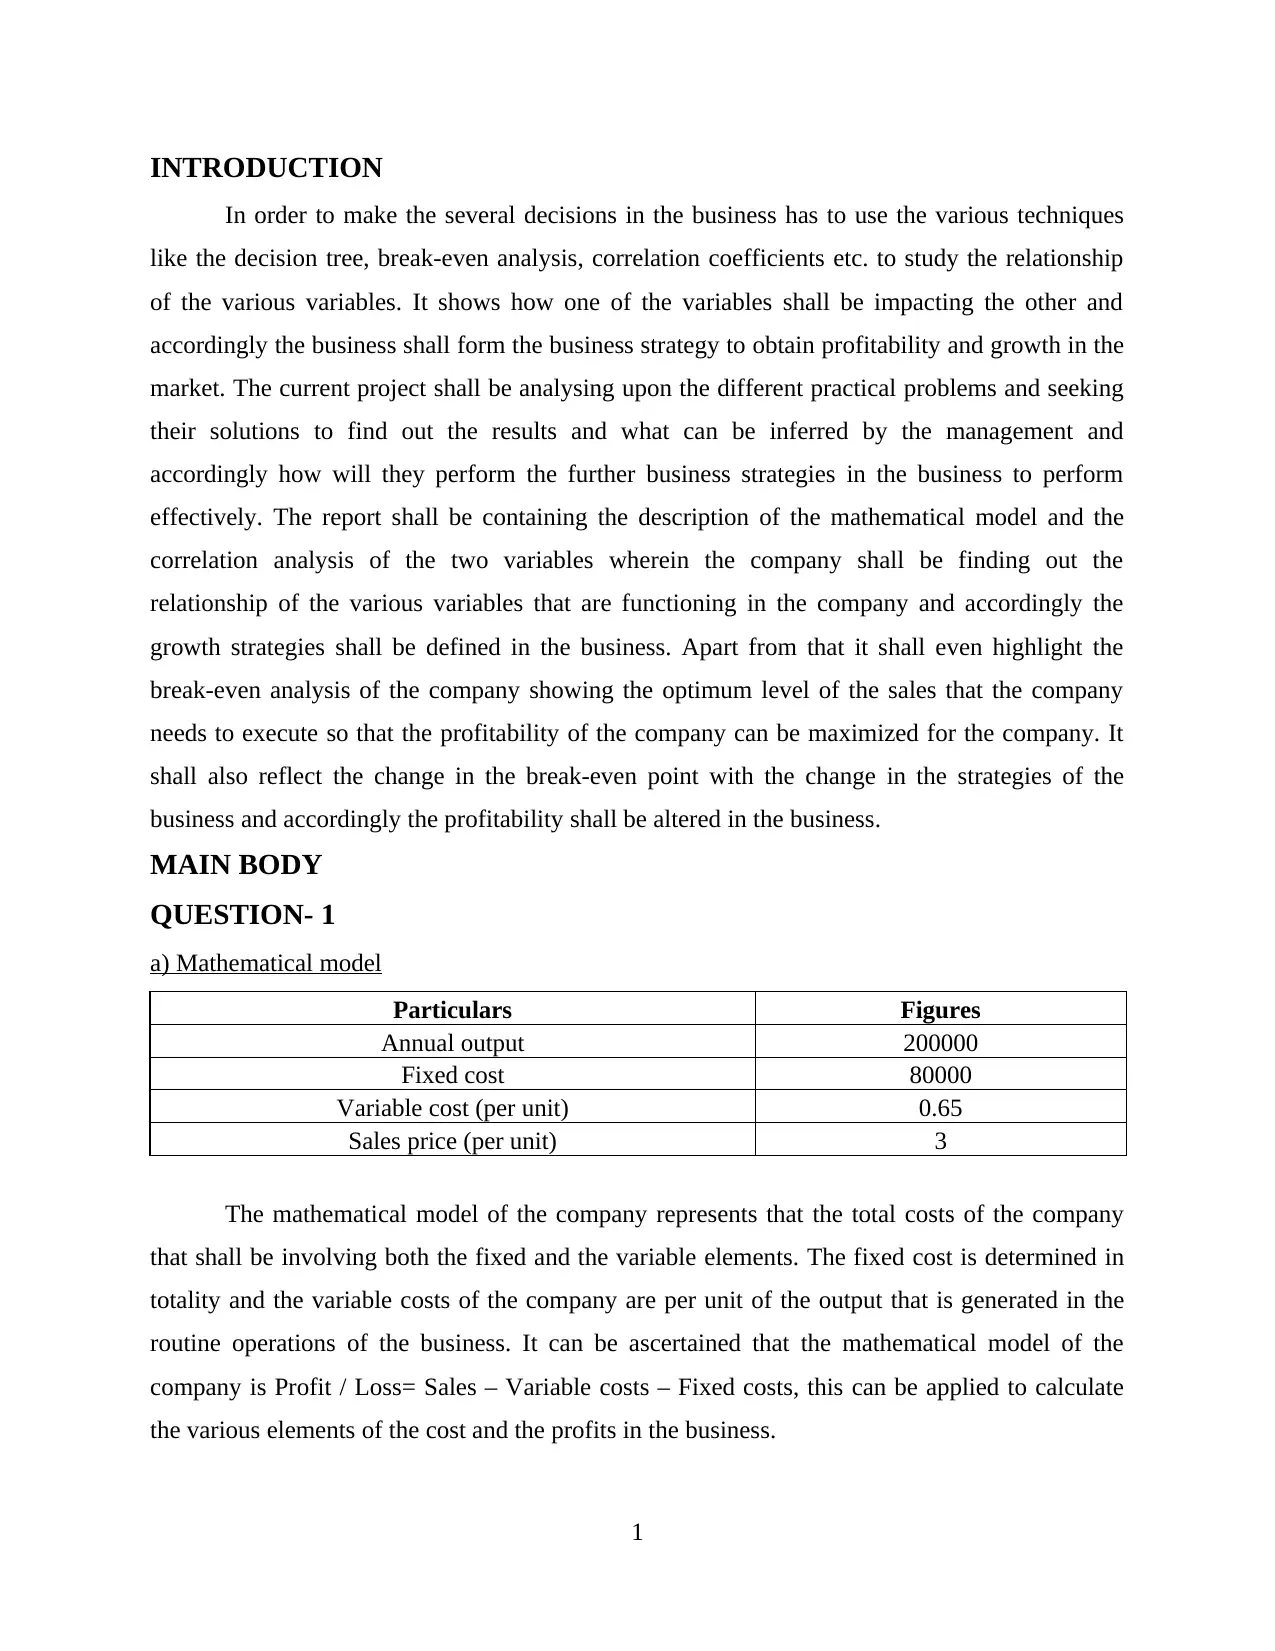
a) Mathematical model
Particulars Figures
Annual output 200000
Fixed cost 80000
Variable cost (per unit) 0.65
Sales price (per unit) 3
The mathematical model of the company represents that the total costs of the company
that shall be involving both the fixed and the variable elements. The fixed cost is determined in
totality and the variable costs of the company are per unit of the output that is generated in the
routine operations of the business. It can be ascertained that the mathematical model of the
company is Profit / Loss= Sales – Variable costs – Fixed costs, this can be applied to calculate
the various elements of the cost and the profits in the business.
1
In order to make the several decisions in the business has to use the various techniques
like the decision tree, break-even analysis, correlation coefficients etc. to study the relationship
of the various variables. It shows how one of the variables shall be impacting the other and
accordingly the business shall form the business strategy to obtain profitability and growth in the
market. The current project shall be analysing upon the different practical problems and seeking
their solutions to find out the results and what can be inferred by the management and
accordingly how will they perform the further business strategies in the business to perform
effectively. The report shall be containing the description of the mathematical model and the
correlation analysis of the two variables wherein the company shall be finding out the
relationship of the various variables that are functioning in the company and accordingly the
growth strategies shall be defined in the business. Apart from that it shall even highlight the
break-even analysis of the company showing the optimum level of the sales that the company
needs to execute so that the profitability of the company can be maximized for the company. It
shall also reflect the change in the break-even point with the change in the strategies of the
business and accordingly the profitability shall be altered in the business.
MAIN BODY
QUESTION- 1
a) Mathematical model
Particulars Figures
Annual output 200000
Fixed cost 80000
Variable cost (per unit) 0.65
Sales price (per unit) 3
The mathematical model of the company represents that the total costs of the company
that shall be involving both the fixed and the variable elements. The fixed cost is determined in
totality and the variable costs of the company are per unit of the output that is generated in the
routine operations of the business. It can be ascertained that the mathematical model of the
company is Profit / Loss= Sales – Variable costs – Fixed costs, this can be applied to calculate
the various elements of the cost and the profits in the business.
1
⊘ This is a preview!⊘
Do you want full access?
Subscribe today to unlock all pages.
Trusted by 1+ million students worldwide
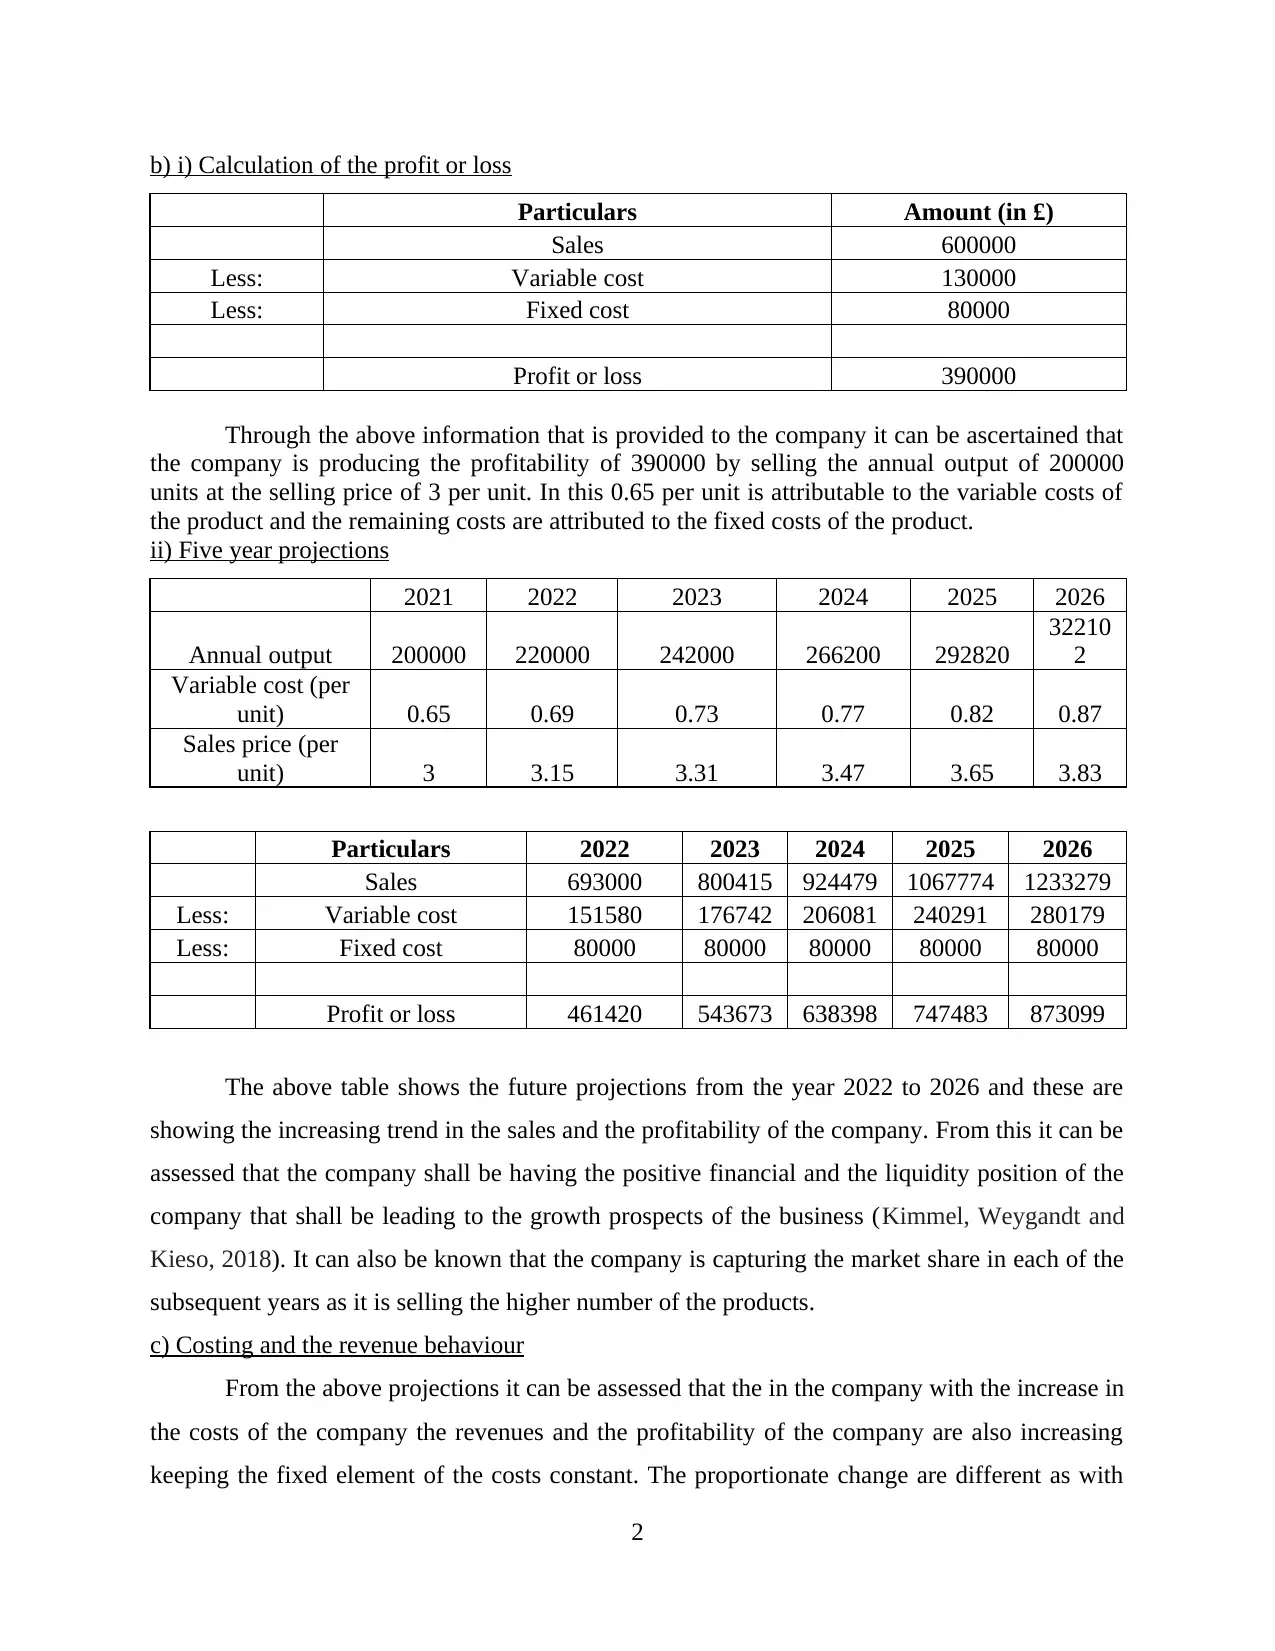
b) i) Calculation of the profit or loss
Particulars Amount (in £)
Sales 600000
Less: Variable cost 130000
Less: Fixed cost 80000
Profit or loss 390000
Through the above information that is provided to the company it can be ascertained that
the company is producing the profitability of 390000 by selling the annual output of 200000
units at the selling price of 3 per unit. In this 0.65 per unit is attributable to the variable costs of
the product and the remaining costs are attributed to the fixed costs of the product.
ii) Five year projections
2021 2022 2023 2024 2025 2026
Annual output 200000 220000 242000 266200 292820
32210
2
Variable cost (per
unit) 0.65 0.69 0.73 0.77 0.82 0.87
Sales price (per
unit) 3 3.15 3.31 3.47 3.65 3.83
Particulars 2022 2023 2024 2025 2026
Sales 693000 800415 924479 1067774 1233279
Less: Variable cost 151580 176742 206081 240291 280179
Less: Fixed cost 80000 80000 80000 80000 80000
Profit or loss 461420 543673 638398 747483 873099
The above table shows the future projections from the year 2022 to 2026 and these are
showing the increasing trend in the sales and the profitability of the company. From this it can be
assessed that the company shall be having the positive financial and the liquidity position of the
company that shall be leading to the growth prospects of the business (Kimmel, Weygandt and
Kieso, 2018). It can also be known that the company is capturing the market share in each of the
subsequent years as it is selling the higher number of the products.
c) Costing and the revenue behaviour
From the above projections it can be assessed that the in the company with the increase in
the costs of the company the revenues and the profitability of the company are also increasing
keeping the fixed element of the costs constant. The proportionate change are different as with
2
Paraphrase This Document
Need a fresh take? Get an instant paraphrase of this document with our AI Paraphraser
the increase of 6% in the variable costs only 5% are increased in the selling price of the
company, which means that the profitability proportion of the business is falling due to the lack
of the efficiency. It can also be observed that the fixed costs of the company are constant for the
long period of time for which the reason is that company is utilizing the lesser capacity in the
organization.
QUESTION- 2
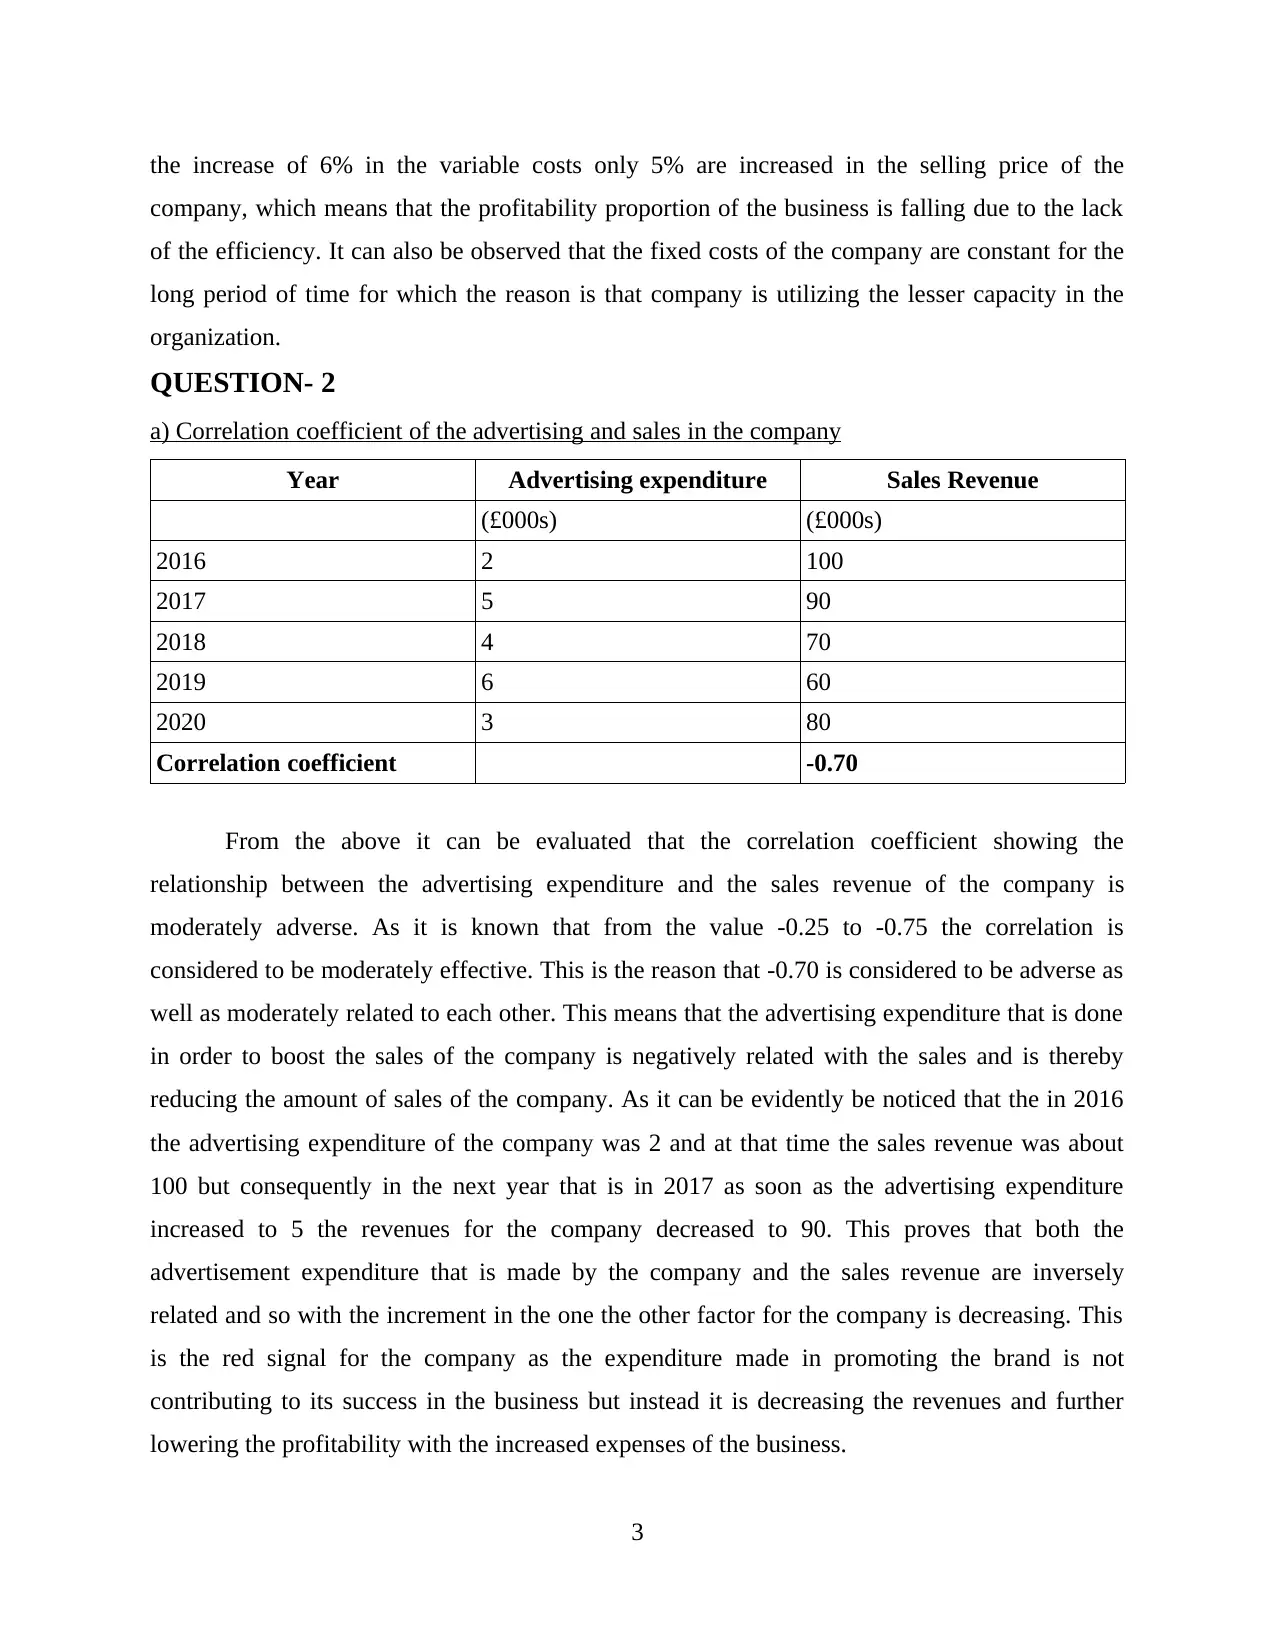
a) Correlation coefficient of the advertising and sales in the company
Year Advertising expenditure Sales Revenue
(£000s) (£000s)
2016 2 100
2017 5 90
2018 4 70
2019 6 60
2020 3 80
Correlation coefficient -0.70
From the above it can be evaluated that the correlation coefficient showing the
relationship between the advertising expenditure and the sales revenue of the company is
moderately adverse. As it is known that from the value -0.25 to -0.75 the correlation is
considered to be moderately effective. This is the reason that -0.70 is considered to be adverse as
well as moderately related to each other. This means that the advertising expenditure that is done
in order to boost the sales of the company is negatively related with the sales and is thereby
reducing the amount of sales of the company. As it can be evidently be noticed that the in 2016
the advertising expenditure of the company was 2 and at that time the sales revenue was about
100 but consequently in the next year that is in 2017 as soon as the advertising expenditure
increased to 5 the revenues for the company decreased to 90. This proves that both the
advertisement expenditure that is made by the company and the sales revenue are inversely
related and so with the increment in the one the other factor for the company is decreasing. This
is the red signal for the company as the expenditure made in promoting the brand is not
contributing to its success in the business but instead it is decreasing the revenues and further
lowering the profitability with the increased expenses of the business.
3
company, which means that the profitability proportion of the business is falling due to the lack
of the efficiency. It can also be observed that the fixed costs of the company are constant for the
long period of time for which the reason is that company is utilizing the lesser capacity in the
organization.
QUESTION- 2
a) Correlation coefficient of the advertising and sales in the company
Year Advertising expenditure Sales Revenue
(£000s) (£000s)
2016 2 100
2017 5 90
2018 4 70
2019 6 60
2020 3 80
Correlation coefficient -0.70
From the above it can be evaluated that the correlation coefficient showing the
relationship between the advertising expenditure and the sales revenue of the company is
moderately adverse. As it is known that from the value -0.25 to -0.75 the correlation is
considered to be moderately effective. This is the reason that -0.70 is considered to be adverse as
well as moderately related to each other. This means that the advertising expenditure that is done
in order to boost the sales of the company is negatively related with the sales and is thereby
reducing the amount of sales of the company. As it can be evidently be noticed that the in 2016
the advertising expenditure of the company was 2 and at that time the sales revenue was about
100 but consequently in the next year that is in 2017 as soon as the advertising expenditure
increased to 5 the revenues for the company decreased to 90. This proves that both the
advertisement expenditure that is made by the company and the sales revenue are inversely
related and so with the increment in the one the other factor for the company is decreasing. This
is the red signal for the company as the expenditure made in promoting the brand is not
contributing to its success in the business but instead it is decreasing the revenues and further
lowering the profitability with the increased expenses of the business.
3
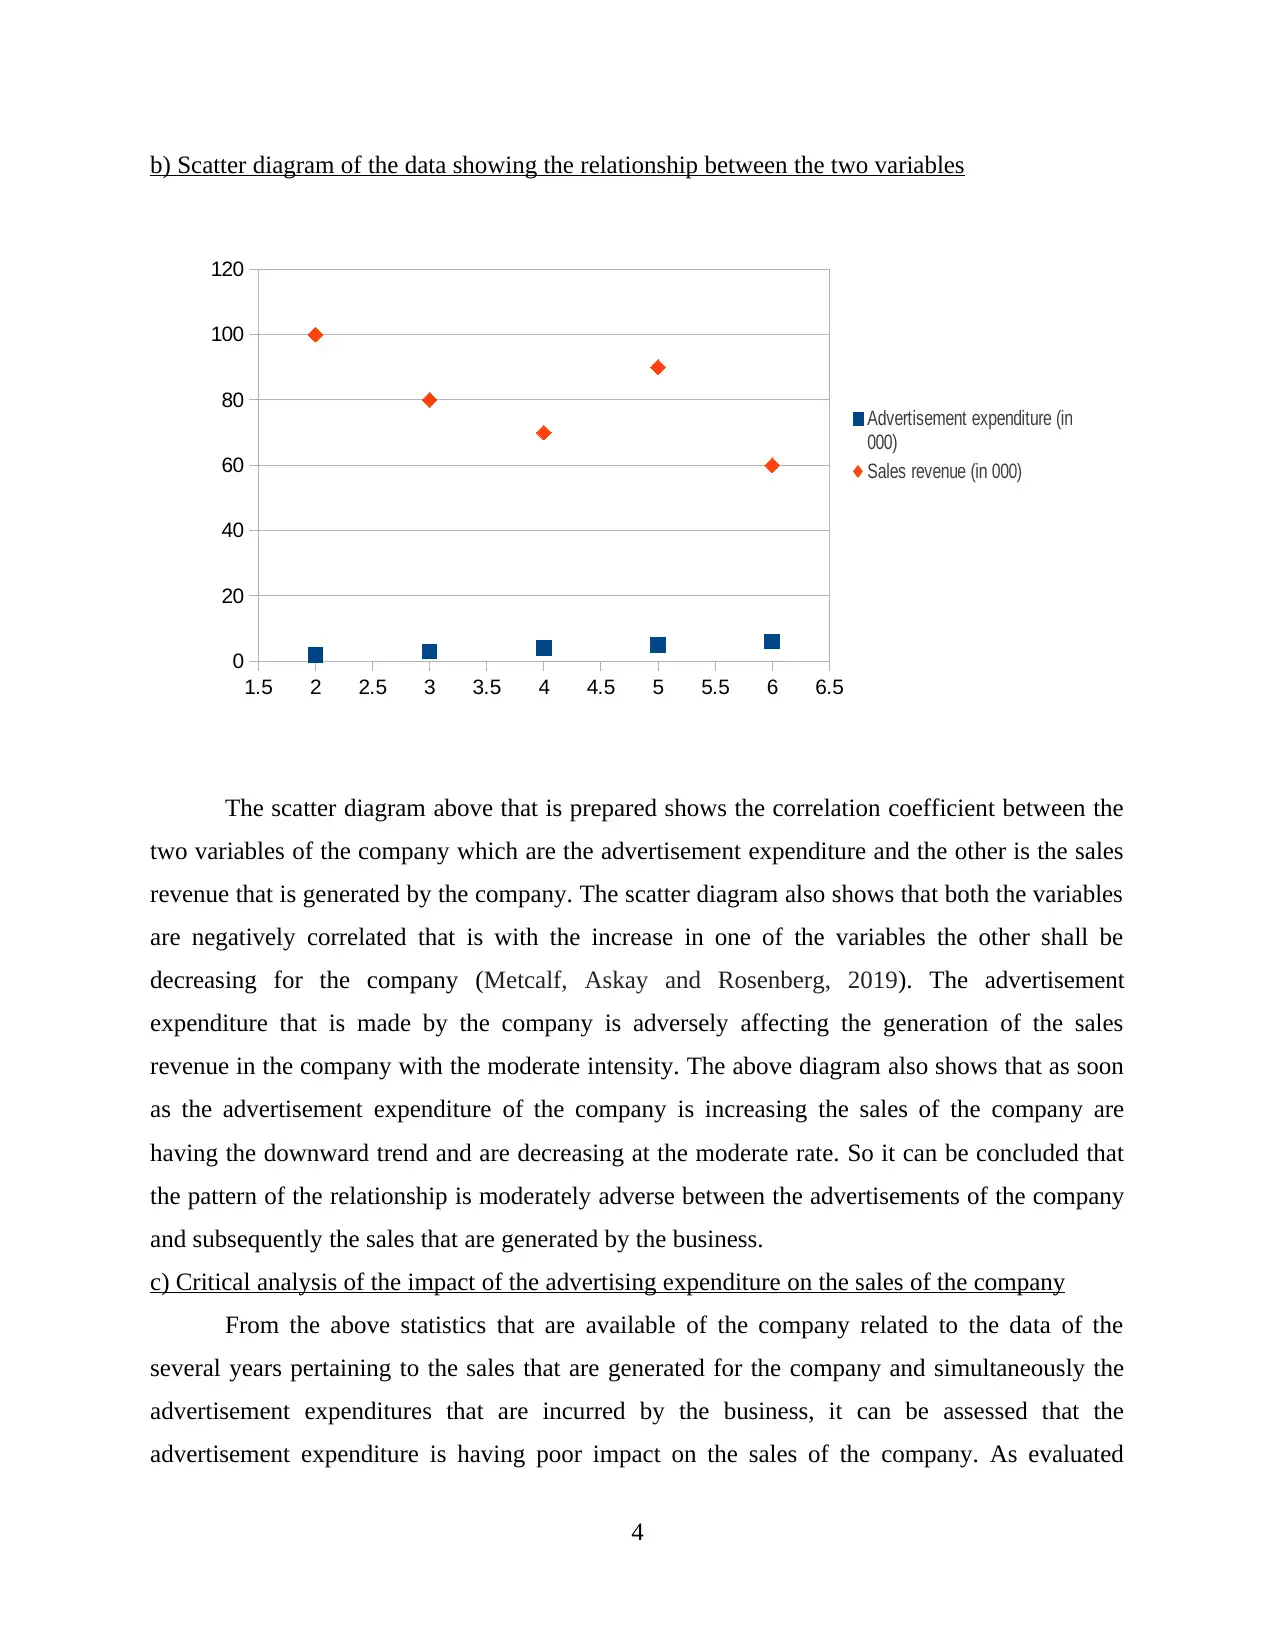
b) Scatter diagram of the data showing the relationship between the two variables
The scatter diagram above that is prepared shows the correlation coefficient between the
two variables of the company which are the advertisement expenditure and the other is the sales
revenue that is generated by the company. The scatter diagram also shows that both the variables
are negatively correlated that is with the increase in one of the variables the other shall be
decreasing for the company (Metcalf, Askay and Rosenberg, 2019). The advertisement
expenditure that is made by the company is adversely affecting the generation of the sales
revenue in the company with the moderate intensity. The above diagram also shows that as soon
as the advertisement expenditure of the company is increasing the sales of the company are
having the downward trend and are decreasing at the moderate rate. So it can be concluded that
the pattern of the relationship is moderately adverse between the advertisements of the company
and subsequently the sales that are generated by the business.
c) Critical analysis of the impact of the advertising expenditure on the sales of the company
From the above statistics that are available of the company related to the data of the
several years pertaining to the sales that are generated for the company and simultaneously the
advertisement expenditures that are incurred by the business, it can be assessed that the
advertisement expenditure is having poor impact on the sales of the company. As evaluated
4
1.5 2 2.5 3 3.5 4 4.5 5 5.5 6 6.5
0
20
40
60
80
100
120
Advertisement expenditure (in
000)
Sales revenue (in 000)
⊘ This is a preview!⊘
Do you want full access?
Subscribe today to unlock all pages.
Trusted by 1+ million students worldwide

above both the variables are negatively related to one another and this is the reason that every
additional unit that is spend by the company on the advertisement expenditure it can be inferred
that the sales of the company are moderately effected, and they face the decreasing trend in the
company (Boughorbel, Jarray and El-Anbari, 2017). Therefore the marketing manager of the
company should know that the marketing and the promotions of the detergent business are not
being effectively undertaken and that is the reason they are not able to contribute that effectively
as they generally do to boost the sales of the company successfully for the company.
It can be assessed that either the advertisements are being done for the products that are
already outdated, not using the latest technology, does not meet the tastes and preferences of the
customers and also may be using the wrong platforms to promote the products that are not
availing any benefits for the company. These are some reasons that the company might not be
able to benefit from the advertisement expenditures that they make for the sales and revenue
generation of the company.
The marketing manager in the company can gain the competitive advantage and generate
the better revenues and the profitability for the company through applying the right marketing
tactics and not doing any of the wasteful expenditures. Since currently it can be assessed that
digital platforms are being commonly applied for the promotional activities in the various
companies like the search engine optimization, optimized website of the company, internet ads
and the social media applications of the company. These have the wide reach in no real time and
that is the reason that the coverage of the company increases in terms of generating the revenues
for the company. Apart from that it can also be ascertained that may be the company requires
more funds in updating the existing technology or making the investments in the new investment
alternatives instead of the aggressive advertisement (Chicco and Jurman, 2020). So the manager
should build the strategy for the company effectively such that there is no gap in the company
and amount spend by the company contributes to its success and market growth.
So it can be assessed that the marketing manager of the company must review the
existing marketing strategy of making the aggressive advertisements. It should rather focus on
the several other proposals of making the expenditures in the company so that they can further
increase the sales and the efficiency of conducting the operations of the business.
QUESTION- 3
Profit statement as per the original estimates of the company:-
5
Paraphrase This Document
Need a fresh take? Get an instant paraphrase of this document with our AI Paraphraser
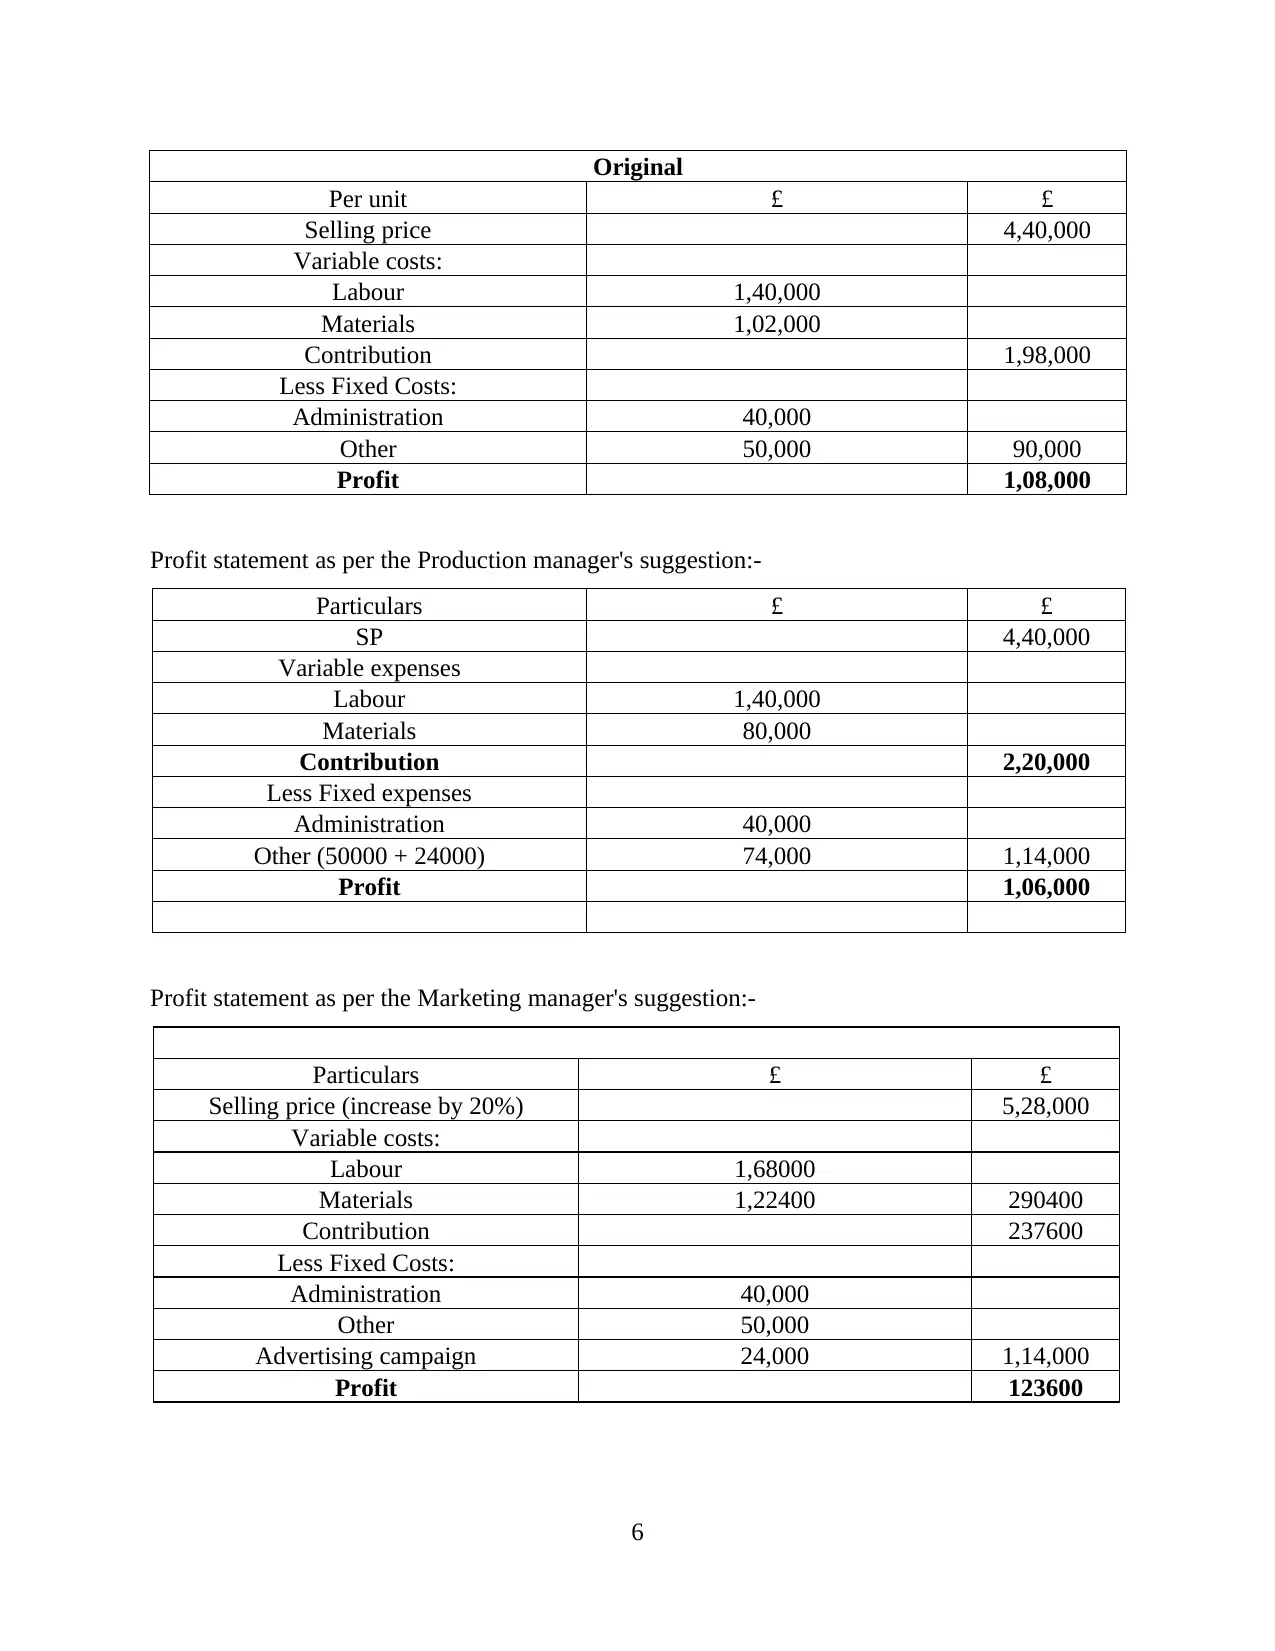
Original
Per unit £ £
Selling price 4,40,000
Variable costs:
Labour 1,40,000
Materials 1,02,000
Contribution 1,98,000
Less Fixed Costs:
Administration 40,000
Other 50,000 90,000
Profit 1,08,000
Profit statement as per the Production manager's suggestion:-
Particulars £ £
SP 4,40,000
Variable expenses
Labour 1,40,000
Materials 80,000
Contribution 2,20,000
Less Fixed expenses
Administration 40,000
Other (50000 + 24000) 74,000 1,14,000
Profit 1,06,000
Profit statement as per the Marketing manager's suggestion:-
Particulars £ £
Selling price (increase by 20%) 5,28,000
Variable costs:
Labour 1,68000
Materials 1,22400 290400
Contribution 237600
Less Fixed Costs:
Administration 40,000
Other 50,000
Advertising campaign 24,000 1,14,000
Profit 123600
6
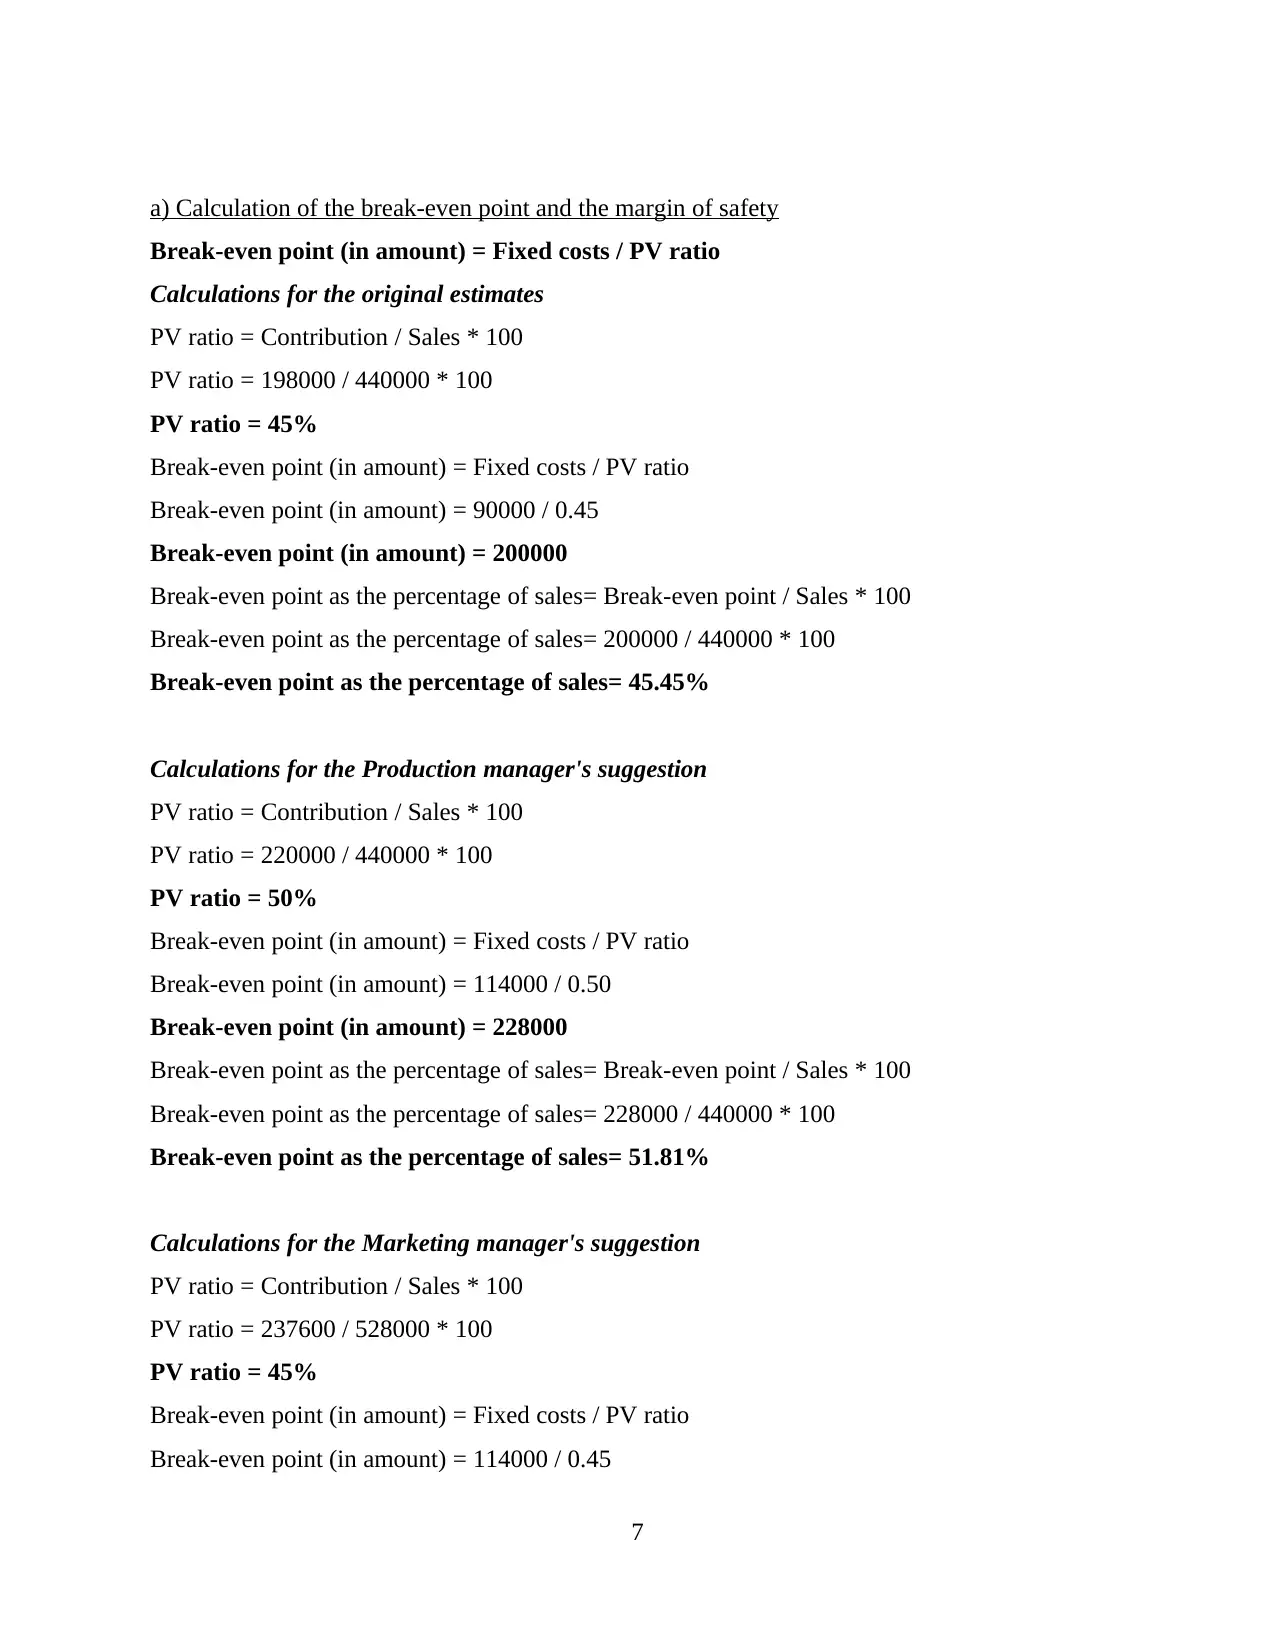
a) Calculation of the break-even point and the margin of safety
Break-even point (in amount) = Fixed costs / PV ratio
Calculations for the original estimates
PV ratio = Contribution / Sales * 100
PV ratio = 198000 / 440000 * 100
PV ratio = 45%
Break-even point (in amount) = Fixed costs / PV ratio
Break-even point (in amount) = 90000 / 0.45
Break-even point (in amount) = 200000
Break-even point as the percentage of sales= Break-even point / Sales * 100
Break-even point as the percentage of sales= 200000 / 440000 * 100
Break-even point as the percentage of sales= 45.45%
Calculations for the Production manager's suggestion
PV ratio = Contribution / Sales * 100
PV ratio = 220000 / 440000 * 100
PV ratio = 50%
Break-even point (in amount) = Fixed costs / PV ratio
Break-even point (in amount) = 114000 / 0.50
Break-even point (in amount) = 228000
Break-even point as the percentage of sales= Break-even point / Sales * 100
Break-even point as the percentage of sales= 228000 / 440000 * 100
Break-even point as the percentage of sales= 51.81%
Calculations for the Marketing manager's suggestion
PV ratio = Contribution / Sales * 100
PV ratio = 237600 / 528000 * 100
PV ratio = 45%
Break-even point (in amount) = Fixed costs / PV ratio
Break-even point (in amount) = 114000 / 0.45
7
Break-even point (in amount) = Fixed costs / PV ratio
Calculations for the original estimates
PV ratio = Contribution / Sales * 100
PV ratio = 198000 / 440000 * 100
PV ratio = 45%
Break-even point (in amount) = Fixed costs / PV ratio
Break-even point (in amount) = 90000 / 0.45
Break-even point (in amount) = 200000
Break-even point as the percentage of sales= Break-even point / Sales * 100
Break-even point as the percentage of sales= 200000 / 440000 * 100
Break-even point as the percentage of sales= 45.45%
Calculations for the Production manager's suggestion
PV ratio = Contribution / Sales * 100
PV ratio = 220000 / 440000 * 100
PV ratio = 50%
Break-even point (in amount) = Fixed costs / PV ratio
Break-even point (in amount) = 114000 / 0.50
Break-even point (in amount) = 228000
Break-even point as the percentage of sales= Break-even point / Sales * 100
Break-even point as the percentage of sales= 228000 / 440000 * 100
Break-even point as the percentage of sales= 51.81%
Calculations for the Marketing manager's suggestion
PV ratio = Contribution / Sales * 100
PV ratio = 237600 / 528000 * 100
PV ratio = 45%
Break-even point (in amount) = Fixed costs / PV ratio
Break-even point (in amount) = 114000 / 0.45
7
⊘ This is a preview!⊘
Do you want full access?
Subscribe today to unlock all pages.
Trusted by 1+ million students worldwide
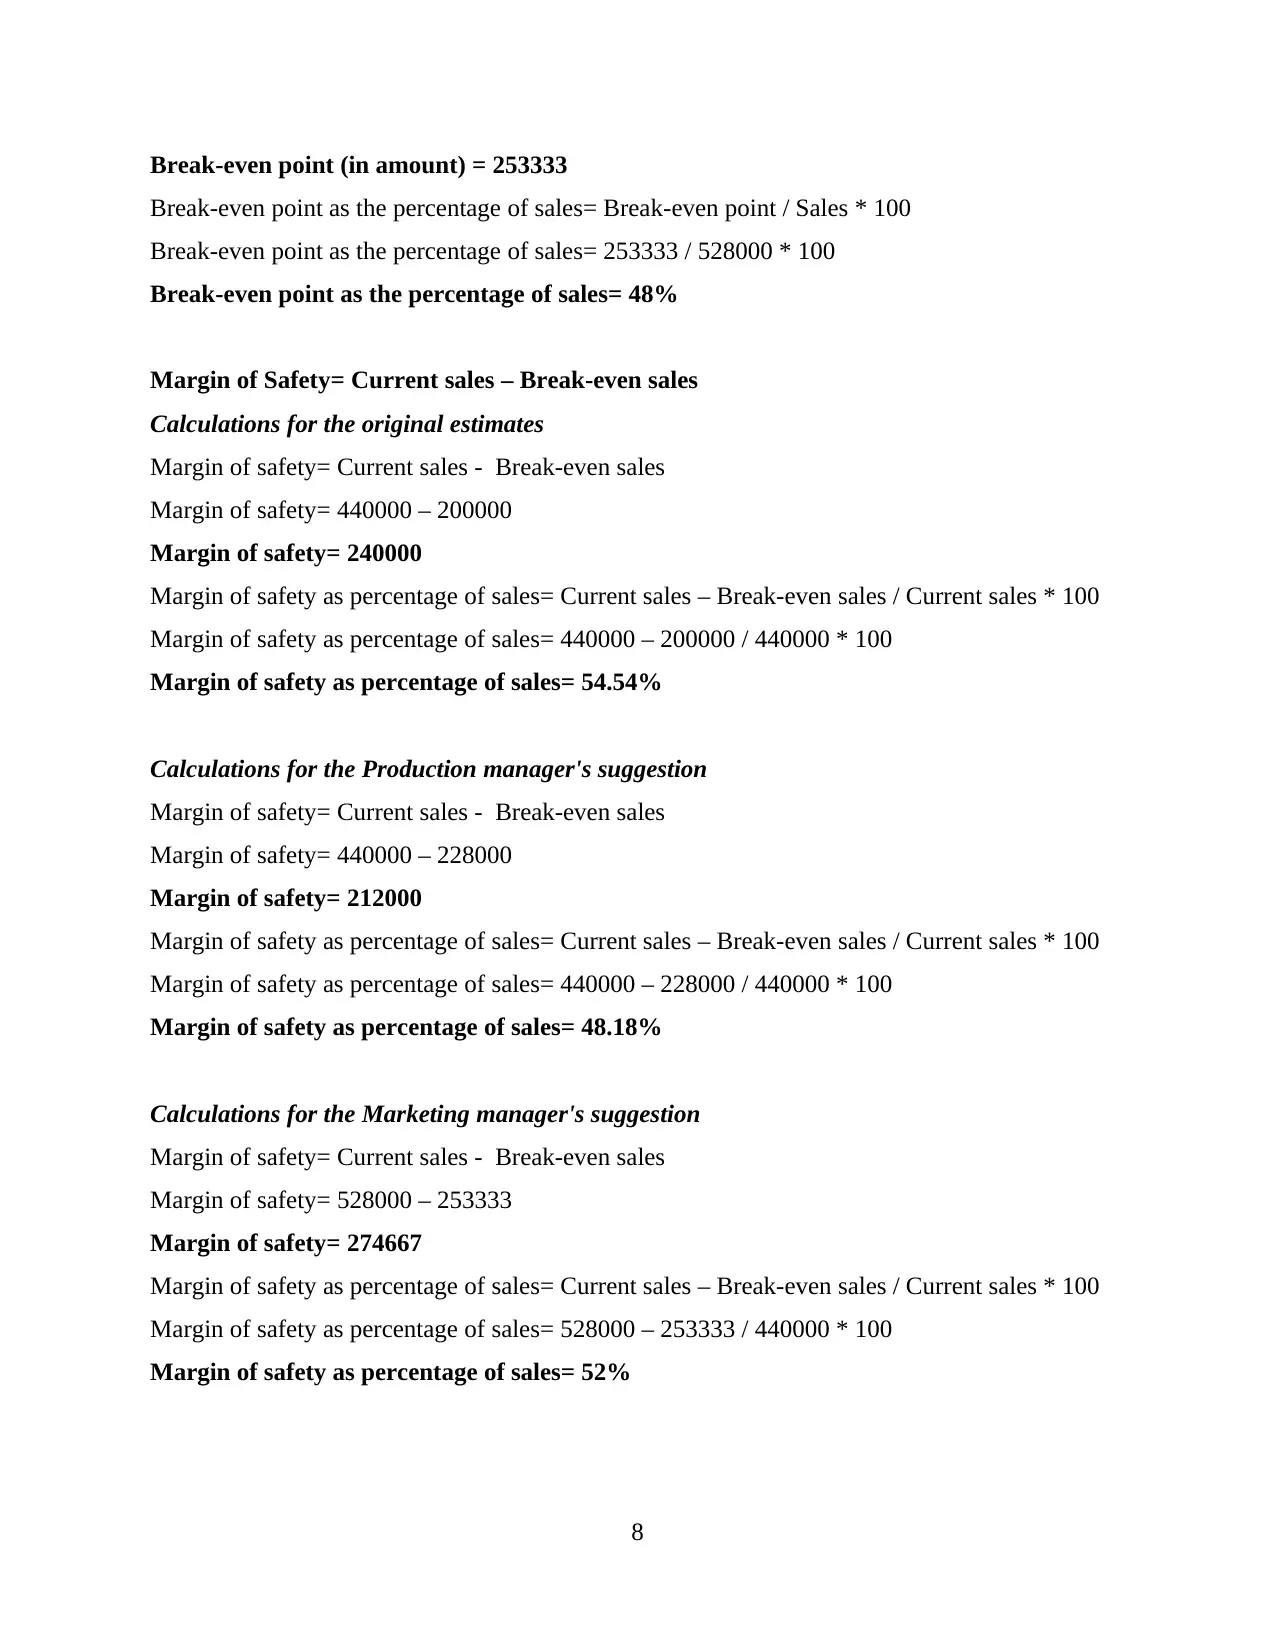
Break-even point (in amount) = 253333
Break-even point as the percentage of sales= Break-even point / Sales * 100
Break-even point as the percentage of sales= 253333 / 528000 * 100
Break-even point as the percentage of sales= 48%
Margin of Safety= Current sales – Break-even sales
Calculations for the original estimates
Margin of safety= Current sales - Break-even sales
Margin of safety= 440000 – 200000
Margin of safety= 240000
Margin of safety as percentage of sales= Current sales – Break-even sales / Current sales * 100
Margin of safety as percentage of sales= 440000 – 200000 / 440000 * 100
Margin of safety as percentage of sales= 54.54%
Calculations for the Production manager's suggestion
Margin of safety= Current sales - Break-even sales
Margin of safety= 440000 – 228000
Margin of safety= 212000
Margin of safety as percentage of sales= Current sales – Break-even sales / Current sales * 100
Margin of safety as percentage of sales= 440000 – 228000 / 440000 * 100
Margin of safety as percentage of sales= 48.18%
Calculations for the Marketing manager's suggestion
Margin of safety= Current sales - Break-even sales
Margin of safety= 528000 – 253333
Margin of safety= 274667
Margin of safety as percentage of sales= Current sales – Break-even sales / Current sales * 100
Margin of safety as percentage of sales= 528000 – 253333 / 440000 * 100
Margin of safety as percentage of sales= 52%
8
Paraphrase This Document
Need a fresh take? Get an instant paraphrase of this document with our AI Paraphraser
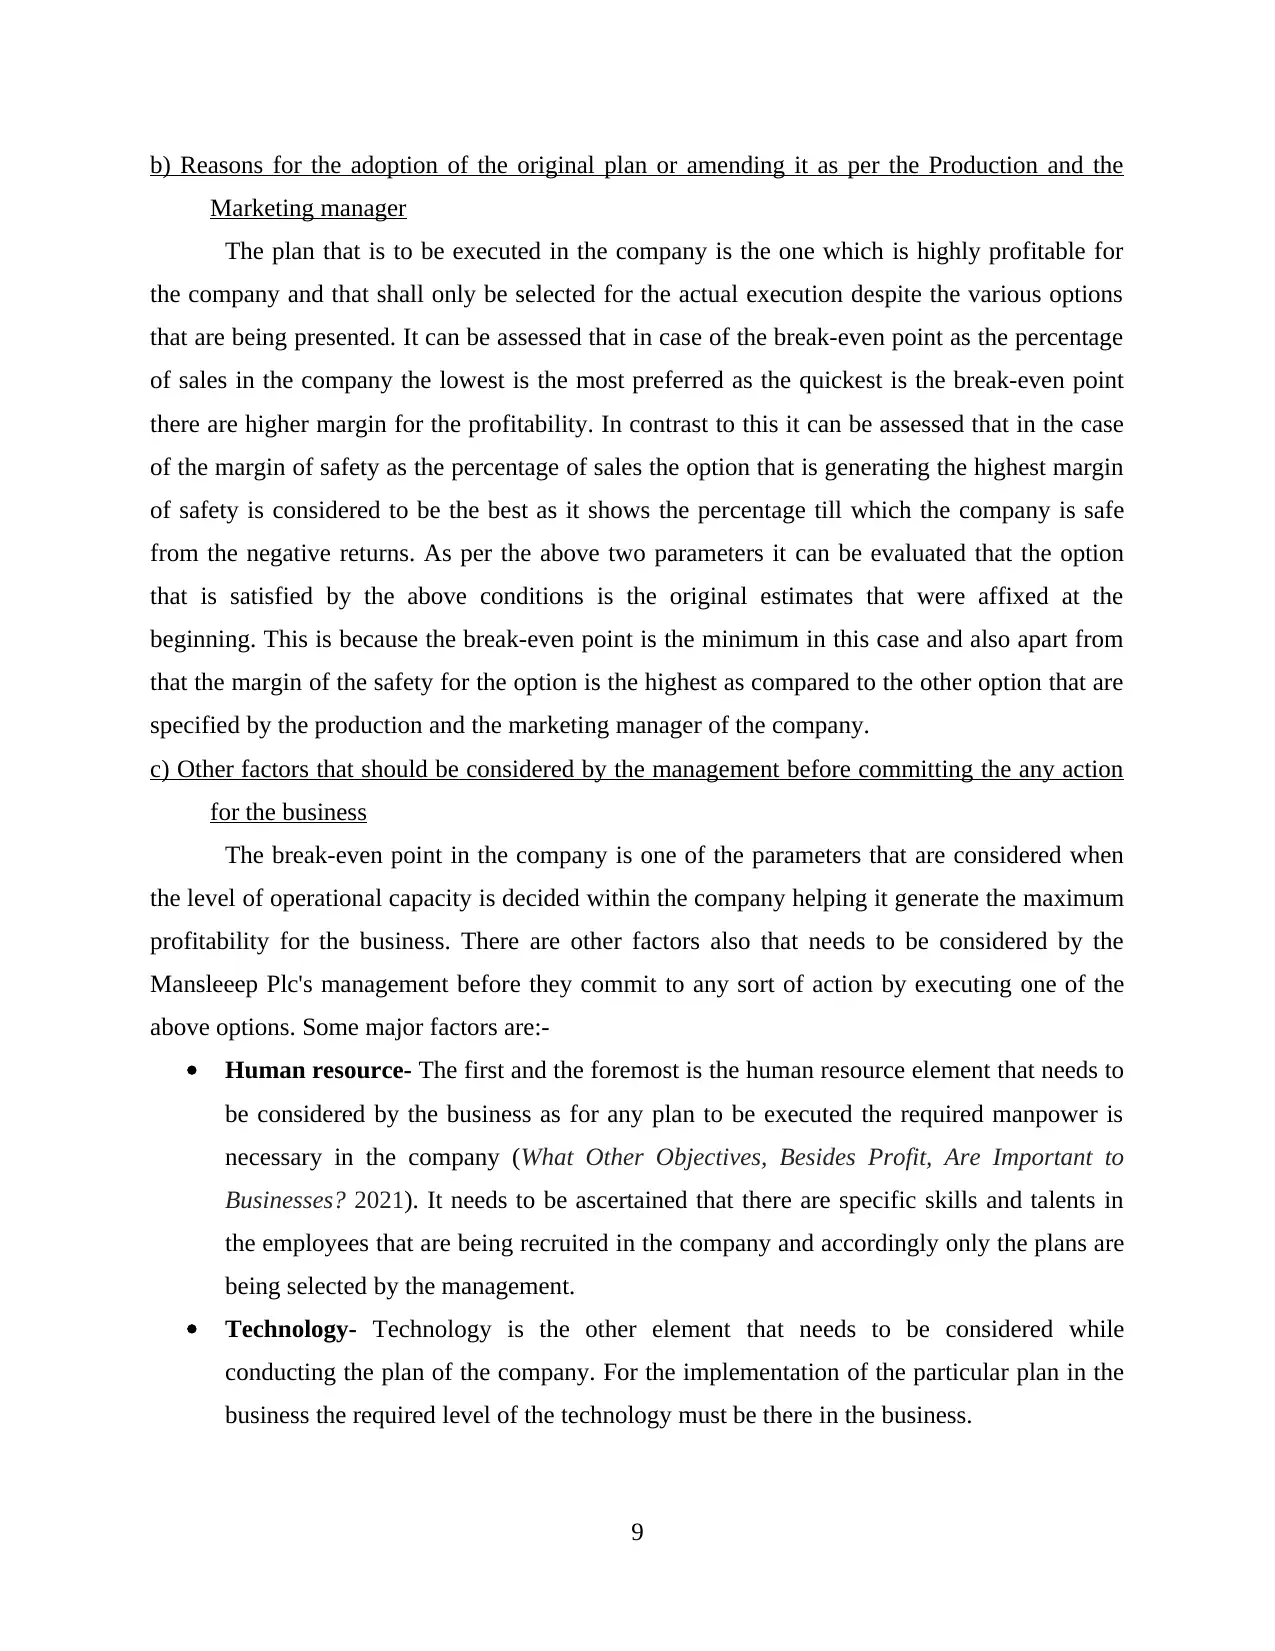
b) Reasons for the adoption of the original plan or amending it as per the Production and the
Marketing manager
The plan that is to be executed in the company is the one which is highly profitable for
the company and that shall only be selected for the actual execution despite the various options
that are being presented. It can be assessed that in case of the break-even point as the percentage
of sales in the company the lowest is the most preferred as the quickest is the break-even point
there are higher margin for the profitability. In contrast to this it can be assessed that in the case
of the margin of safety as the percentage of sales the option that is generating the highest margin
of safety is considered to be the best as it shows the percentage till which the company is safe
from the negative returns. As per the above two parameters it can be evaluated that the option
that is satisfied by the above conditions is the original estimates that were affixed at the
beginning. This is because the break-even point is the minimum in this case and also apart from
that the margin of the safety for the option is the highest as compared to the other option that are
specified by the production and the marketing manager of the company.
c) Other factors that should be considered by the management before committing the any action
for the business
The break-even point in the company is one of the parameters that are considered when
the level of operational capacity is decided within the company helping it generate the maximum
profitability for the business. There are other factors also that needs to be considered by the
Mansleeep Plc's management before they commit to any sort of action by executing one of the
above options. Some major factors are:-
Human resource- The first and the foremost is the human resource element that needs to
be considered by the business as for any plan to be executed the required manpower is
necessary in the company (What Other Objectives, Besides Profit, Are Important to
Businesses? 2021). It needs to be ascertained that there are specific skills and talents in
the employees that are being recruited in the company and accordingly only the plans are
being selected by the management.
Technology- Technology is the other element that needs to be considered while
conducting the plan of the company. For the implementation of the particular plan in the
business the required level of the technology must be there in the business.
9
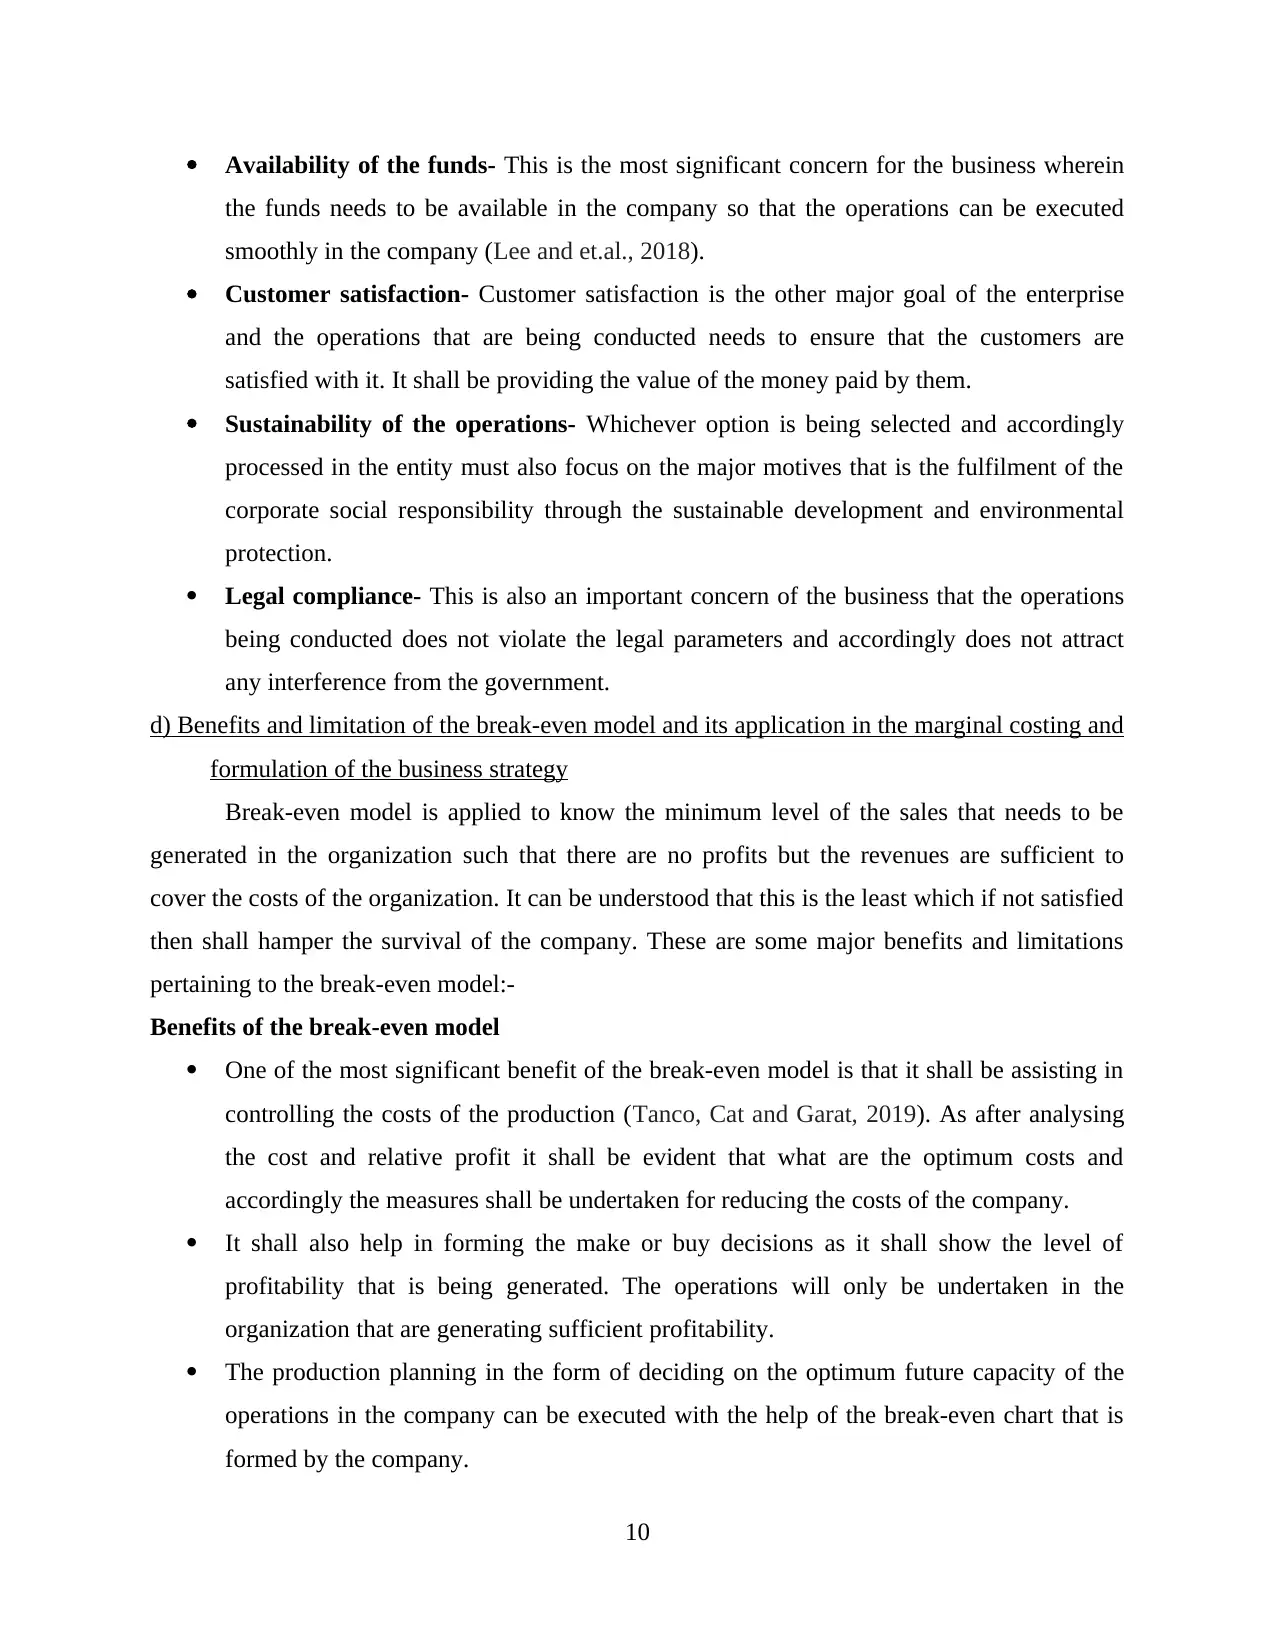
Availability of the funds- This is the most significant concern for the business wherein
the funds needs to be available in the company so that the operations can be executed
smoothly in the company (Lee and et.al., 2018).
Customer satisfaction- Customer satisfaction is the other major goal of the enterprise
and the operations that are being conducted needs to ensure that the customers are
satisfied with it. It shall be providing the value of the money paid by them.
Sustainability of the operations- Whichever option is being selected and accordingly
processed in the entity must also focus on the major motives that is the fulfilment of the
corporate social responsibility through the sustainable development and environmental
protection.
Legal compliance- This is also an important concern of the business that the operations
being conducted does not violate the legal parameters and accordingly does not attract
any interference from the government.
d) Benefits and limitation of the break-even model and its application in the marginal costing and
formulation of the business strategy
Break-even model is applied to know the minimum level of the sales that needs to be
generated in the organization such that there are no profits but the revenues are sufficient to
cover the costs of the organization. It can be understood that this is the least which if not satisfied
then shall hamper the survival of the company. These are some major benefits and limitations
pertaining to the break-even model:-
Benefits of the break-even model
One of the most significant benefit of the break-even model is that it shall be assisting in
controlling the costs of the production (Tanco, Cat and Garat, 2019). As after analysing
the cost and relative profit it shall be evident that what are the optimum costs and
accordingly the measures shall be undertaken for reducing the costs of the company.
It shall also help in forming the make or buy decisions as it shall show the level of
profitability that is being generated. The operations will only be undertaken in the
organization that are generating sufficient profitability.
The production planning in the form of deciding on the optimum future capacity of the
operations in the company can be executed with the help of the break-even chart that is
formed by the company.
10
⊘ This is a preview!⊘
Do you want full access?
Subscribe today to unlock all pages.
Trusted by 1+ million students worldwide
1 out of 15
Related Documents


Your All-in-One AI-Powered Toolkit for Academic Success.
+13062052269
info@desklib.com
Available 24*7 on WhatsApp / Email
![[object Object]](/_next/static/media/star-bottom.7253800d.svg)
Unlock your academic potential
Copyright © 2020–2026 A2Z Services. All Rights Reserved. Developed and managed by ZUCOL.