AUS University, Bachelor of Commerce, MIS171 Assignment 1 Analysis

Verified

Added on  2022/11/13

|6
|684
|398
Report
AI Summary
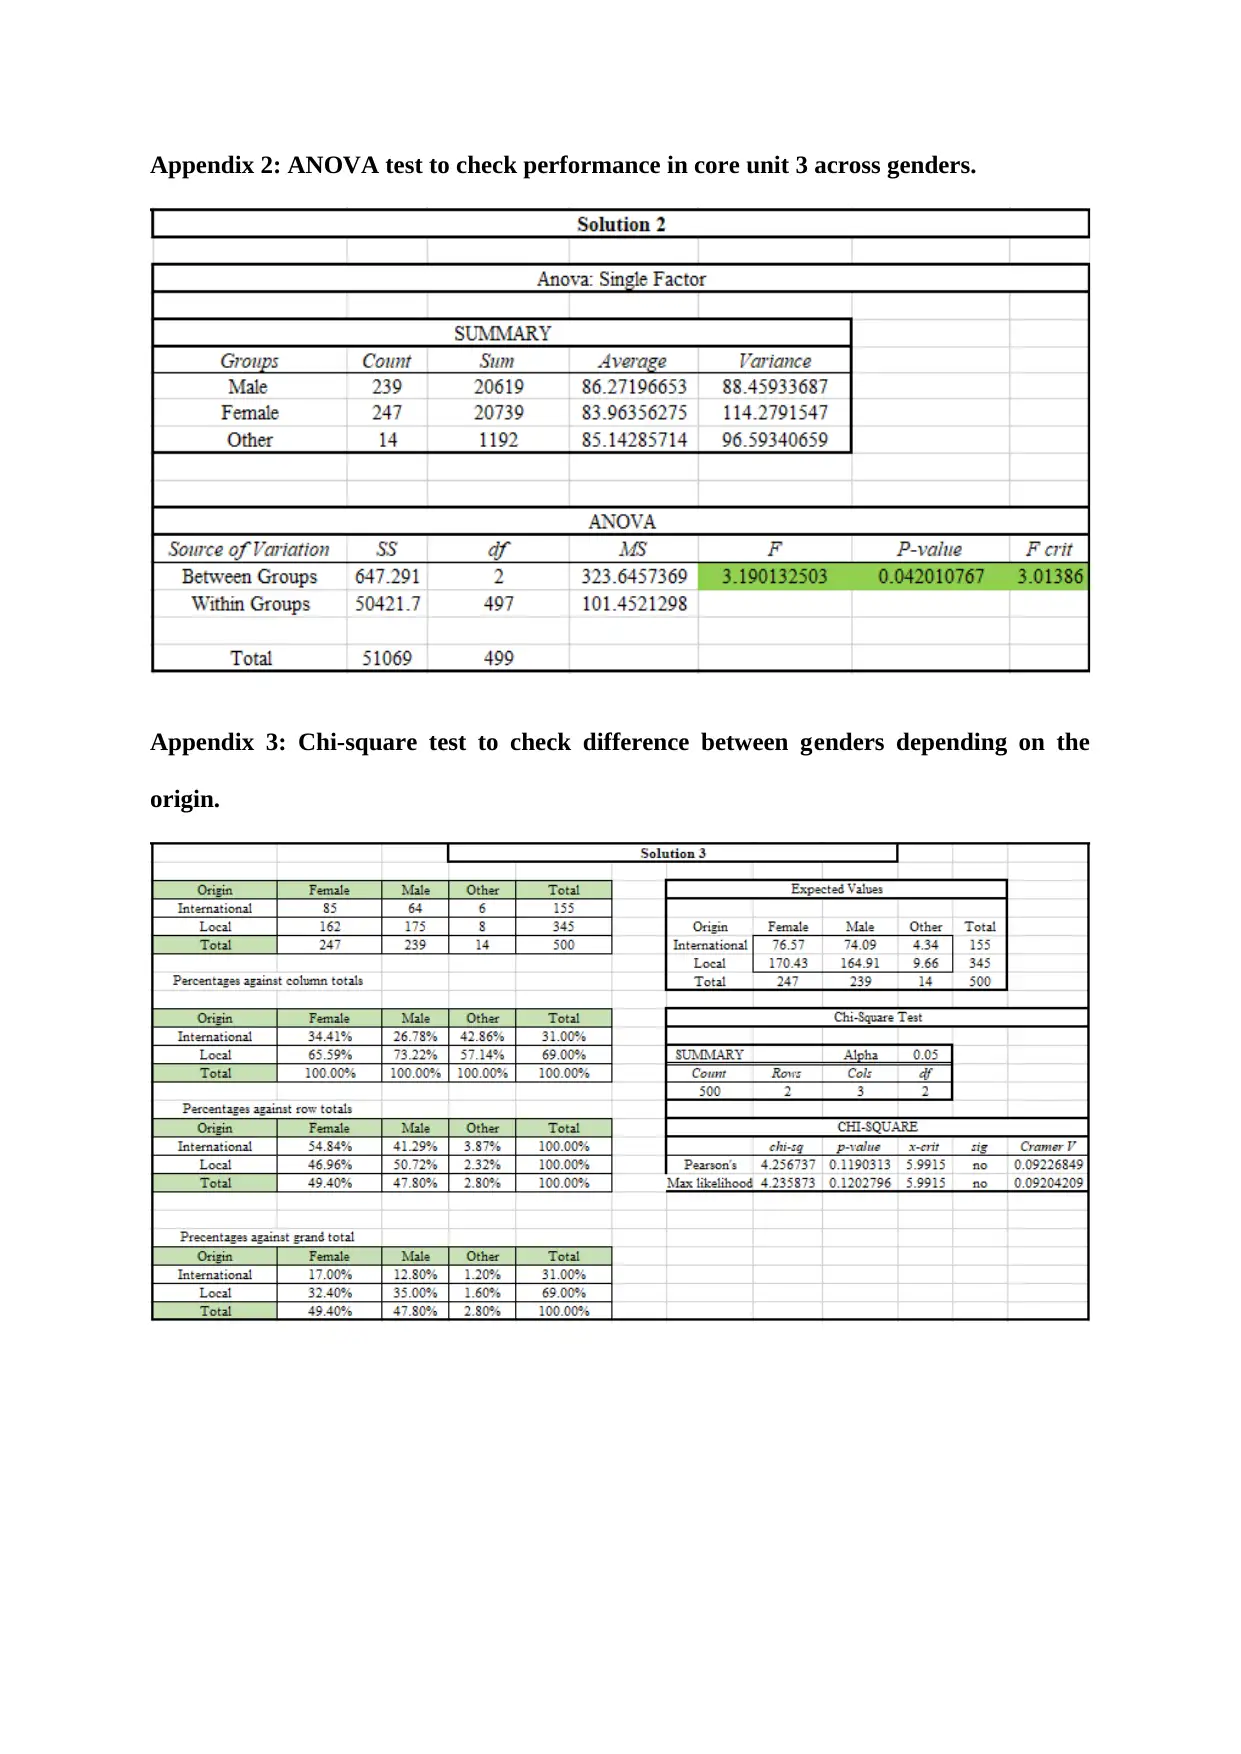
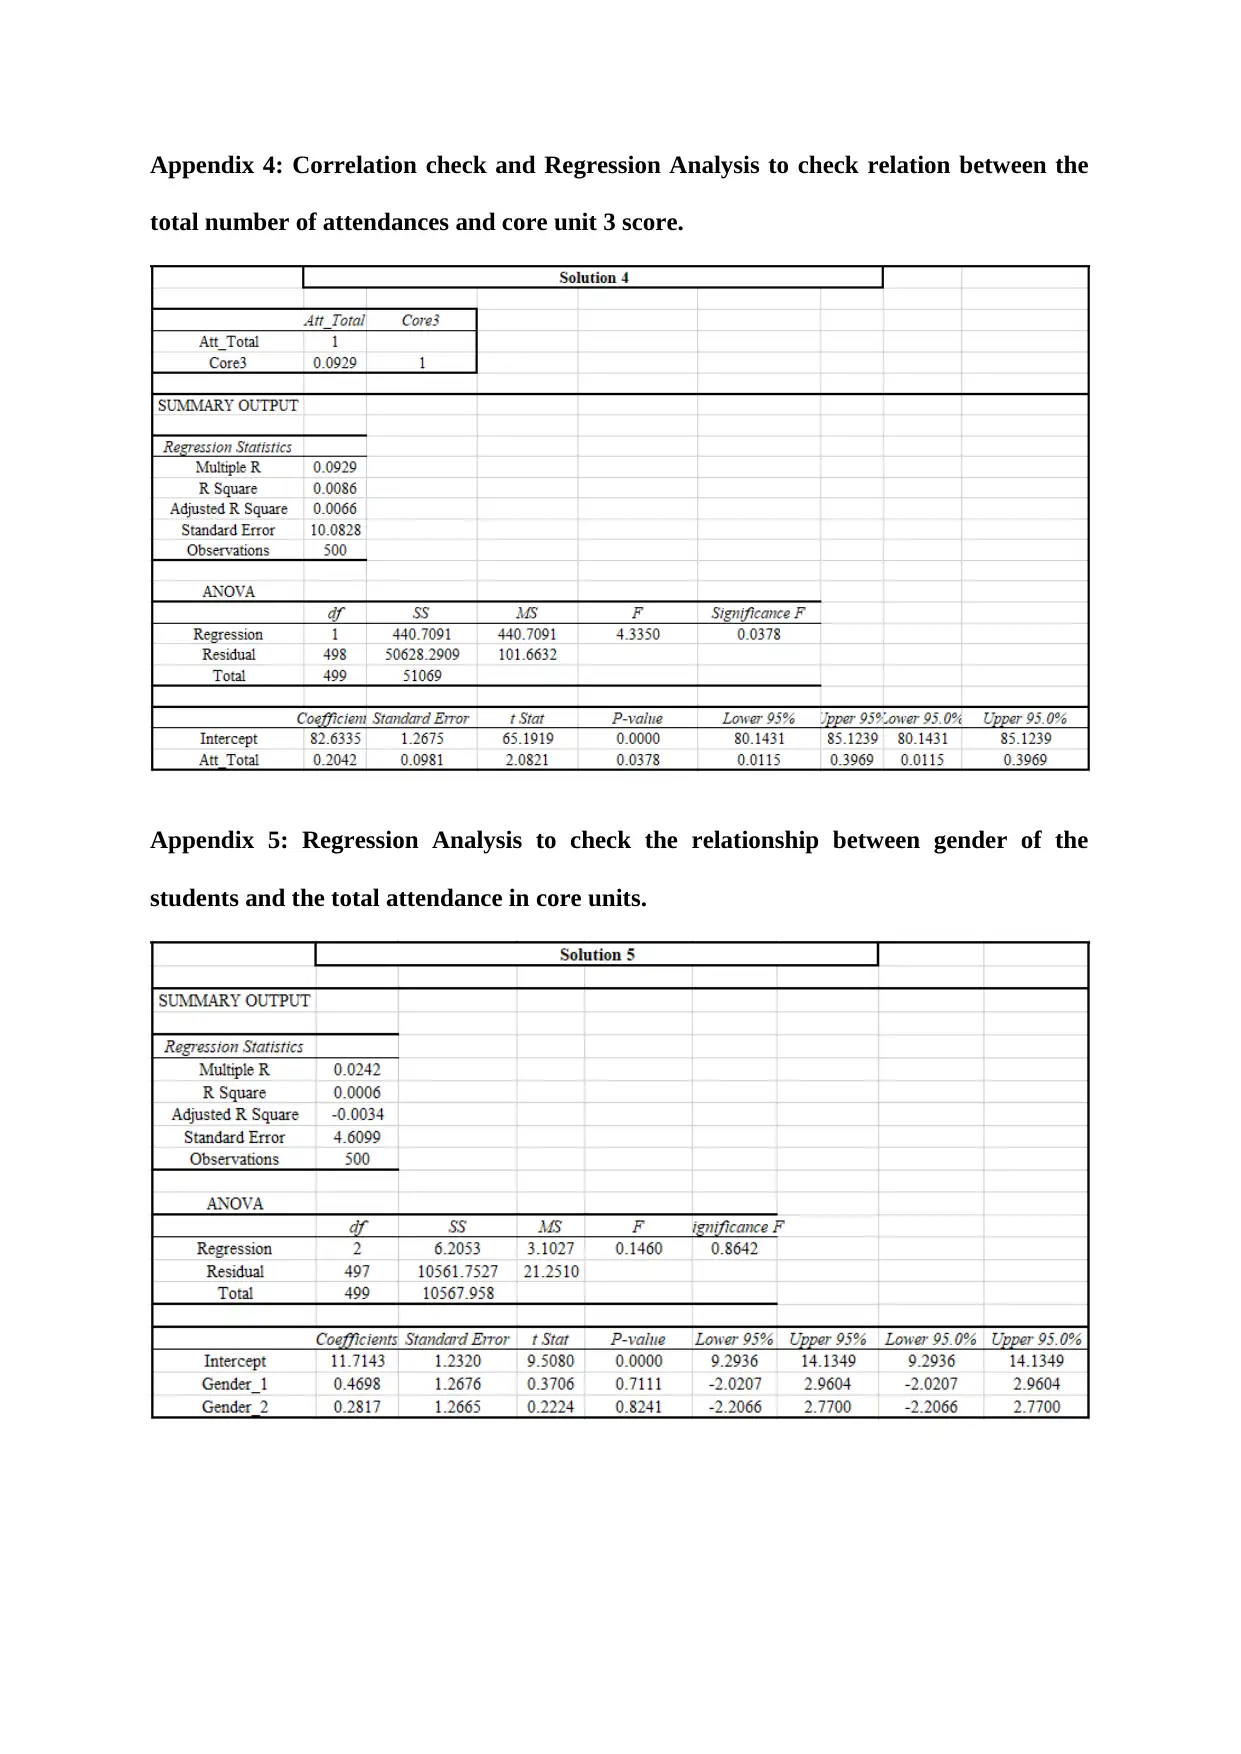
This report analyzes data from the Bachelor of Commerce core units at AUS University, focusing on student performance in MIS171. The analysis includes the average scores for each core unit, highlighting areas where students excel or struggle. The report examines the relationship between gender and performance in core unit 3, finding no significant difference. It also investigates the correlation between student origin, attendance, and core unit scores. The findings reveal a weak correlation between attendance and unit 3 scores and no relationship between gender and attendance. The report concludes that while some core units show high performance, gender and origin have minimal impact on scores and attendance. The appendices provide supporting statistical data including descriptive statistics, histograms, boxplots, ANOVA, Chi-square tests, and regression analyses.
Document Page
To: Angelina Sully
From: Brad Mit
Subject: Analysis of the Bachelor of Commerce core units data
Dear Mrs. Angelina,
I am writing this to you as the academic board asks to investigate in order to understand
how students have performed and if there is any relation between the performance and the
activities of the students. The board has asked to investigate to answer specific questions
regarding the statistics of the performance of the students. The results of the analytical study
is pointed below one by one:
1. The average score for core 1, core 2, core 3, core 4, core 5, core 6, core 7 and core 8
are 62.572, 87.682, 85.1, 70.124, 76.004, 83.556, 60.876 and 68.484 respectively.
Maximum students have scored around the average score for core 1, core 4, core 7
and core 8 and in rest of the core units, maximum students have scored above the
average score.
2. The average score in core unit 3 for male, female and other/prefer not to disclose are
86.27, 83.96 and 85.14 respectively. The statistical test is conducted on the gender of
students and the score in core unit 3 is tested on 500 students out of which 239
students are male, 247 are female and 14 are other/prefer not to disclose. The result of
the test shows that the average performance of students in core unit 3 does not differ
depending on the gender.
3. The findings from the test shows that there is no relation between the proportions of
student’s origin across the gender of the students. This indicates that in the proportion
of origin of the students coming for study in AUS University have no difference
across the gender of the students. The proportion of international and local students is
same on the basis of the gender of the students.
tabler-icon-diamond-filled.svg

Paraphrase This Document

Need a fresh take? Get an instant paraphrase of this document with our AI Paraphraser
Document Page
4. The total attendance is derived by summing up the number of attendance in MIS171
tutorials out of 11 and the number of attendance in MIS171 lectures out of 11. The
test for the relation between the total number of attendances and score in core unit 3
shows that there exists a very weak relation between the score in unit 3 and total
attendance. The score in unit 3 rises a very little amount with a rise in the total
attendance. It is calculated that if total attendance goes up by 1 unit then the score in
unit 3 will rise by 0.2042.
5. The relationship between gender and attendance of core units is statistically tested and
it is found that there is no relation between them. This simply implies that the
attendance of core units does not change or the attendance does not differ on the basis
of the gender of the students. Simply, being a male, female or other student the
attendance is not affected.
The descriptive statistic shows that maximum students are performing exceptionally well
in core unit 2, core unit 3, core unit 5 and core unit 6. The gender of the student has no
influence on scoring in the core unit 3, the proportion of the students’ origin and in the
attendance of core units. This is also found that the total attendance can hardly raise the score
in core unit 3.
Sincerely,
Brad Mit
Document Page
Appendices
Appendix 1: Descriptive statistics, Histogram and Boxplot for each of the 8 core units.
Document Page
tabler-icon-diamond-filled.svg

Paraphrase This Document

Need a fresh take? Get an instant paraphrase of this document with our AI Paraphraser
Document Page
Appendix 2: ANOVA test to check performance in core unit 3 across genders.
Appendix 3: Chi-square test to check difference between genders depending on the
origin.
Document Page
Appendix 4: Correlation check and Regression Analysis to check relation between the
total number of attendances and core unit 3 score.
Appendix 5: Regression Analysis to check the relationship between gender of the
students and the total attendance in core units.
chevron_up_icon
1 out of 6
circle_padding
hide_on_mobile
zoom_out_icon
[object Object]