BUS1BAN Module: Analysis of Smartphone Demand at La Trobe University

Verified

Added on  2020/03/23

|12
|1539
|287
Report
AI Summary
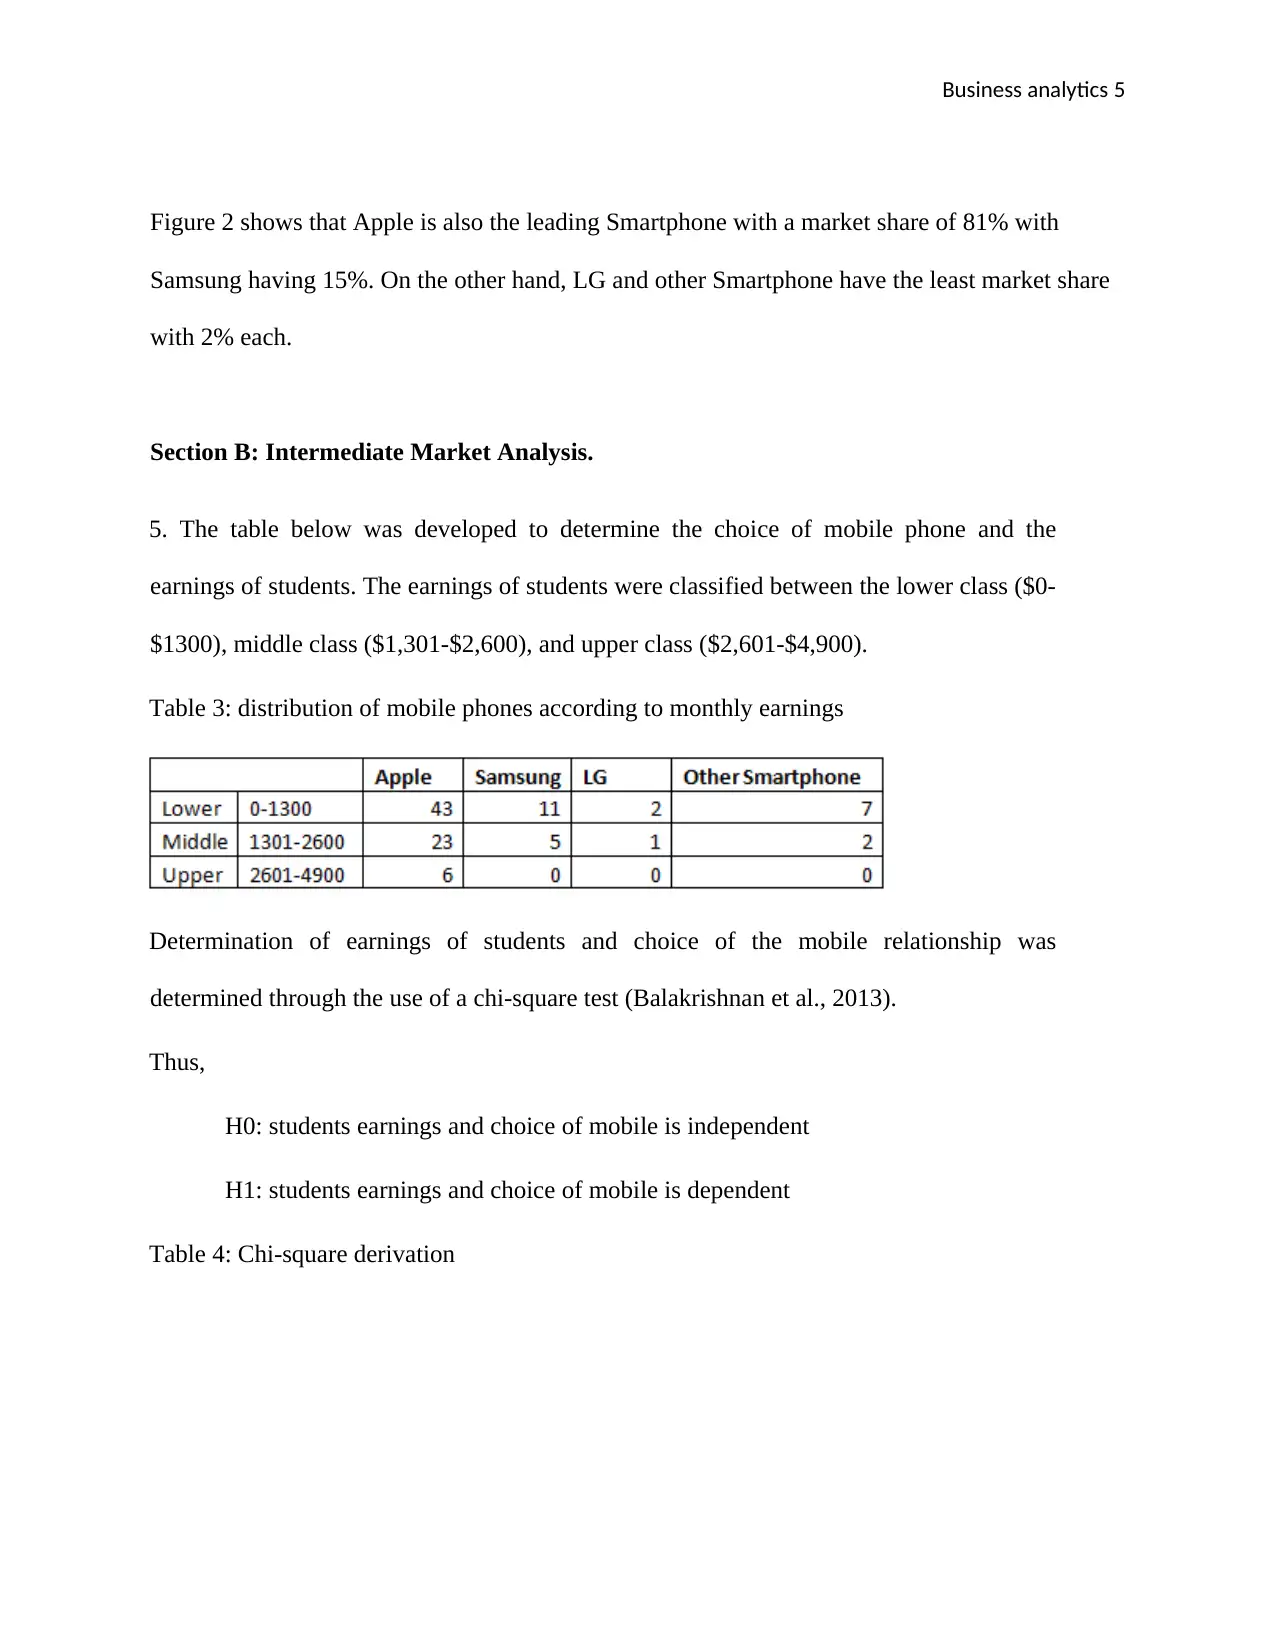
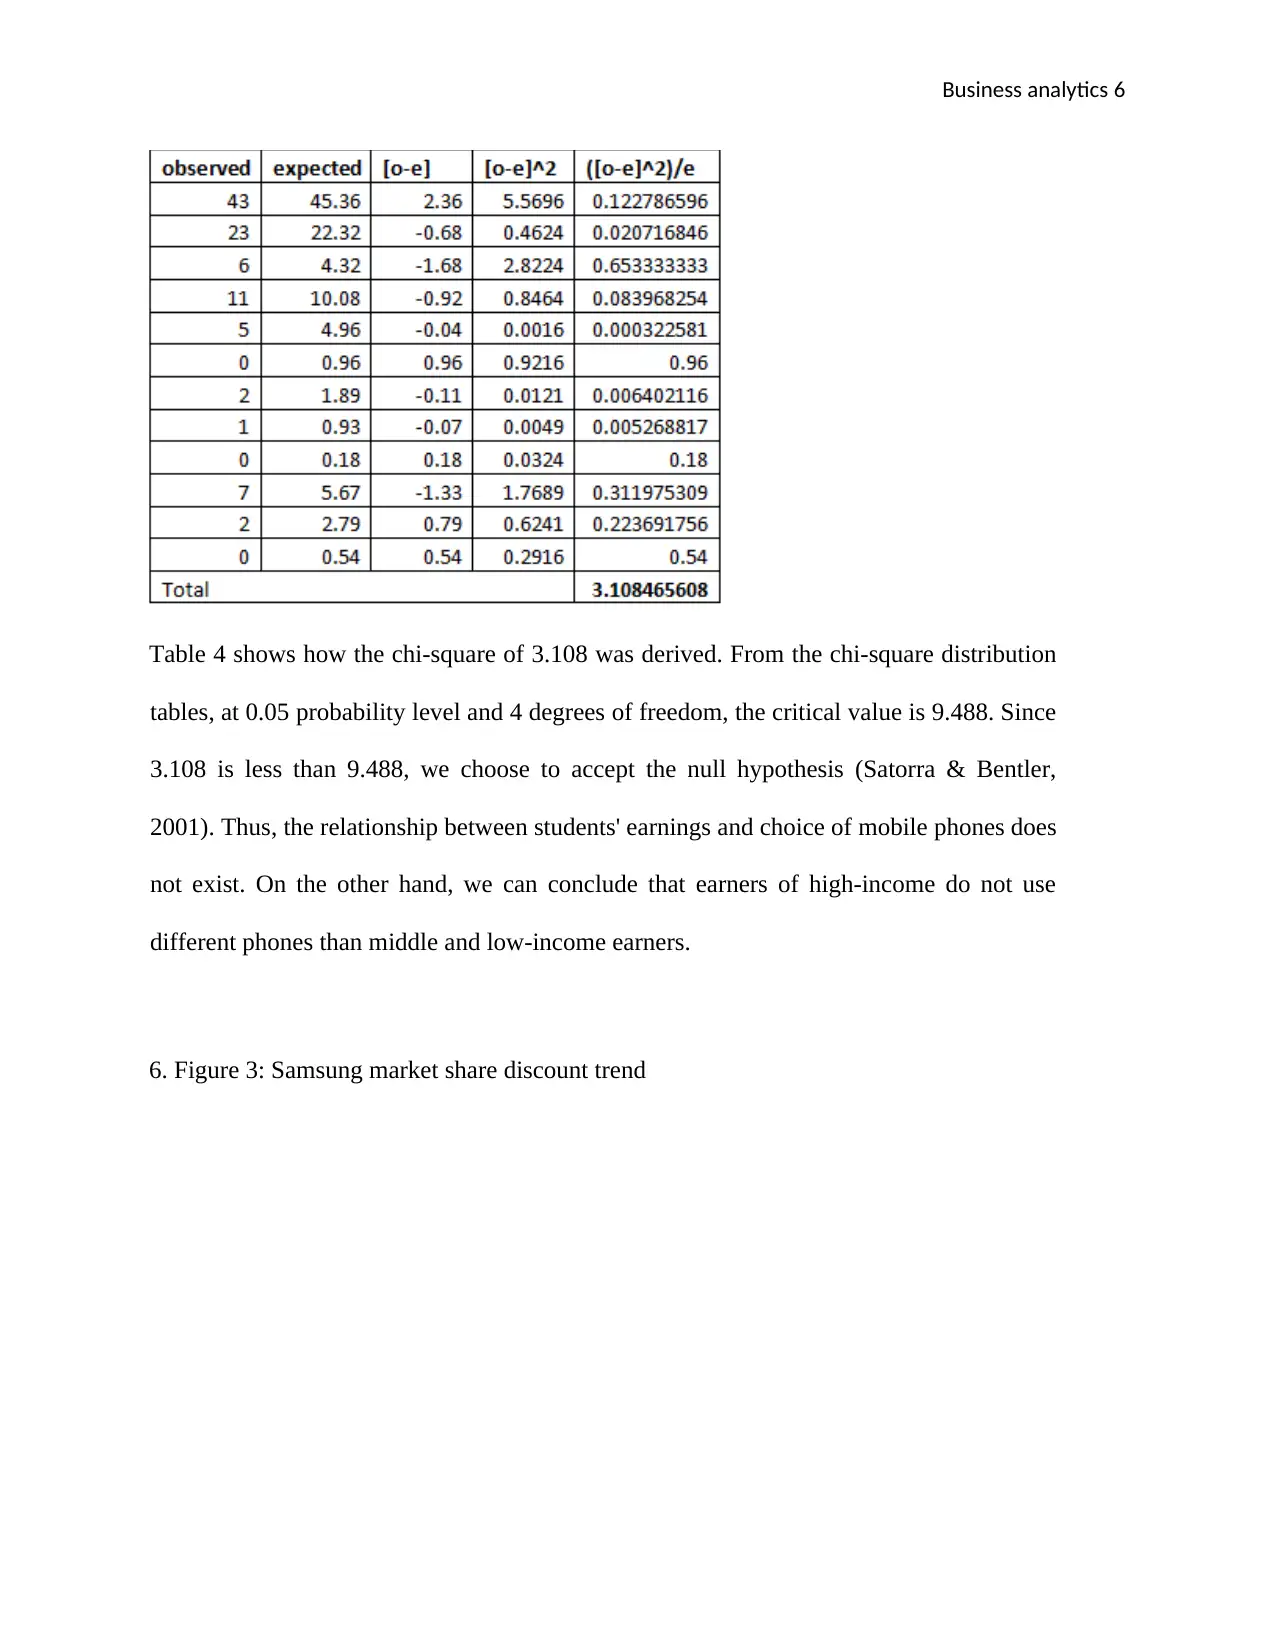
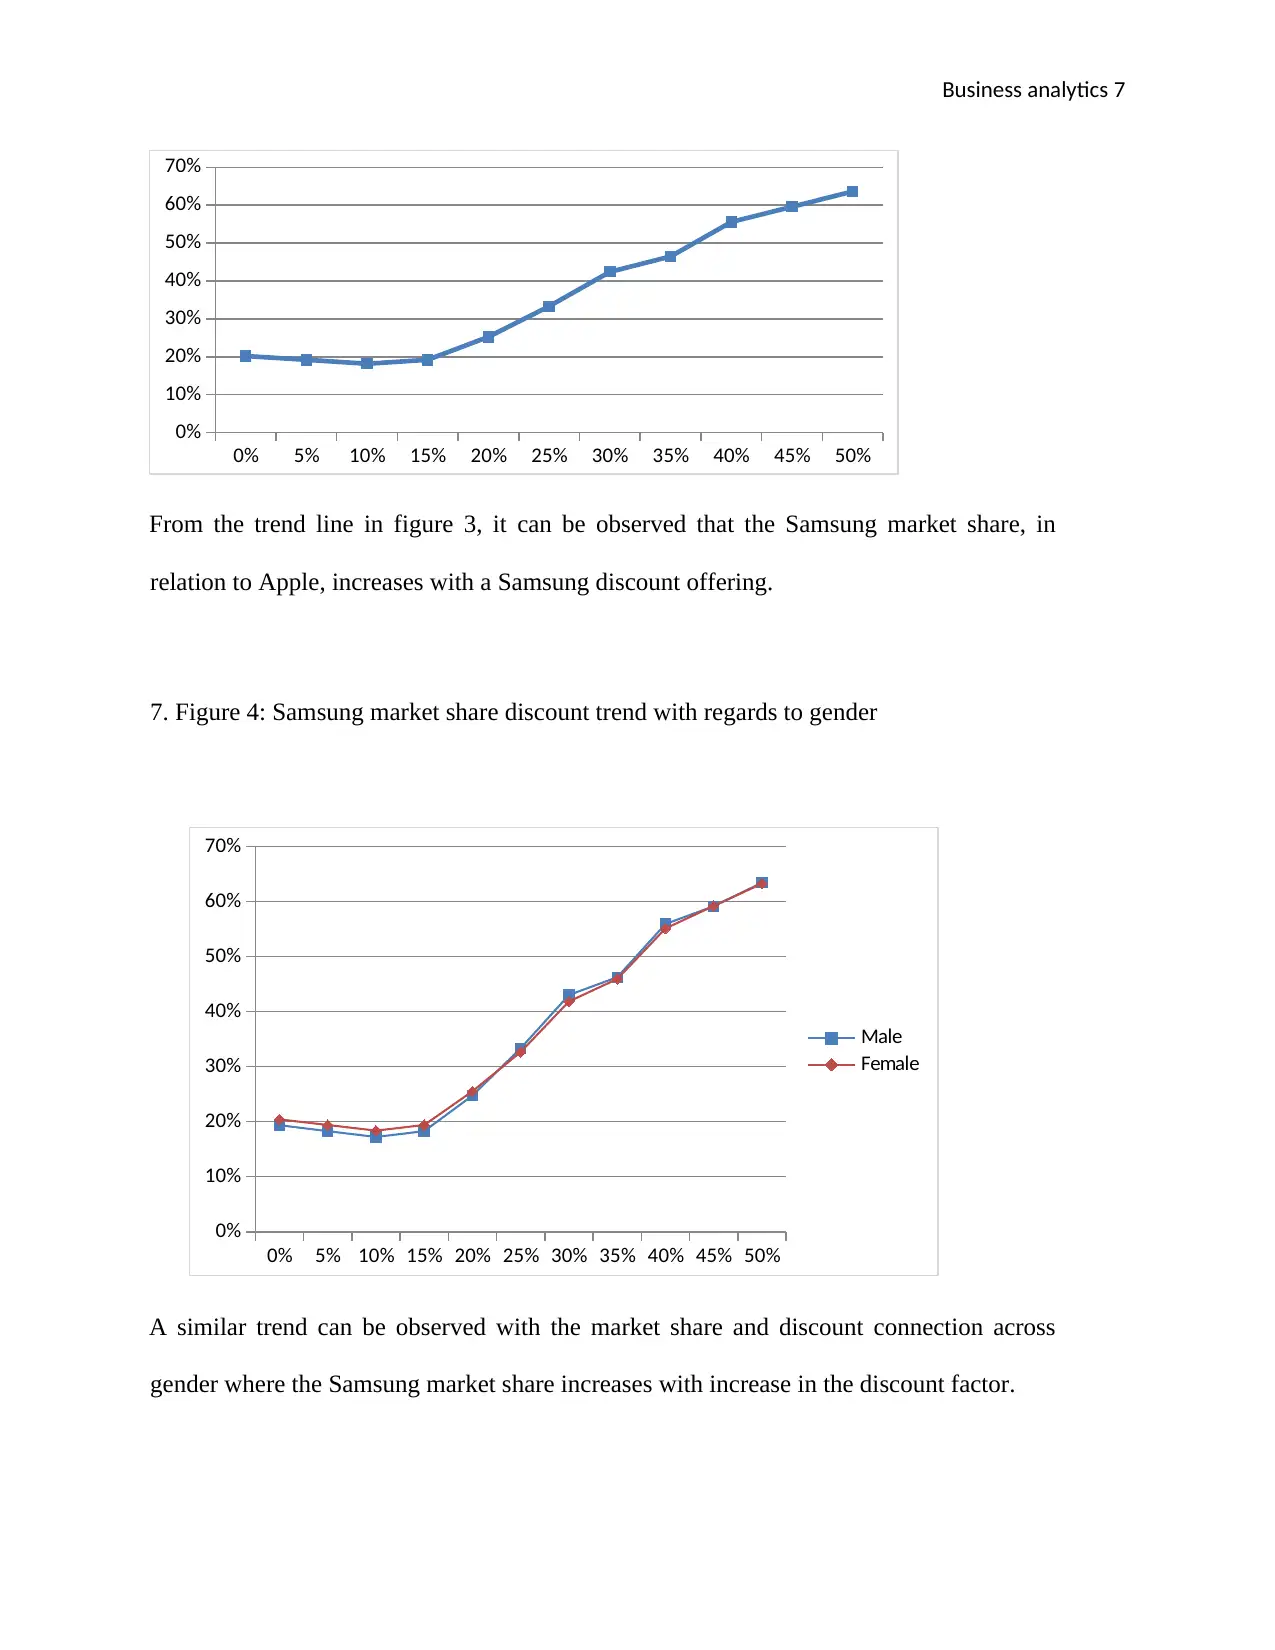
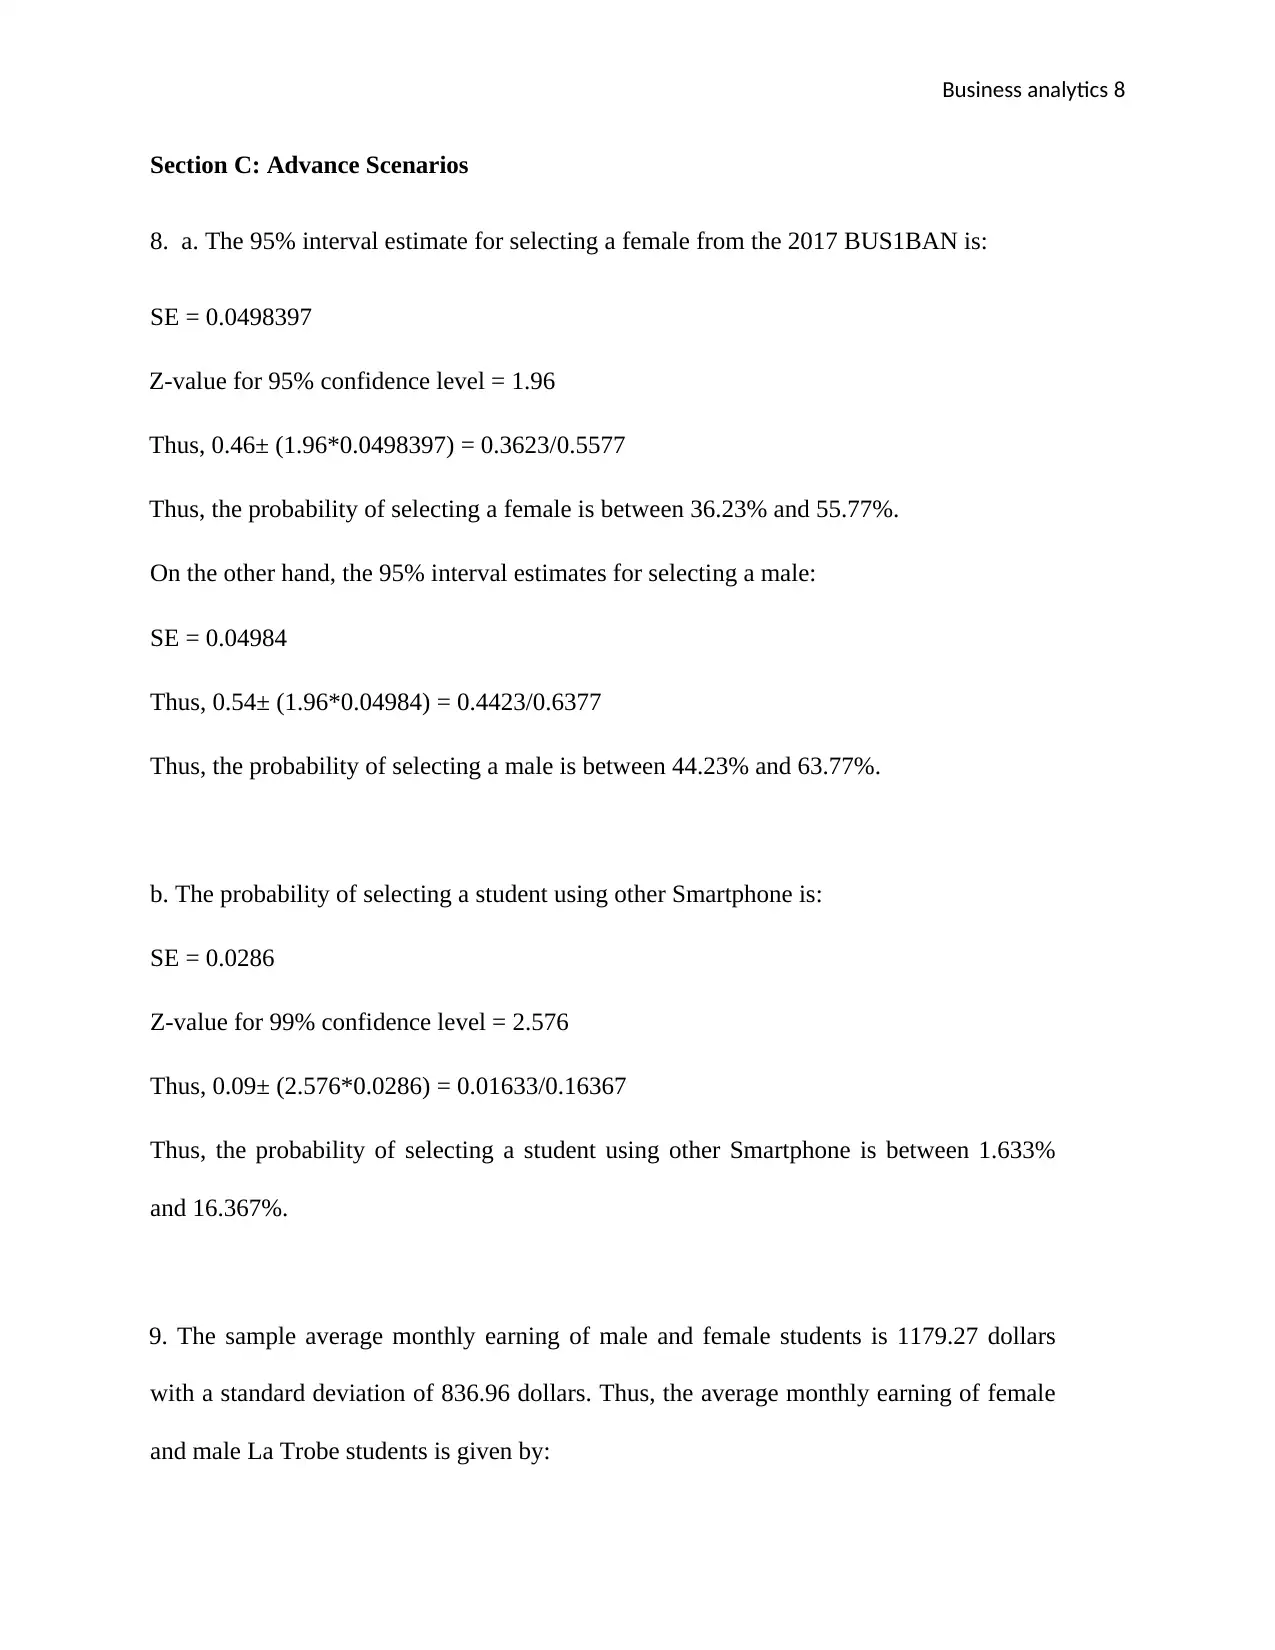
This report presents a business analytics study on smartphone demand among students enrolled in BUS1BAN at La Trobe University. The research utilizes a survey of 100 participants to analyze market share, consumer behavior, and spending habits. Key findings include Apple's dominance in the market across genders, the correlation between Samsung discounts and market share, and the absence of a significant relationship between students' earnings and their choice of smartphones. Statistical analyses, including chi-square tests and confidence interval estimations, are employed to derive these conclusions. The report also examines average monthly bills and earnings, providing insights into the financial aspects of smartphone usage. The study concludes with a discussion of the findings and suggestions for future research, emphasizing the use of random sampling to represent the population and the potential for increasing sample size for enhanced representativeness. The report references various academic sources to support its analysis.
tabler-icon-diamond-filled.svg

Contribute Materials

Your contribution can guide someone’s learning journey. Share your documents today.
Document Page
Running Header: BUSINESS ANALYTICS 1
BUSINESS ANALYTICS
Student's name:
Institution:
Professor's name:
Course Code:
tabler-icon-diamond-filled.svg

Secure Best Marks with AI Grader

Need help grading? Try our AI Grader for instant feedback on your assignments.
Document Page
Business analytics 2
1. Introduction
The following research aims to take an insight into the Smartphone demands at La Trobe
University. The research is driven by the high competition among Smartphone suppliers
who offer a wide variety of Smartphone in the market (Cecere et al., 2015). The research
targeted students at La Trobe University who are enrolled into BUS1BAN. A
questionnaire was developed to capture the data for analysis. The questionnaire contained
both open ended and close ended questions. After the development of the questionnaires,
students were asked to answer to an online survey. From the data collected from the
survey, a random sample of 100 participants was selected. The sample, selected through
excel functions is aimed to represent the whole population and ensure that the analysis is
efficient and effective (Candes & Wakin, 2008).
2. Data Analysis
Section A: Basic Analysis
1. Proportions of male and female
From the data selected number of males was 54 while the number of females was 46. Thus, the
proportion of males in the sample was 0.54 while the proportion of females in the data was 0.46.
2. Average monthly bill
Table 1: Average Bills and Earnings
Document Page
Business analytics 3
From table 1, it is observed that monthly average bill of males was $62.78. On the other hand,
the average monthly bill of females was $71.78.
3. Average monthly earning
From table 1, it is observed that the monthly average earnings of males are
1,234.70 dollars while the average monthly earnings of female students are 1,114.21 dollars.
To determine the relationship between two variables, a correlation analysis was carried out
(Cohen et al., 2013).
Table 2: Correlation analysis
From table 2, it can be seen that earnings and money spent have a relationship. Though the
relationship is positive, it is weak since its correlation is 0.35 (Podobnik & Stanley, 2008).
4. Market share
Figure 1: Male market share
Document Page
Business analytics 4
65%
4%
15%
17%
Apple LG
Other smartphone Samsung
Figure 1 shows that Apple is the leading Smartphone with a market share of 65% with Samsung
having 16% and other Smartphone with 16%. On the other hand, LG has the least market share
with 4%.
Figure 2: Female market share
80%
2%
2%
15%
Apple LG
Other smartphone Samsung
tabler-icon-diamond-filled.svg

Secure Best Marks with AI Grader

Need help grading? Try our AI Grader for instant feedback on your assignments.
Document Page
Business analytics 5
Figure 2 shows that Apple is also the leading Smartphone with a market share of 81% with
Samsung having 15%. On the other hand, LG and other Smartphone have the least market share
with 2% each.
Section B: Intermediate Market Analysis.
5. The table below was developed to determine the choice of mobile phone and the
earnings of students. The earnings of students were classified between the lower class ($0-
$1300), middle class ($1,301-$2,600), and upper class ($2,601-$4,900).
Table 3: distribution of mobile phones according to monthly earnings
Determination of earnings of students and choice of the mobile relationship was
determined through the use of a chi-square test (Balakrishnan et al., 2013).
Thus,
H0: students earnings and choice of mobile is independent
H1: students earnings and choice of mobile is dependent
Table 4: Chi-square derivation
Document Page
Business analytics 6
Table 4 shows how the chi-square of 3.108 was derived. From the chi-square distribution
tables, at 0.05 probability level and 4 degrees of freedom, the critical value is 9.488. Since
3.108 is less than 9.488, we choose to accept the null hypothesis (Satorra & Bentler,
2001). Thus, the relationship between students' earnings and choice of mobile phones does
not exist. On the other hand, we can conclude that earners of high-income do not use
different phones than middle and low-income earners.
6. Figure 3: Samsung market share discount trend
Document Page
Business analytics 7
0% 5% 10% 15% 20% 25% 30% 35% 40% 45% 50%
0%
10%
20%
30%
40%
50%
60%
70%
From the trend line in figure 3, it can be observed that the Samsung market share, in
relation to Apple, increases with a Samsung discount offering.
7. Figure 4: Samsung market share discount trend with regards to gender
0% 5% 10% 15% 20% 25% 30% 35% 40% 45% 50%
0%
10%
20%
30%
40%
50%
60%
70%
Male
Female
A similar trend can be observed with the market share and discount connection across
gender where the Samsung market share increases with increase in the discount factor.
tabler-icon-diamond-filled.svg

Paraphrase This Document

Need a fresh take? Get an instant paraphrase of this document with our AI Paraphraser
Document Page
Business analytics 8
Section C: Advance Scenarios
8. a. The 95% interval estimate for selecting a female from the 2017 BUS1BAN is:
SE = 0.0498397
Z-value for 95% confidence level = 1.96
Thus, 0.46± (1.96*0.0498397) = 0.3623/0.5577
Thus, the probability of selecting a female is between 36.23% and 55.77%.
On the other hand, the 95% interval estimates for selecting a male:
SE = 0.04984
Thus, 0.54± (1.96*0.04984) = 0.4423/0.6377
Thus, the probability of selecting a male is between 44.23% and 63.77%.
b. The probability of selecting a student using other Smartphone is:
SE = 0.0286
Z-value for 99% confidence level = 2.576
Thus, 0.09± (2.576*0.0286) = 0.01633/0.16367
Thus, the probability of selecting a student using other Smartphone is between 1.633%
and 16.367%.
9. The sample average monthly earning of male and female students is 1179.27 dollars
with a standard deviation of 836.96 dollars. Thus, the average monthly earning of female
and male La Trobe students is given by:
Document Page
Business analytics 9
Z-value for 99% confidence interval = 2.576
Thus, 1179.27± (2.576*2.57) = 1172.65/1185.89
Therefore, the average monthly earning is between $1,172.65 and $1,185.89.
10. To test the claim that the US iPhone market share is more than 40%, the following is
done:
H0: P̂>p
H1: P̂≤p
Z = (p-p̂)/√ (p*q)/n
= (0.4-0.72)/√ (0.72*0.28/100) = -7.127
P value of -7.127 is 0.00001
The result is significant at 0.05, 0.1, and 0.001. Thus, we choose to accept the null
hypothesis and conclude that the US market survey claim is also true for La Trobe
students (Aczel & Sounderpandian, 200).
Document Page
Business analytics 10
3. Summary and discussion
From the research analysis, it has been seen that the females tend to spend more though
they have a smaller average monthly earning compared to the males. Regardless of the
gender, Apple is the leader in the market with more than 65% market share in both gender
scenarios.
On the other hand, there is no relationship between the student's earnings and the type of
mobile phone used. The competitive advantage of Samsung is based on the discount
offered. The market survey carried out for the US market share has also been proved that
it can be used for La Trobe students.
The sampling method used in the research was a random sampling. Thus, it represents the whole
population (Britton et al., 2006). To make the research more efficient, the researcher can opt to
increase the sample size to make it more representative of the whole population.
tabler-icon-diamond-filled.svg

Secure Best Marks with AI Grader

Need help grading? Try our AI Grader for instant feedback on your assignments.
Document Page
Business analytics 11
References:
Aczel, A. D., & Sounderpandian, J. (2002). Complete business statistics (Vol. 1).
McGraw-Hill/Irwin.
Balakrishnan, N., Voinov, V., & Nikulin, M. S. (2013). Chi-squared goodness of fit tests
with applications. Academic Press.
Britton, T., Deijfen, M., & Martin-Löf, A. (2006). Generating simple random graphs with
prescribed degree distribution. Journal of Statistical Physics, 124(6), pp.1377-
1397.
Candès, E. J., & Wakin, M. B. (2008). An introduction to compressive sampling. IEEE
signal processing magazine, 25(2), pp.21-30.
Cohen, J., Cohen, P., West, S. G., & Aiken, L. S. (2013). Applied multiple
regression/correlation analysis for the behavioral sciences. Routledge.
Cecere, G., Corrocher, N., & Battaglia, R. D. (2015). Innovation and competition in the
smartphone industry: Is there a dominant design?. Telecommunications
Policy, 39(3), pp.162-175.
Podobnik, B., & Stanley, H. E. (2008). Detrended cross-correlation analysis: a new
method for analyzing two nonstationary time series. Physical review
letters, 100(8), 084102.
Document Page
Business analytics 12
Satorra, A., & Bentler, P. M. (2001). A scaled difference chi-square test statistic for
moment structure analysis. Psychometrika, 66(4), 507-514.
chevron_up_icon
1 out of 12
circle_padding
hide_on_mobile
zoom_out_icon
logo.png

Your All-in-One AI-Powered Toolkit for Academic Success.

Available 24*7 on WhatsApp / Email

[object Object]