Business Analytics Report: Cleveland Employee Data Analysis Findings
VerifiedAdded on 2020/03/28
|7
|914
|39
Report
AI Summary
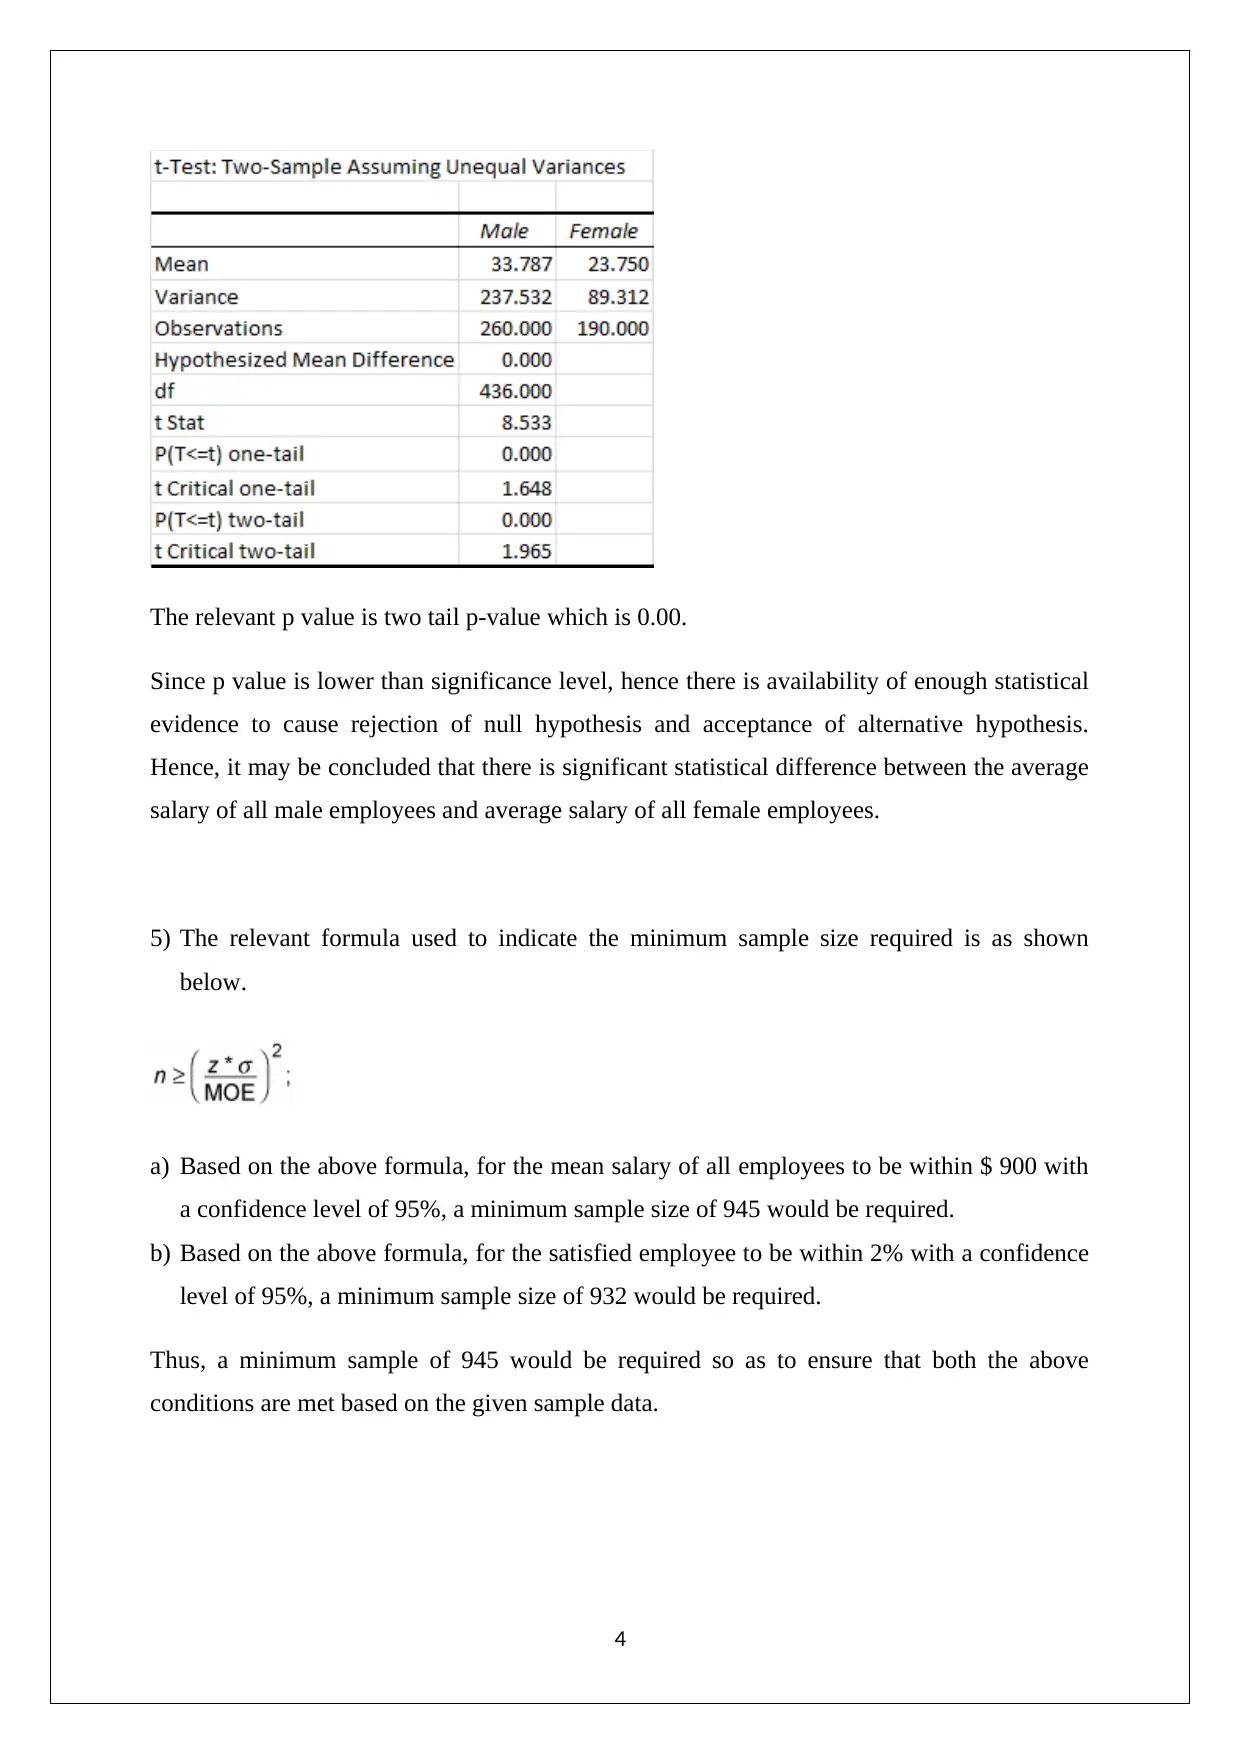
This business analytics report analyzes employee data from Cleveland, focusing on salary levels, employee satisfaction, and gender-based pay differences. The report includes statistical analysis, hypothesis testing, and confidence intervals to assess claims made by senior management regarding employee compensation and satisfaction. Key findings indicate that the senior management overestimates both salary and satisfaction levels, and a statistically significant difference exists between male and female employee salaries. Furthermore, the report calculates the minimum sample size required for future data collection to ensure the accuracy of findings. The report concludes with recommendations for further investigation into potential gender-based pay disparities and their impact on employee satisfaction.

BUSINESS ANALYTICS
MEMORANDUM
STUDENT ID:
[Pick the date]
MEMORANDUM
STUDENT ID:
[Pick the date]
Paraphrase This Document
Need a fresh take? Get an instant paraphrase of this document with our AI Paraphraser

TABLE OF CONTENTS
PART 1: ANALYSIS.................................................................................................................1
PART 2: MEMORANDUM......................................................................................................4
Introduction............................................................................................................................4
Analysis..................................................................................................................................4
Conclusion..............................................................................................................................5
1

PART 1: ANALYSIS
1) A) There is a 95% chance that the average salary of all Cleveland employees would lie
between $28,242 and $ 30,857.
B) There is 95% chance that the satisfied employees as a proportion of all Cleveland
employees would lie between 0.8623 and 0.9199.
2) The requisite hypotheses to be tested are highlighted below.
Null Hypothesis: μ = $ 28,500
Alternative Hypothesis: μ > $ 28,500
The level of significance is taken as 5%
The relevant test is right tail one sample t test
The excel output is indicated below.
Since p value is higher than significance level, hence there is non-availability of enough
statistical evidence to cause rejection of null hypothesis and acceptance of alternative
hypothesis. Hence, it may be concluded that the claim of the senior management regarding
employees earning more than the industry average is not correct.
3) The hypothesis to be tested is listed below.
2
⊘ This is a preview!⊘
Do you want full access?
Subscribe today to unlock all pages.

Trusted by 1+ million students worldwide

Null Hypothesis: p = 0.92
Alternative Hypothesis: p > 0.92
The level of significance is taken as 5%
The excel output is indicated below.
The p value is 0.9879.
Since p value is higher than significance level, hence there is non-availability of enough
statistical evidence to cause rejection of null hypothesis and acceptance of alternative
hypothesis. Hence, it may be concluded that the claim of the senior management regarding
employees satisfaction being atleast 92% is not correct.
4) The relevant hypothesis to be tested is shown below.
Null Hypothesis: μMALE = μFEMALE
Alternative Hypothesis: μMALE ≠ μFEMALE
The applicable level of significance is 5%.
The test to be used is a two tail independent sample t test.
The excel output is indicated below.
3
Paraphrase This Document
Need a fresh take? Get an instant paraphrase of this document with our AI Paraphraser

The relevant p value is two tail p-value which is 0.00.
Since p value is lower than significance level, hence there is availability of enough statistical
evidence to cause rejection of null hypothesis and acceptance of alternative hypothesis.
Hence, it may be concluded that there is significant statistical difference between the average
salary of all male employees and average salary of all female employees.
5) The relevant formula used to indicate the minimum sample size required is as shown
below.
a) Based on the above formula, for the mean salary of all employees to be within $ 900 with
a confidence level of 95%, a minimum sample size of 945 would be required.
b) Based on the above formula, for the satisfied employee to be within 2% with a confidence
level of 95%, a minimum sample size of 932 would be required.
Thus, a minimum sample of 945 would be required so as to ensure that both the above
conditions are met based on the given sample data.
4

PART 2: MEMORANDUM
For Attention: Tim George, Human Resource Manager
From: John Smith, Senior Analyst
Regarding: Re: Further Analysis of Dataset
Introduction
The objective of this memo is to answer the various queries highlighted by Tim George (HR
Manager) rose in the memorandum dated July 10, 2017. The various supporting computations
to address the given queries have been illustrated in the excel sheet attached. The analysis is
based on the sample data of 450 employees and various statistical techniques have been
deployed in order to come to conclusions.
Analysis
The various findings in relation to the questions you raised are highlighted below.
1) A) There is a 95% chance that the average salary of all Cleveland employees would lie
between $28,242 and $ 30,857.
B) There is 95% chance that the satisfied employees as a proportion of all Cleveland
employees would lie between 0.8623 and 0.9199.
2) The claim of the senior management regarding the employees getting higher than industry
average is not supported from the given sample data.
3) The claim of the senior management regarding the employees satisfaction level being 92%
is also not found to be true based on statistical analysis of the sample data provided.
4) There is significant difference in the average salary levels of male and female employees
at Cleveland.
5) a) A minimum sample size of 945 would be required for the mean salary of all employees
to be within $ 900 with a confidence level of 95%,
5
⊘ This is a preview!⊘
Do you want full access?
Subscribe today to unlock all pages.

Trusted by 1+ million students worldwide

b) A minimum sample size of 932 would be required for the satisfied employee to be within
2% with a confidence level of 95%,
Conclusion
From the above discussion it may be concluded that the senior management tends to
overestimate the salary level and satisfaction level of employees which potentially can be
matter of concern. Additionally, there does seem to be some form of gender differences in
salary levels which may be representative of gender based discrimination or lack of female
representation at the higher echelons due to glass ceiling. Hence, this needs to be proved
further as otherwise the employees satisfaction level can be adversely impacted.
Regards
John Smith
6
1 out of 7
Related Documents

Your All-in-One AI-Powered Toolkit for Academic Success.
+13062052269
info@desklib.com
Available 24*7 on WhatsApp / Email
Unlock your academic potential
Copyright © 2020–2025 A2Z Services. All Rights Reserved. Developed and managed by ZUCOL.