Business Analytics Report: Advertising, Sales, and Financial Analysis
VerifiedAdded on 2022/12/16
|20
|4639
|92
Report
AI Summary
This report delves into the realm of business analytics, employing mathematical models to analyze a company's financial performance. It presents a detailed examination of profit and loss calculations, costing behaviors (fixed and variable), and revenue projections. The report also focuses on the correlation between advertising expenditure and sales revenue, providing insights into the impact of marketing strategies. Furthermore, the report explores the application of mathematical models for forecasting and decision-making, emphasizing the importance of aligning objectives with variable considerations. The analysis extends to various marketing strategies, including social media and internet marketing, to enhance sales and brand awareness. Statistical data about GDP and employment are also mentioned in the report. Overall, the report offers a comprehensive overview of business analytics principles and their practical application in driving revenue growth and achieving a competitive advantage.

Business analytics
1
1
Paraphrase This Document
Need a fresh take? Get an instant paraphrase of this document with our AI Paraphraser
Table of content
Introduction......................................................................................................................................3
Mathematical model....................................................................................................................3
Correlation –coefficient of advertising and sales........................................................................8
Internal revenue service in UK..................................................................................................13
Conclusion.....................................................................................................................................16
References......................................................................................................................................18
2
Introduction
Business analytics is a continuous process in which business uses statistical data to gain
insight about the Strategies and also with the help of statistical data and techniques business try
to improve their decision making process (Vidgen and et.al 2017). This report includes
mathematical model and also provides profit and loss for the company by using mathematical
model. Apart from this costing and revenue behaviour is being defined in this report. In this
report correlation Coefficient between advertising and sale for the company is being mentioned.
Is report also shows the impact of advertising expenditures on sales and marketing of the
company so that company can gain competitive advantage. Apart from this statistical data about
GDP and Employment is being mentioned in this report.
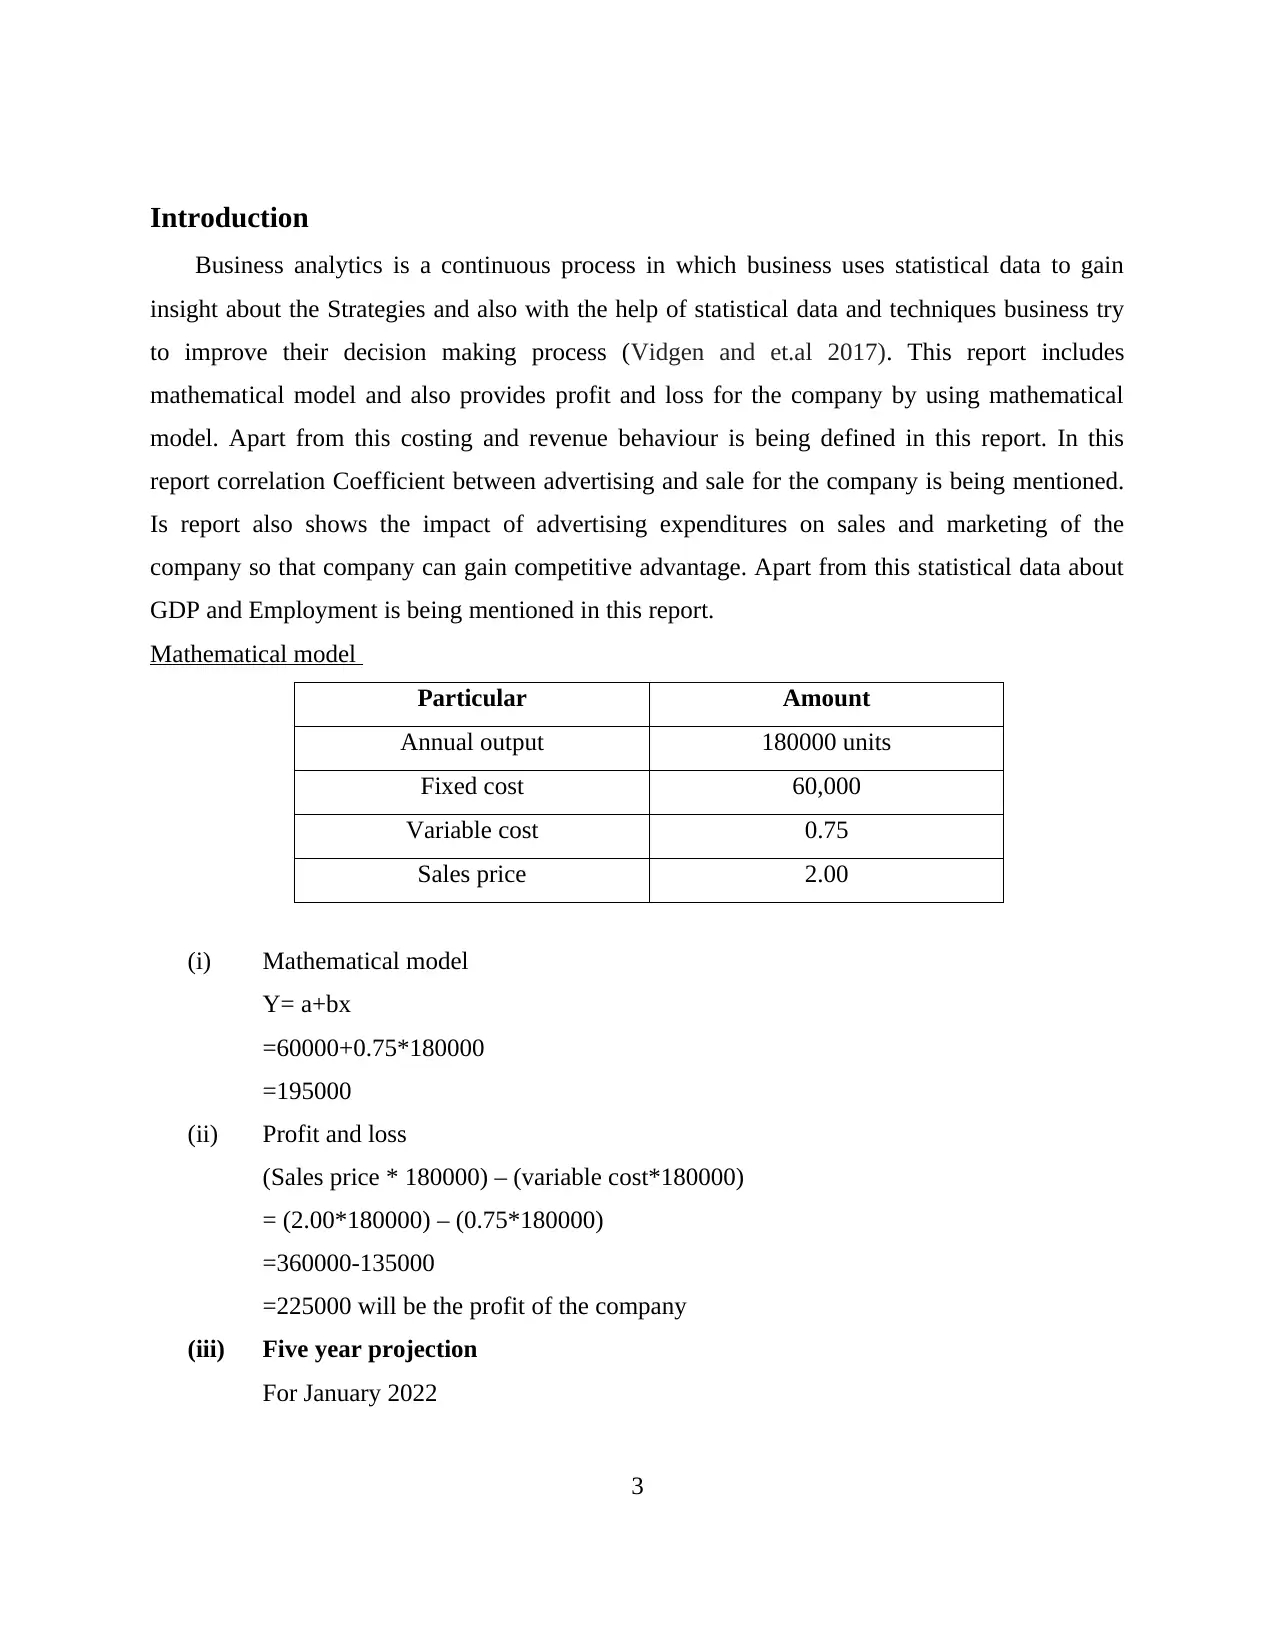
Mathematical model
Particular Amount
Annual output 180000 units
Fixed cost 60,000
Variable cost 0.75
Sales price 2.00
(i) Mathematical model
Y= a+bx
=60000+0.75*180000
=195000
(ii) Profit and loss
(Sales price * 180000) – (variable cost*180000)
= (2.00*180000) – (0.75*180000)
=360000-135000
=225000 will be the profit of the company
(iii) Five year projection
For January 2022
3
Business analytics is a continuous process in which business uses statistical data to gain
insight about the Strategies and also with the help of statistical data and techniques business try
to improve their decision making process (Vidgen and et.al 2017). This report includes
mathematical model and also provides profit and loss for the company by using mathematical
model. Apart from this costing and revenue behaviour is being defined in this report. In this
report correlation Coefficient between advertising and sale for the company is being mentioned.
Is report also shows the impact of advertising expenditures on sales and marketing of the
company so that company can gain competitive advantage. Apart from this statistical data about
GDP and Employment is being mentioned in this report.
Mathematical model
Particular Amount
Annual output 180000 units
Fixed cost 60,000
Variable cost 0.75
Sales price 2.00
(i) Mathematical model
Y= a+bx
=60000+0.75*180000
=195000
(ii) Profit and loss
(Sales price * 180000) – (variable cost*180000)
= (2.00*180000) – (0.75*180000)
=360000-135000
=225000 will be the profit of the company
(iii) Five year projection
For January 2022
3
⊘ This is a preview!⊘
Do you want full access?
Subscribe today to unlock all pages.
Trusted by 1+ million students worldwide
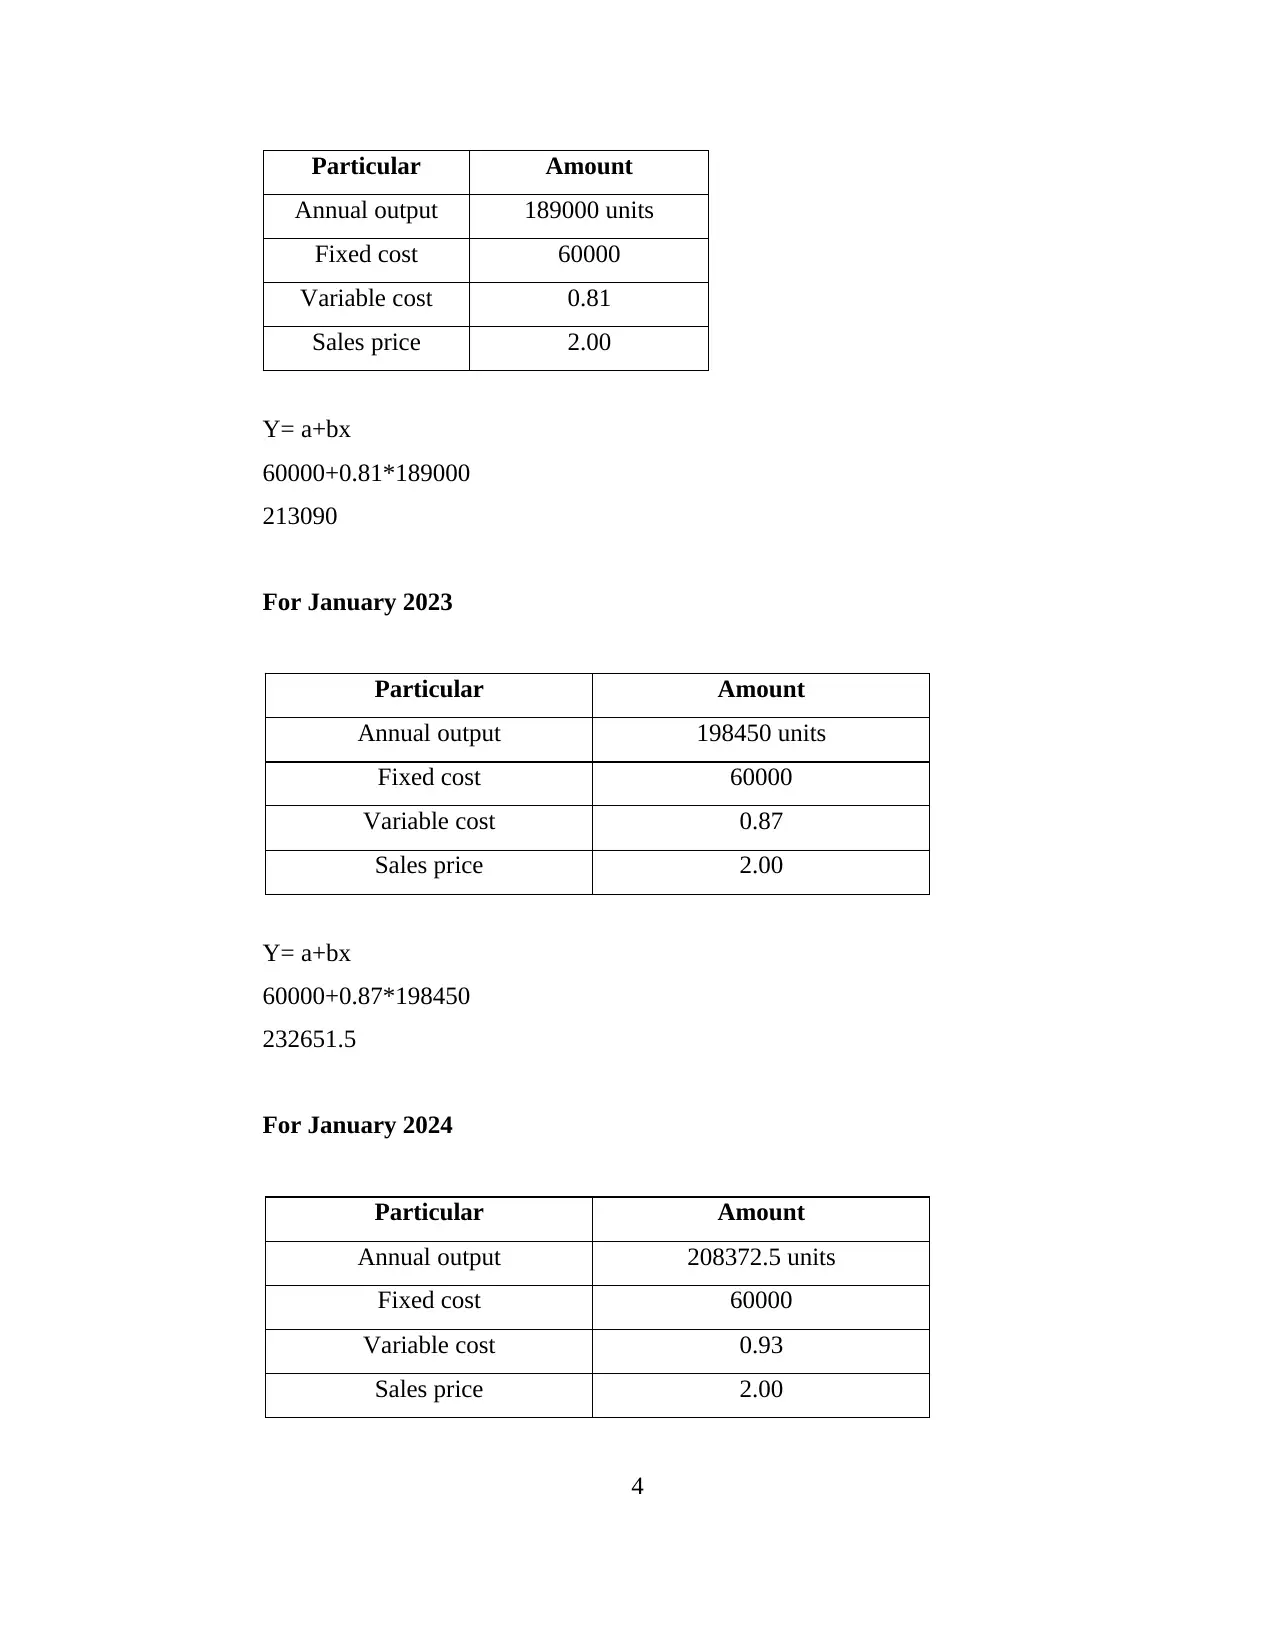
Particular Amount
Annual output 189000 units
Fixed cost 60000
Variable cost 0.81
Sales price 2.00
Y= a+bx
60000+0.81*189000
213090
For January 2023
Particular Amount
Annual output 198450 units
Fixed cost 60000
Variable cost 0.87
Sales price 2.00
Y= a+bx
60000+0.87*198450
232651.5
For January 2024
Particular Amount
Annual output 208372.5 units
Fixed cost 60000
Variable cost 0.93
Sales price 2.00
4
Paraphrase This Document
Need a fresh take? Get an instant paraphrase of this document with our AI Paraphraser
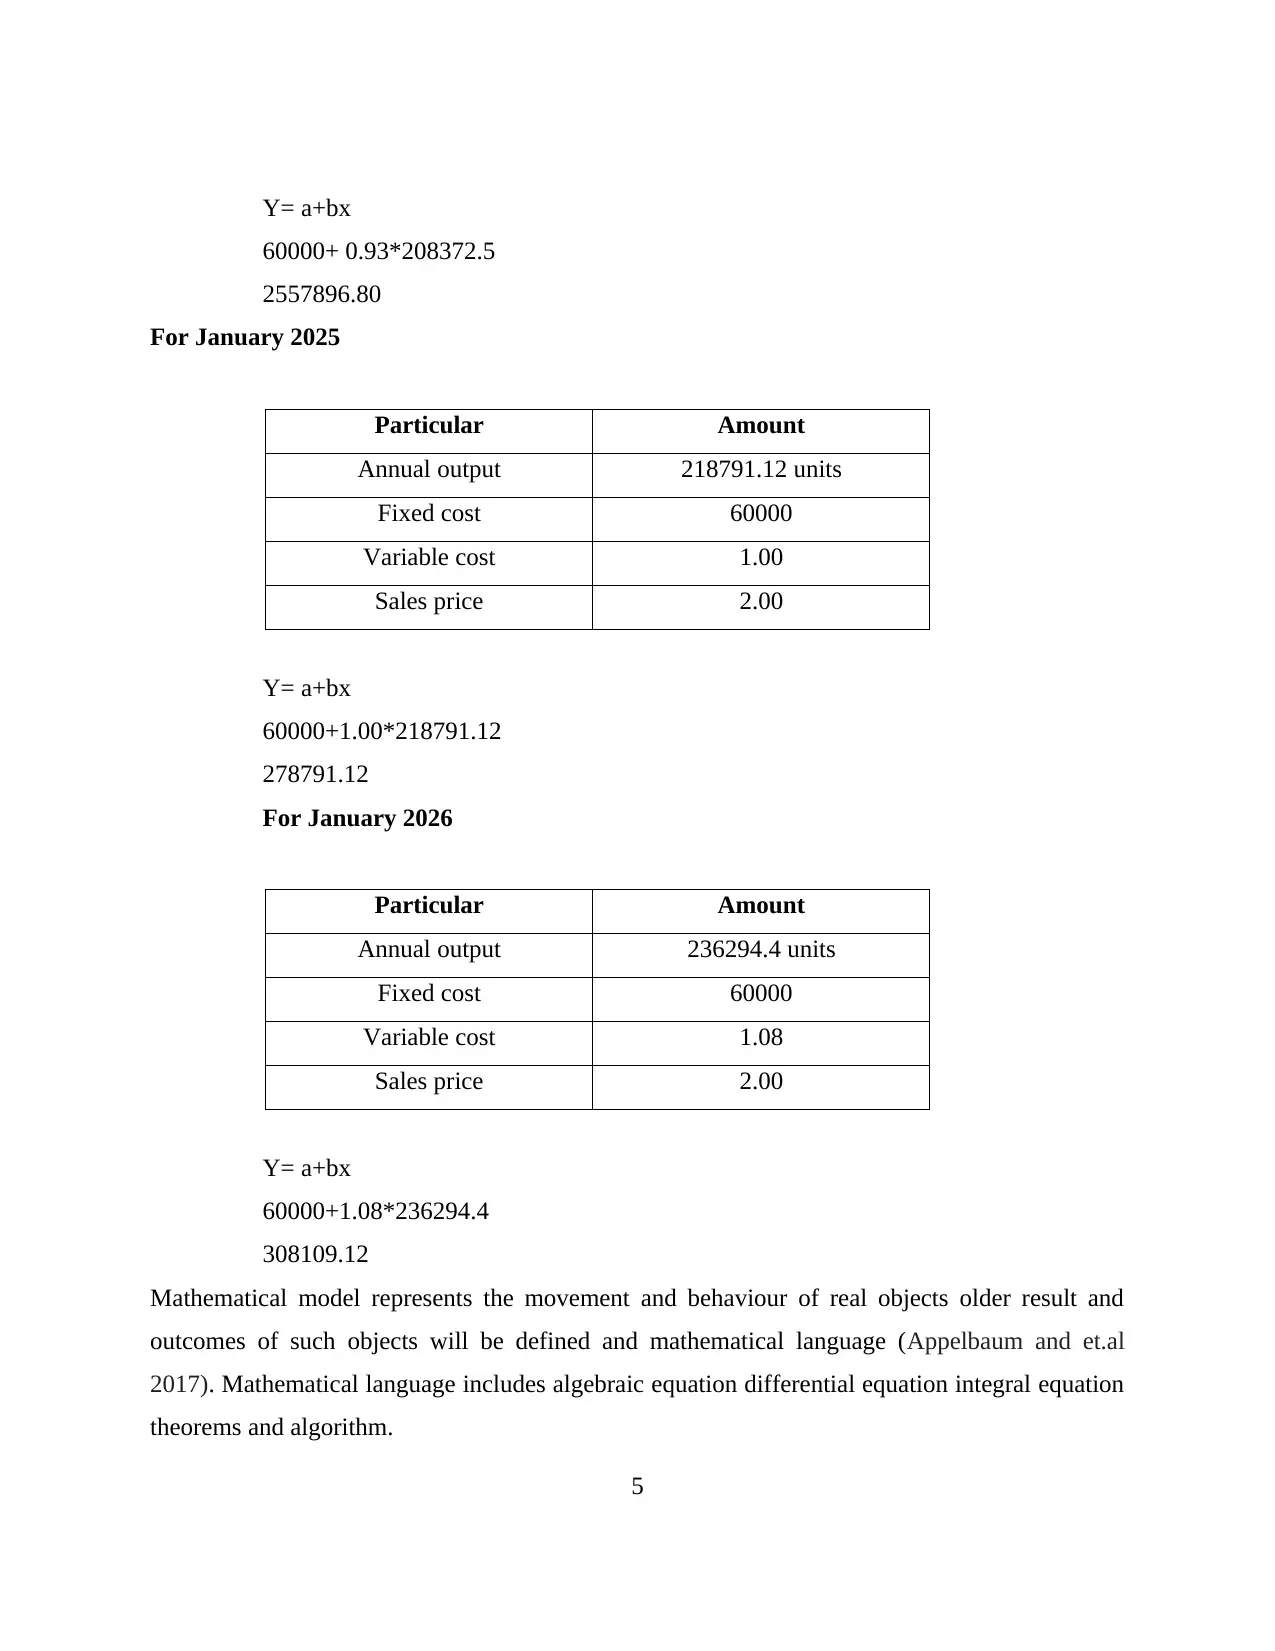
Y= a+bx
60000+ 0.93*208372.5
2557896.80
For January 2025
Particular Amount
Annual output 218791.12 units
Fixed cost 60000
Variable cost 1.00
Sales price 2.00
Y= a+bx
60000+1.00*218791.12
278791.12
For January 2026
Particular Amount
Annual output 236294.4 units
Fixed cost 60000
Variable cost 1.08
Sales price 2.00
Y= a+bx
60000+1.08*236294.4
308109.12
Mathematical model represents the movement and behaviour of real objects older result and
outcomes of such objects will be defined and mathematical language (Appelbaum and et.al
2017). Mathematical language includes algebraic equation differential equation integral equation
theorems and algorithm.
5
The main motive of using mathematical model by the company is to decrease the extra
cost and also company wants to save their valuable time. Financial modelling is being used to
know the exact profit and loss faced by the company why not putting so much capital. Apart
from this the process of mathematical model is easy and do not consume more time. Another
reason of using mathematical model is to analyse the sales revenue fixed cost and output of the
company so that if they found any error or difficulty and generating profit they can analyse the
whole values and can make certain corrections so that company do not have to face loss. Apart
from this mathematical model helps the company to make predictions for the future.
This will help the company to know how much products they have to generate in the
future by seeing the market Trends and customer demand so that did not produce so much
products that it will become difficult for the company to sell all the products so as per the market
demand with the help of mathematical modelling the can make predictions about the future
supply (Pappas and et.al 201). So mathematical model provides Real world scenario and
phenomena to the company and as per the given information managers of the company can make
different Strategies and policies for the future. To generate high profit it is mandatory for the
company that this specified that object then only mathematical model can then read them better
results otherwise company mein face loss if they do not know their objective in this case
mathematical model will not work appropriately.
Apart from objective company has to keep an eye on the variables and parameters
because mathematical model Fox on some assumptions. As per the assumptions company can
know who whom they want to target what age group people will use the products how much they
will sell the products what will be the quantity of the products etc. has been defined in
assumptions. As per the assumptions company produces new products and fulfil the demand of
the market.
Costing and revenue behaviour
To evaluate the performance of the business every company has to make sure about the cost and
the behaviour of revenue (Ashrafi and et.al 2019). Then only company can get to know whether
they are in profit or loss. If the cost of the company is higher than the revenue it shows that
company is in loss.
6
⊘ This is a preview!⊘
Do you want full access?
Subscribe today to unlock all pages.
Trusted by 1+ million students worldwide
Cost of the company can be categorised into two forms first is variable cost and other is
fixed cost. In this case fixed cost is 60000 which remains fixed for the entire life of the cost and
other cost is variable which varies from time to time. Is per the data it has been found that when
the output it increased by 5% the coast also increased by 8% but company is in profit because
their when us higher than their cost.
Profit is the difference between revenue and cost. So every company wants that, their
coast remains lower than their revenues. But to generate high revenue it is the responsibility of
the company that produce higher quality product for that they need to put more money in their
cost like to buy raw material for rent extra charges have to be paid by the company then only
they can deliver high quality product (Shah and et.al 2020. On the flip side company wants to
cut down its cost as well for that company needs to make proper budget and they have to
estimate and forecast the cost so that they can save the extra and unnecessary expenses.
As the company can’t make changes in the fixed cost but they can cut down variable
cost. According to the given data when the company was increasing the variable cost its output
also getting increased the reason behind is that when company is putting more amount in
variable cost it can produce more high quality products which is liked by the customers that’s
why their annual output in sales got increased.
As customer wants new and quality products and when they get the quality products they
do not feel hesitated in pain higher amount for the product this is the reason of increased revenue
and sales for the company. Therefore their annual output is continuously increasing due to the
increase in variable cost (Samui and et.al 2020). Another reason for increase in output is that
companies expanding more money on promotion and marketing activities so that company can
tap into new markets as well and try to touch all the customers who are not aware with the
products of the company. Apart from this company is trying to increase their revenue by offering
quality products to the customers for that they have to purchase high priced raw materials this is
also another reason that their variable cost is continuously increasing along with their revenue.
7
Paraphrase This Document
Need a fresh take? Get an instant paraphrase of this document with our AI Paraphraser
year 2022 year 2023 year 2024 year 2025 year 2026
0
50000
100000
150000
200000
250000
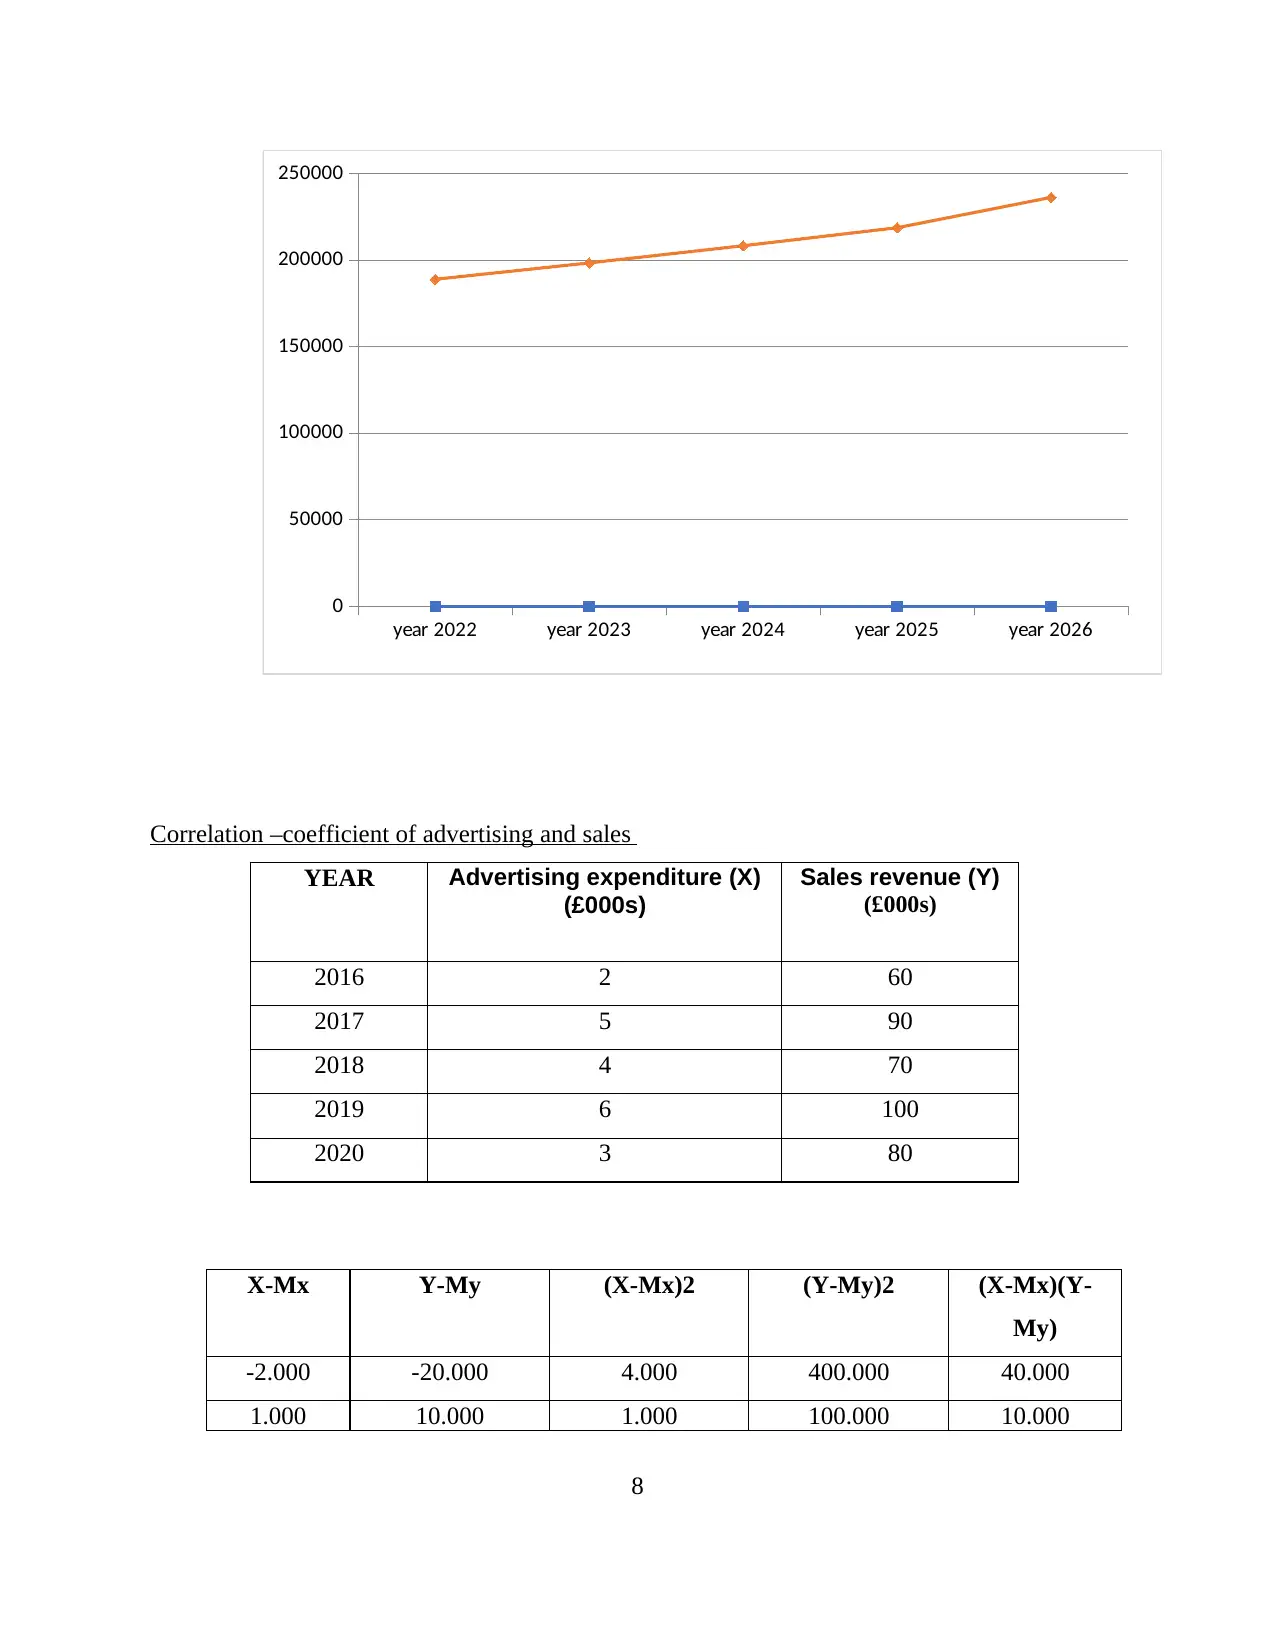
Correlation –coefficient of advertising and sales
YEAR Advertising expenditure (X)
(£000s)
Sales revenue (Y)
(£000s)
2016 2 60
2017 5 90
2018 4 70
2019 6 100
2020 3 80
X-Mx Y-My (X-Mx)2 (Y-My)2 (X-Mx)(Y-
My)
-2.000 -20.000 4.000 400.000 40.000
1.000 10.000 1.000 100.000 10.000
8
0
50000
100000
150000
200000
250000
Correlation –coefficient of advertising and sales
YEAR Advertising expenditure (X)
(£000s)
Sales revenue (Y)
(£000s)
2016 2 60
2017 5 90
2018 4 70
2019 6 100
2020 3 80
X-Mx Y-My (X-Mx)2 (Y-My)2 (X-Mx)(Y-
My)
-2.000 -20.000 4.000 400.000 40.000
1.000 10.000 1.000 100.000 10.000
8
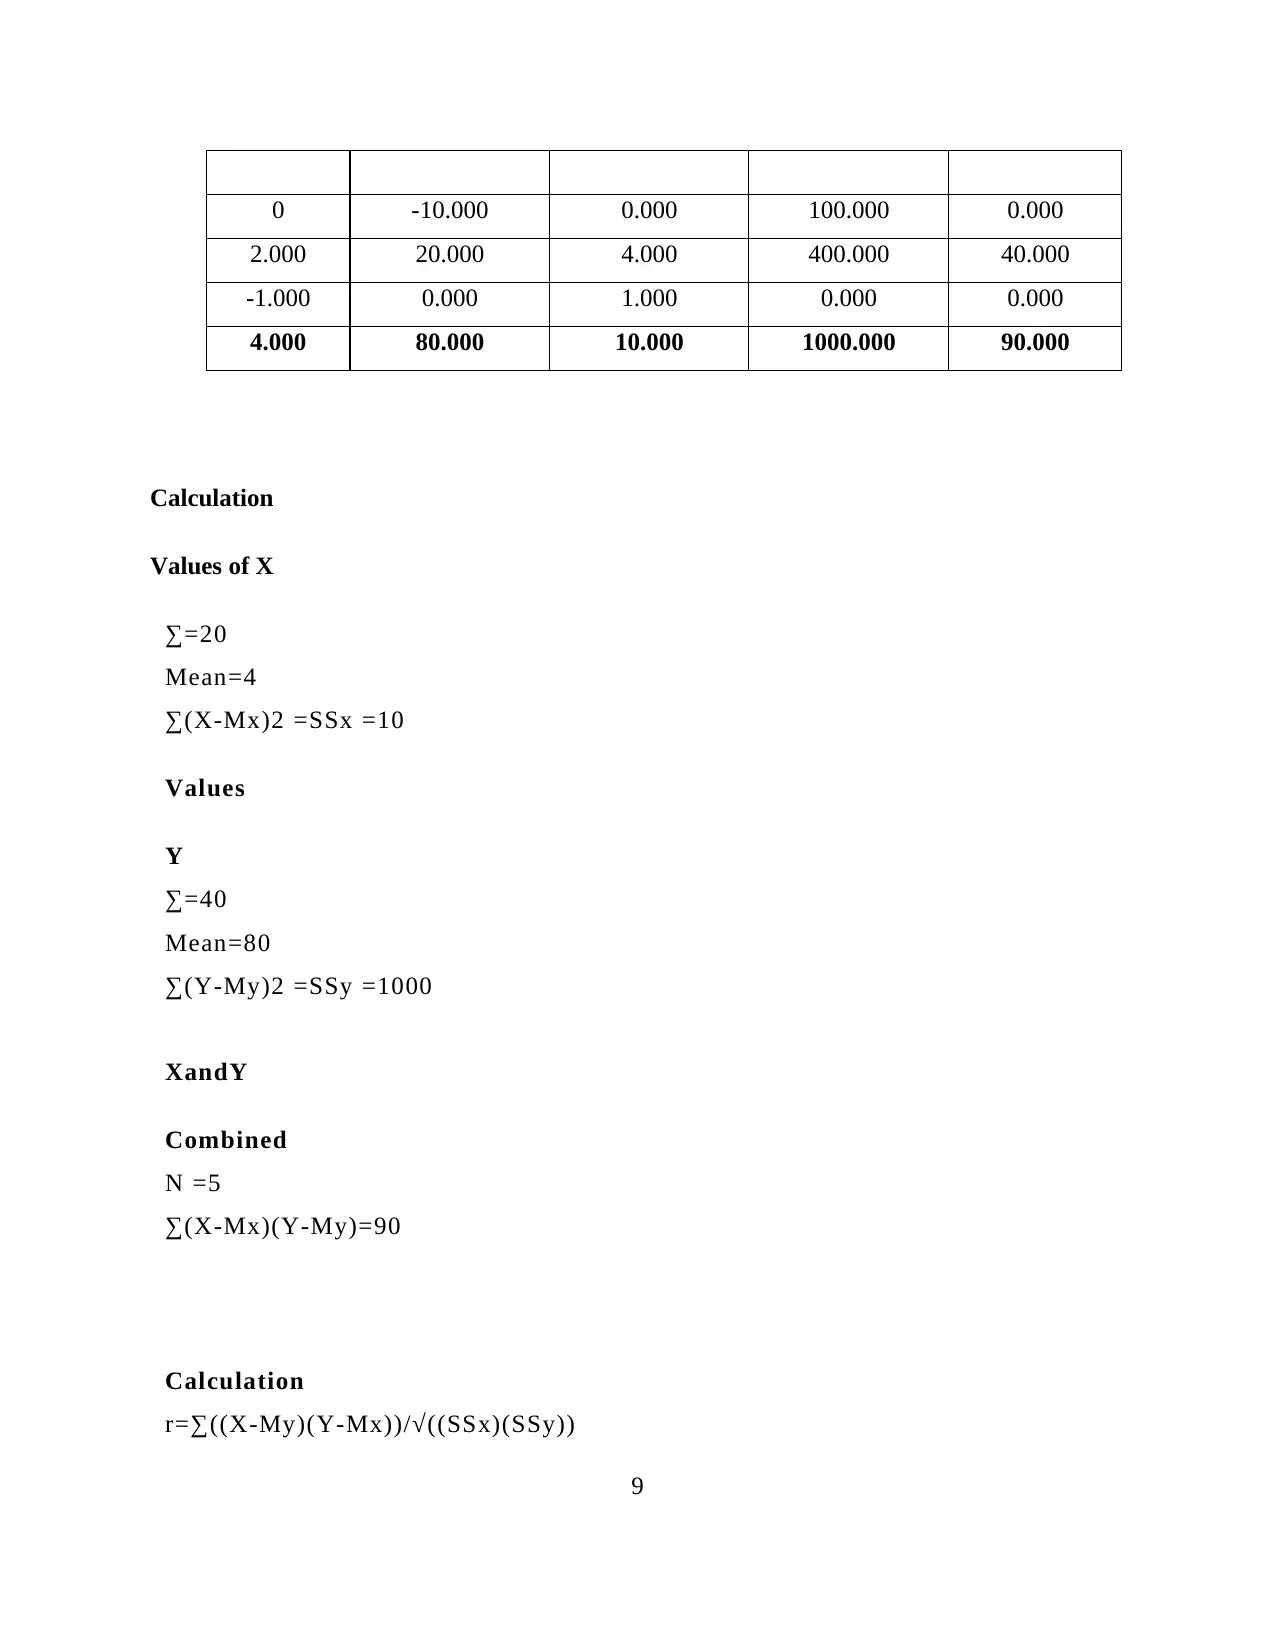
0 -10.000 0.000 100.000 0.000
2.000 20.000 4.000 400.000 40.000
-1.000 0.000 1.000 0.000 0.000
4.000 80.000 10.000 1000.000 90.000
Calculation
Values of X
∑=20
Mean=4
∑(X-Mx)2 =SSx =10
Values
Y
∑=40
Mean=80
∑(Y-My)2 =SSy =1000
XandY
Combined
N =5
∑(X-Mx)(Y-My)=90
Calculation
r=∑((X-My)(Y-Mx))/√((SSx)(SSy))
9
2.000 20.000 4.000 400.000 40.000
-1.000 0.000 1.000 0.000 0.000
4.000 80.000 10.000 1000.000 90.000
Calculation
Values of X
∑=20
Mean=4
∑(X-Mx)2 =SSx =10
Values
Y
∑=40
Mean=80
∑(Y-My)2 =SSy =1000
XandY
Combined
N =5
∑(X-Mx)(Y-My)=90
Calculation
r=∑((X-My)(Y-Mx))/√((SSx)(SSy))
9
⊘ This is a preview!⊘
Do you want full access?
Subscribe today to unlock all pages.
Trusted by 1+ million students worldwide
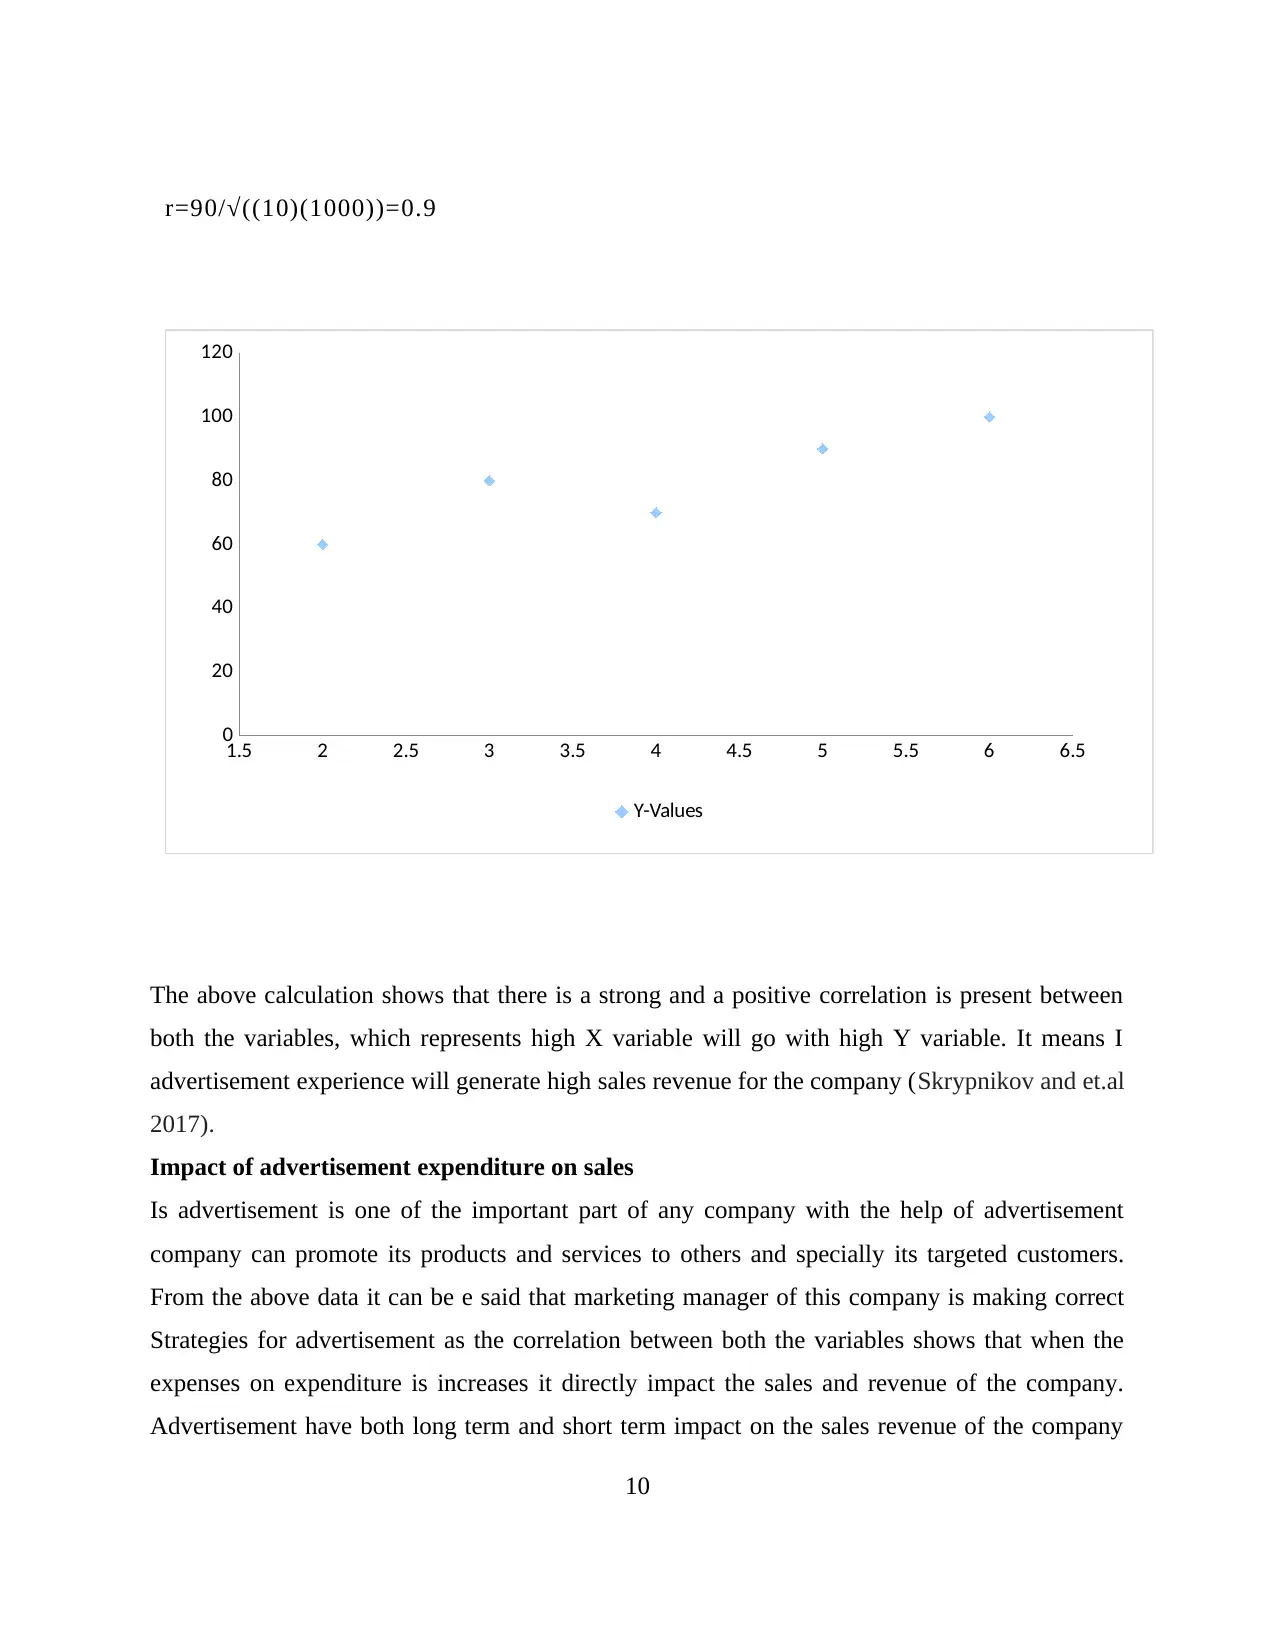
r=90/√((10)(1000))=0.9
1.5 2 2.5 3 3.5 4 4.5 5 5.5 6 6.5
0
20
40
60
80
100
120
Y-Values
The above calculation shows that there is a strong and a positive correlation is present between
both the variables, which represents high X variable will go with high Y variable. It means I
advertisement experience will generate high sales revenue for the company (Skrypnikov and et.al
2017).
Impact of advertisement expenditure on sales
Is advertisement is one of the important part of any company with the help of advertisement
company can promote its products and services to others and specially its targeted customers.
From the above data it can be e said that marketing manager of this company is making correct
Strategies for advertisement as the correlation between both the variables shows that when the
expenses on expenditure is increases it directly impact the sales and revenue of the company.
Advertisement have both long term and short term impact on the sales revenue of the company
10
Paraphrase This Document
Need a fresh take? Get an instant paraphrase of this document with our AI Paraphraser
but it depends on the objective and goal of the company what kind of advertisement they should
prefer (Sepehri, A., 2017).If the company is doing short term advertisement it will definitely
going to impact the sales and revenue of the company but the time duration of such increased
sales will be shorten. But on the other hand when the company wants to earn the competitive
edge in the market it would be preferred that they should go for long term in advertisement.
For long-term advertisement the cost and expenditure will be higher as compared to short
term advertisement. Expert about table in data it can be said that company is having good
revenue and sales it means the demand of the product is higher in the market. If the product of
the company is being demanded in the market this can only becomes possible with the proper
advertisement and promotional activities.
As the marketing manager of the company is highly concerned for advertisement so that
it can increase the brand awareness about the company in the market (Kinchin and et.al
2017).With the help of advertisement more and more people will come to know about the
features of the products. This will help the company to know whom they should target and what
the preference of the customers is.
It has been seen from the correlation of Coefficient is that company should increase the
expenditure on advertisement because when we will put more money in advertisement so the sale
of the company will automatically increase (Assimakopoulos and et.al 2017).
The main motive of Marketing department behind the increased advertisement is that
they want to bring together its customers and the products of the. But the marketing manager has
to be sure that the do not spend ample of money on advertisement so that they may face loss
(Strauss and et.al 2018)). As marketing and advertisement is important for the company but they
do not compromise with their profit.
To gain the competitive advantage this company should do more advanced and modern
advertisement. For that they are some marketing strategies which can be implemented by the
marketing managers to increase the revenue and sales of the company.
Social media marketing
Now a day’s every people have their account on social media and thousands of people are
active user of social media. Show the marketing department of the company can share various
contents images videos and pictures of the product on their social media handle so that by
11
sharing a single image taken tab 2007 billions of customer who are actively using social media
(Samiee and et.al 2019). Along with this company can know the current market Trend and
decides of the customer so that they can produce different and innovative product to increase
their loyal customer.
Internet marketing
This kind of marketing company can update its website and show the latest of words and
products which is being sold by the company. Because the trend has been changed, now
customers prefer to buy products online (Goncharova and et.al 2019). To increase the sale
company can tie up with any E-Commerce company to increase their sales apart from this
weekend sale the products directly to the customer with the help of their website. But to sell
products online company must provide all the necessary details about the product like quantity
price images quality etc. So that customer can make right choice.
Email marketing
This is one of the popular marketing strategies which are being followed by most of the
companies to increase their sales (Arafah, W., 2018). Indus marketing company uses the old data
of its customers and send those emails on monthly or weekly basis so that they’ll customer can
get to know what the different offers are and discounts are being provided by the company.
Updating of content
To increase the sales it is necessary for the company that they must update their contents,
whenever they make any changes (Kingsnorth, 2019). To increase the sale it is must, for the
company that they do not publish old content on their website it will reduce the reputation of the
company in the market. Show the marketing manager has to make sure that what kind of latest
products they are about to offer to its customers so they on the publish such information on the
website and social media otherwise it may lose loyal customer because every customer wants
different products they don’t want to use similar products all the day so to increase the market
share and to survive in the market it is necessary for the company that day continue update the
information about their products.
Price
Price is effective marketing strategy which is definitely going to work for the company. If
the company e makes any change in the price or reduced the price it will definitely draw the
12
⊘ This is a preview!⊘
Do you want full access?
Subscribe today to unlock all pages.
Trusted by 1+ million students worldwide
1 out of 20
Related Documents


Your All-in-One AI-Powered Toolkit for Academic Success.
+13062052269
info@desklib.com
Available 24*7 on WhatsApp / Email
![[object Object]](/_next/static/media/star-bottom.7253800d.svg)
Unlock your academic potential
Copyright © 2020–2026 A2Z Services. All Rights Reserved. Developed and managed by ZUCOL.