Business Analytics Report: Classification, Regression, and Analysis

Verified

Added on  2020/12/29

|12
|1793
|236
Report
AI Summary
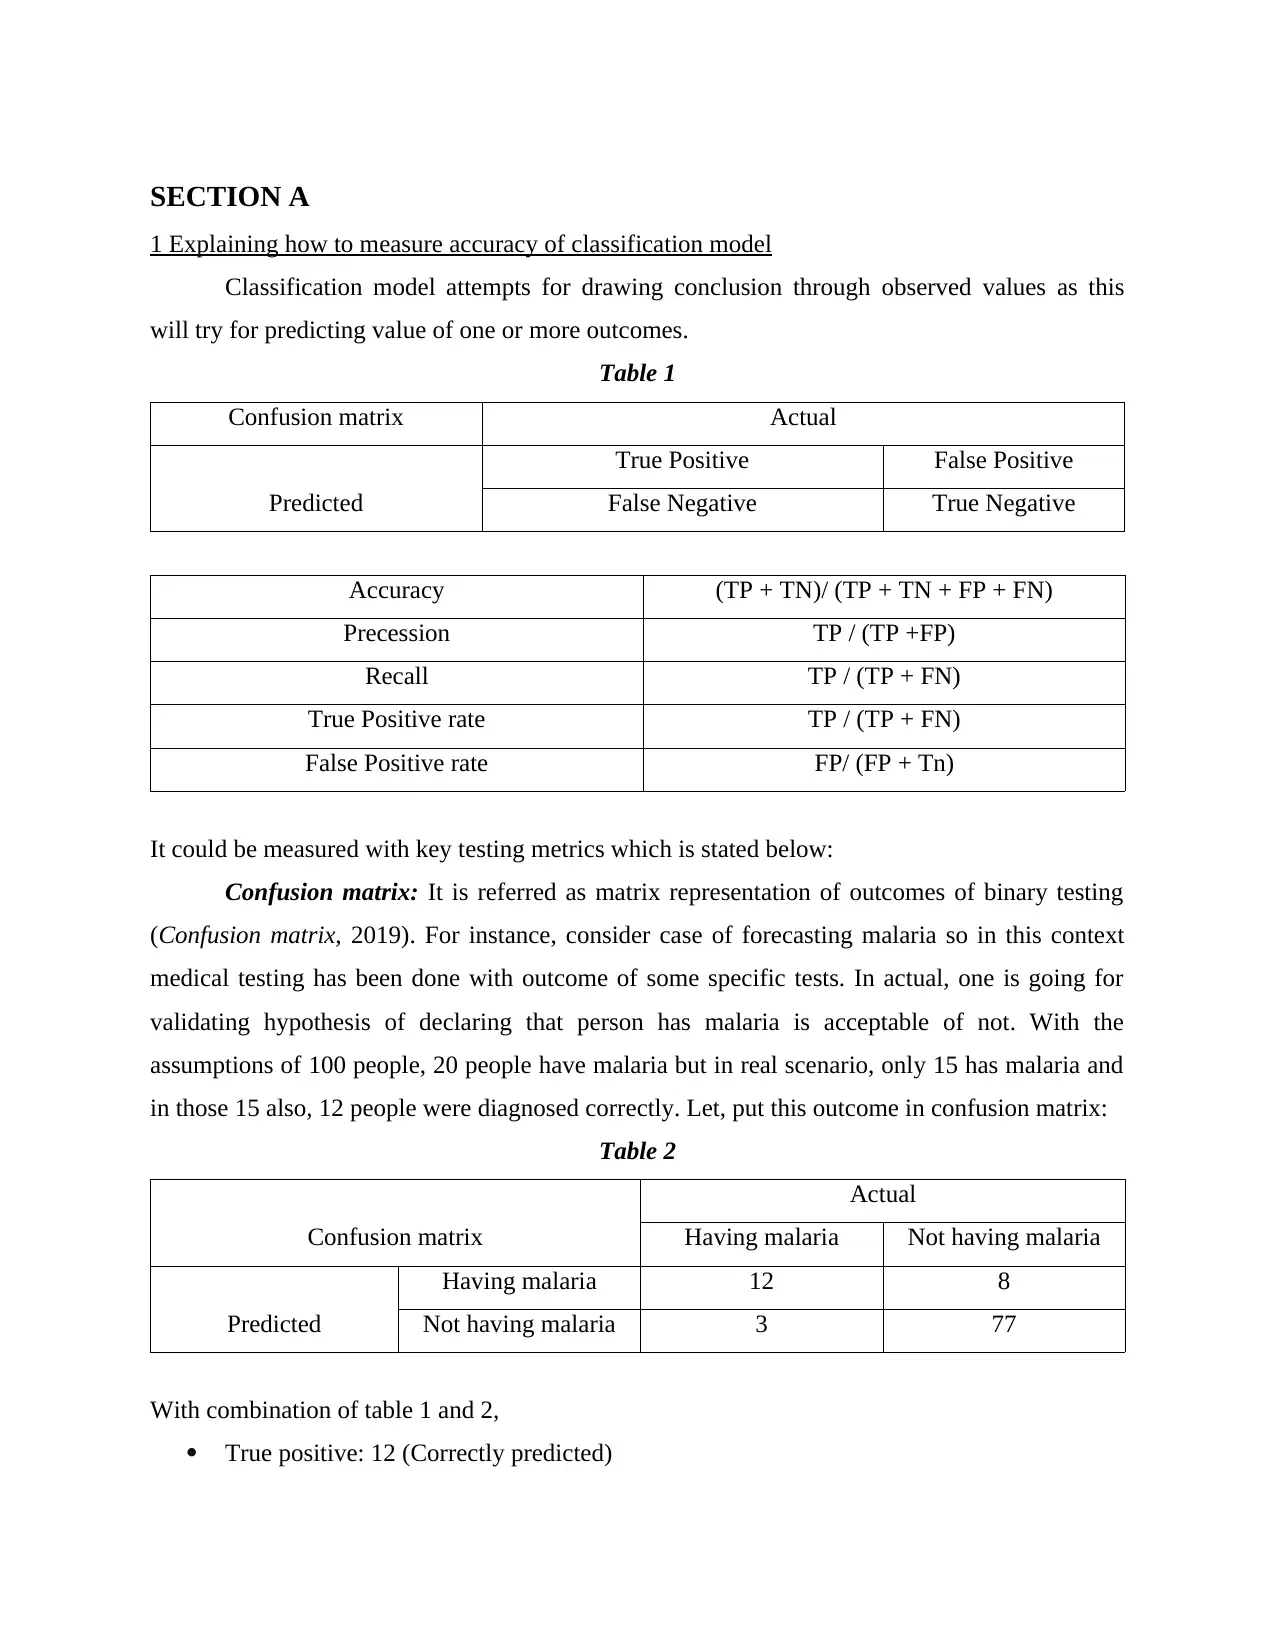
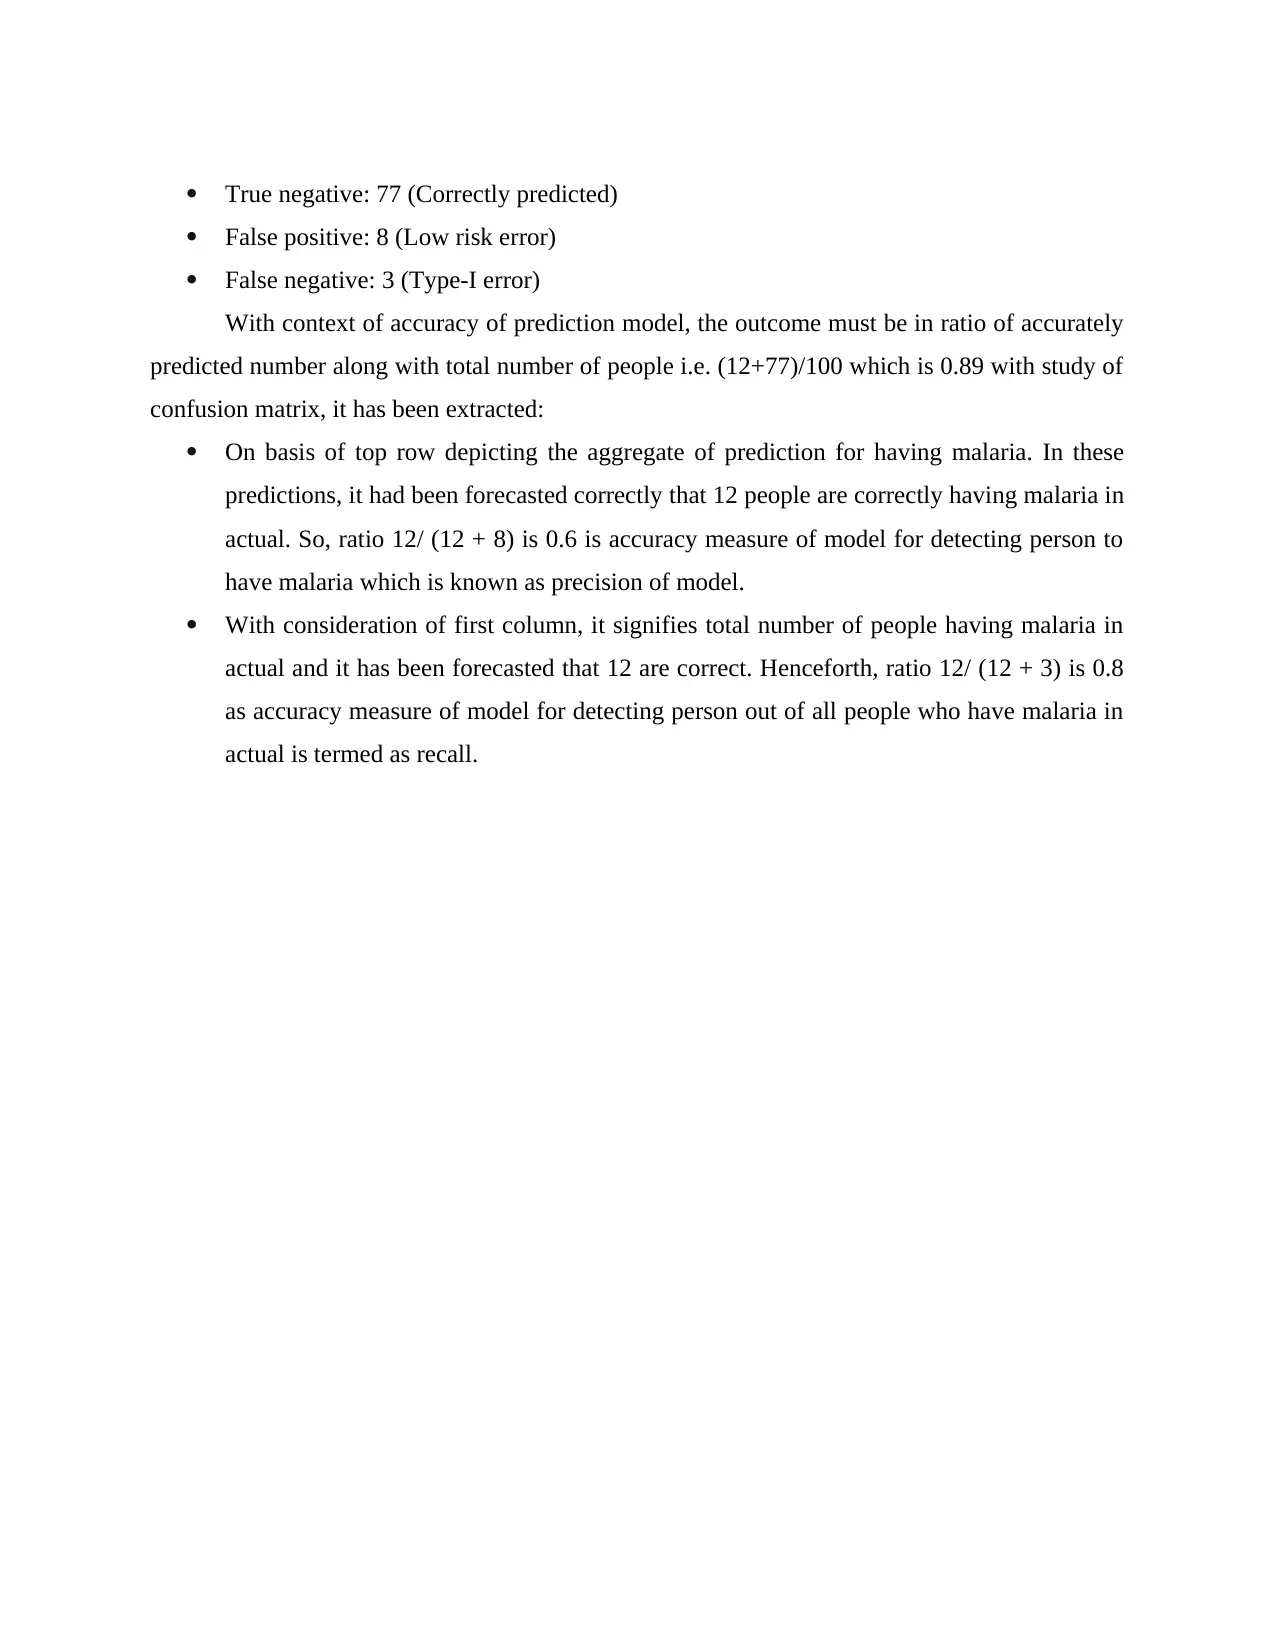
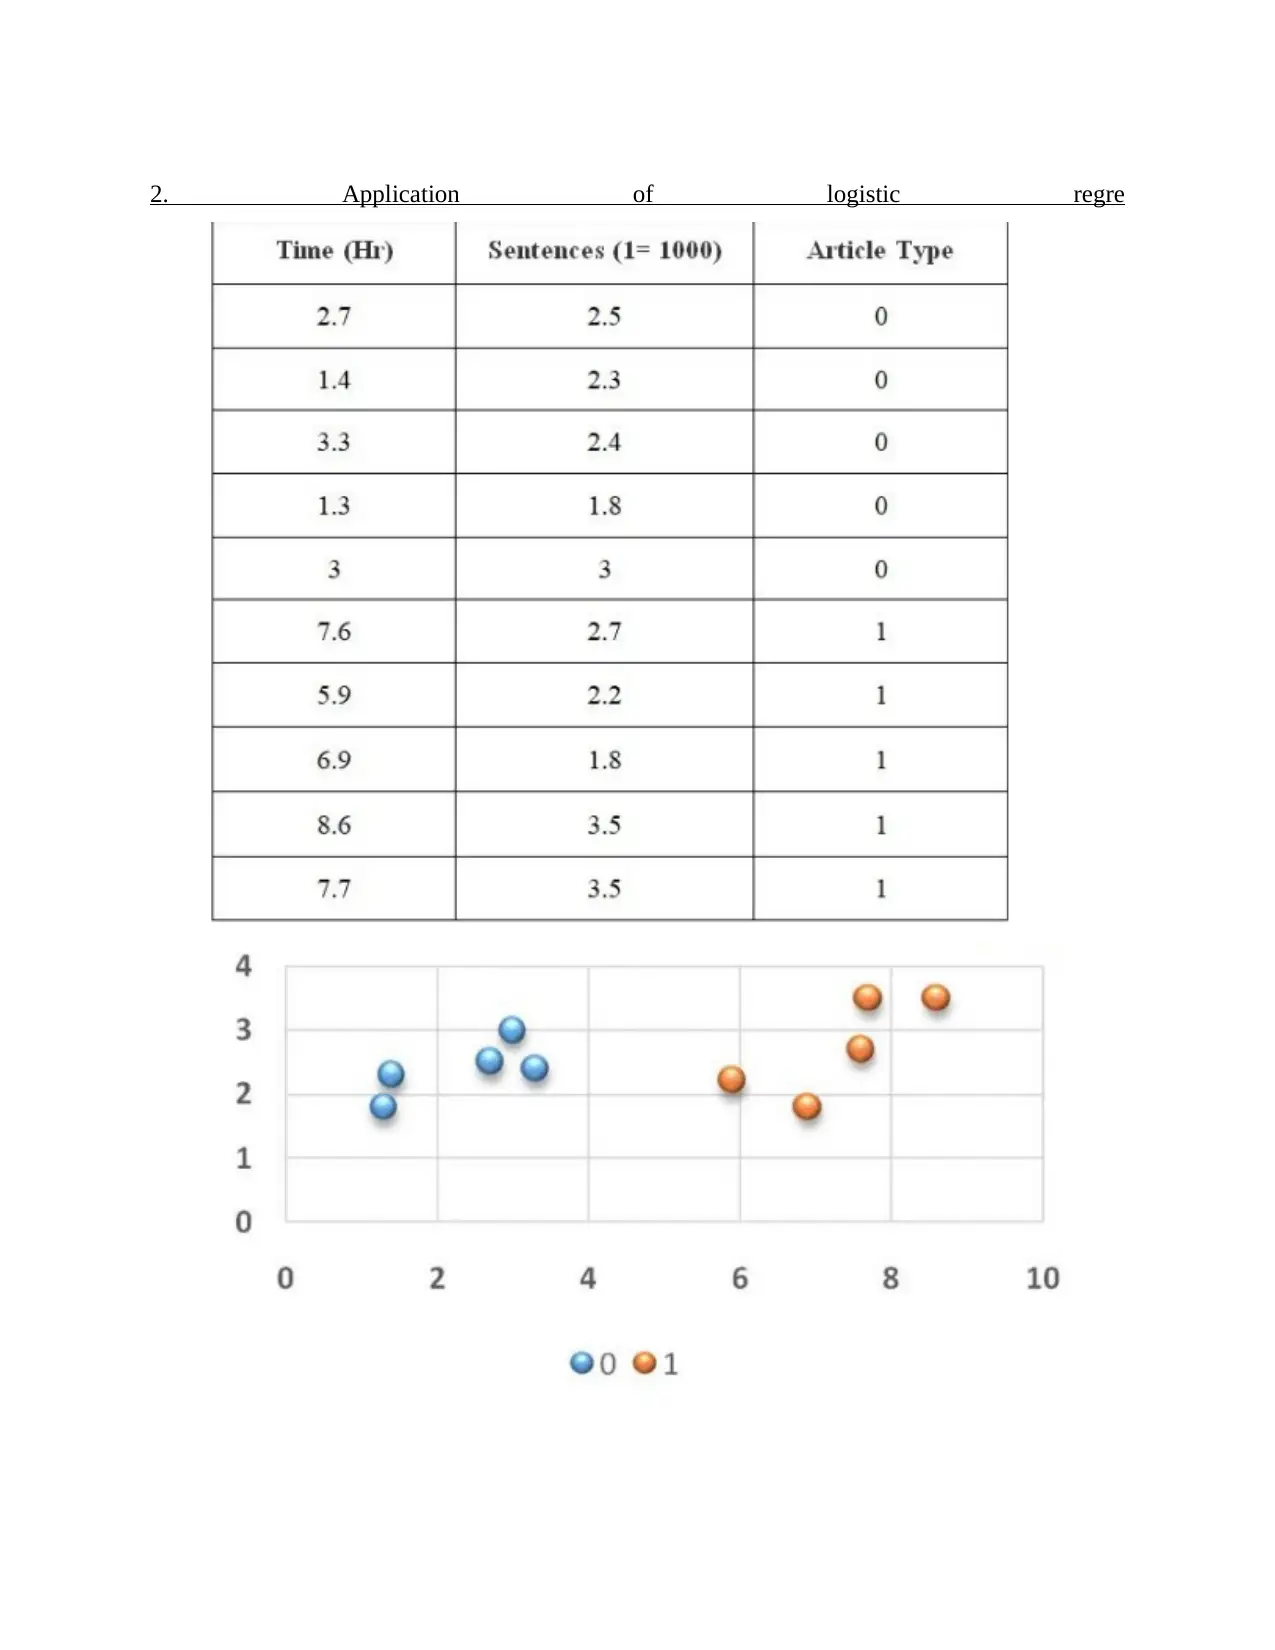
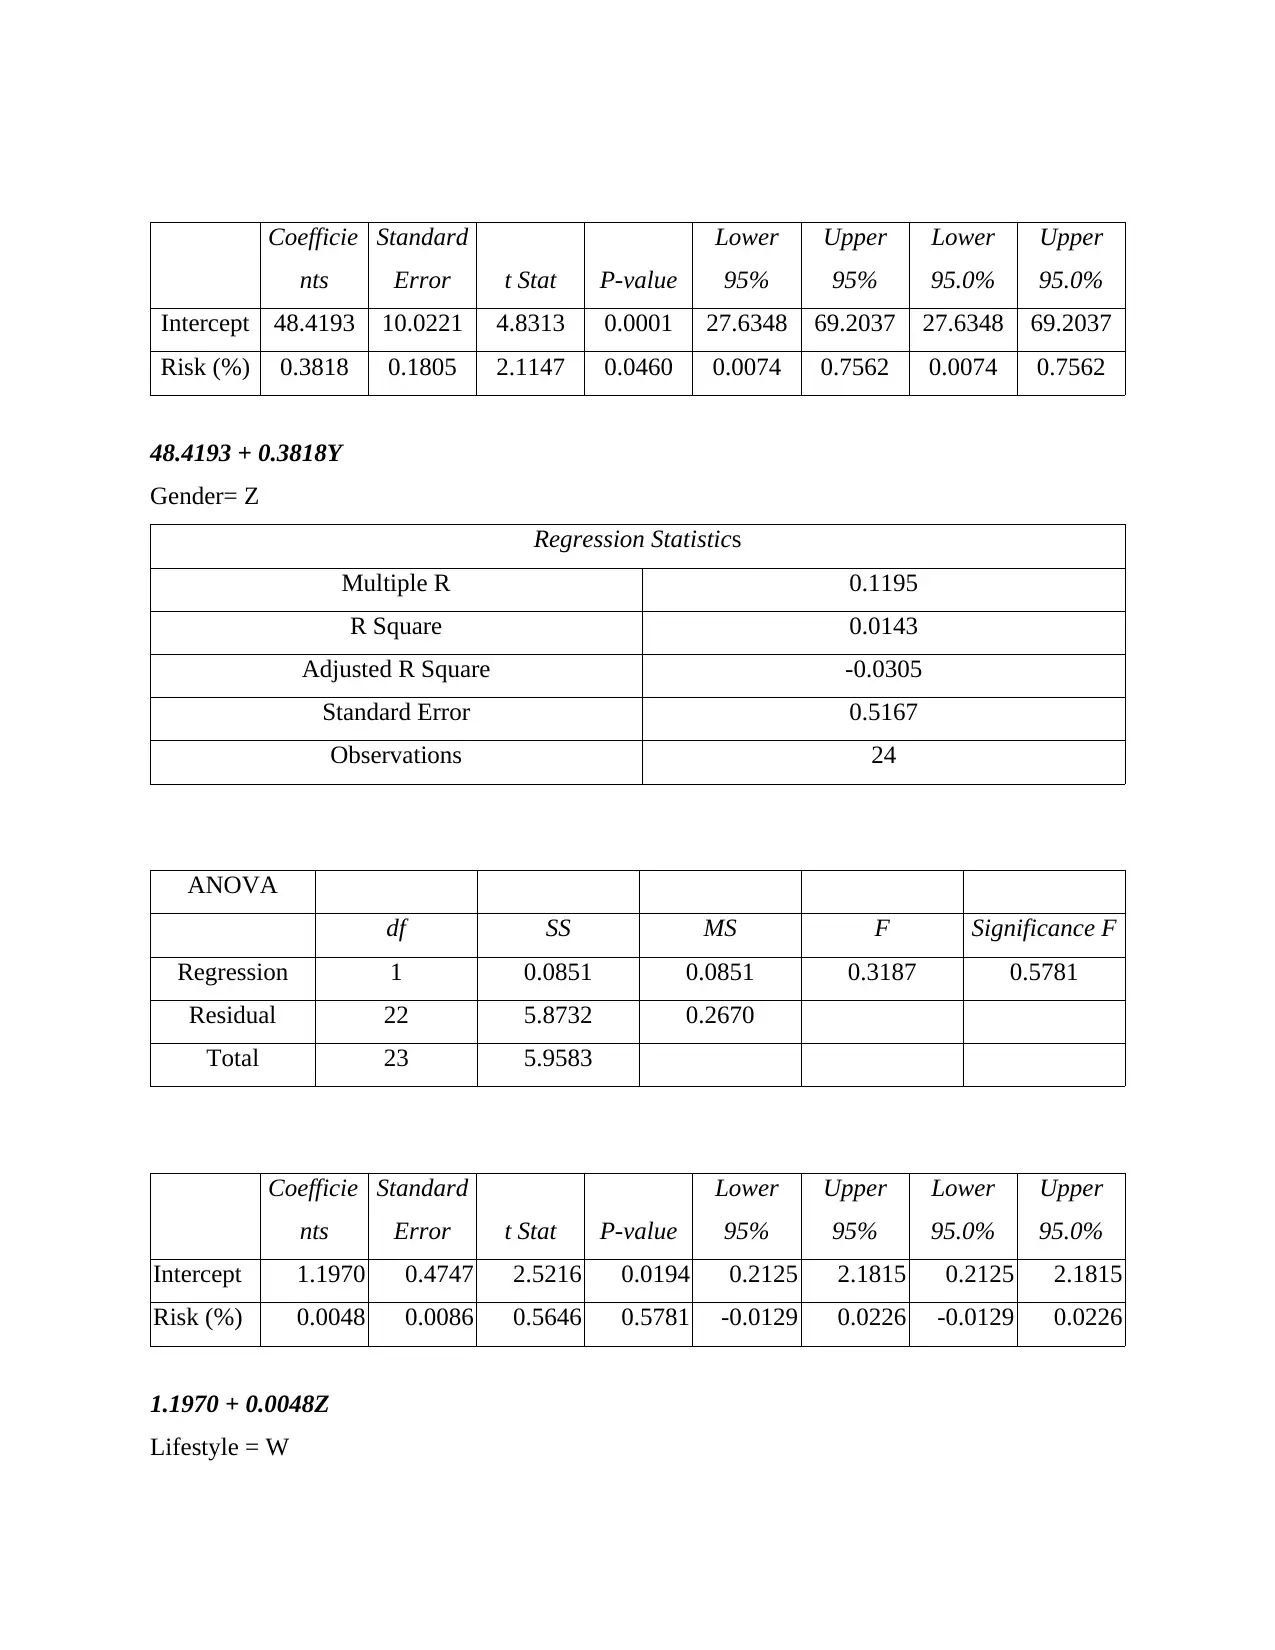
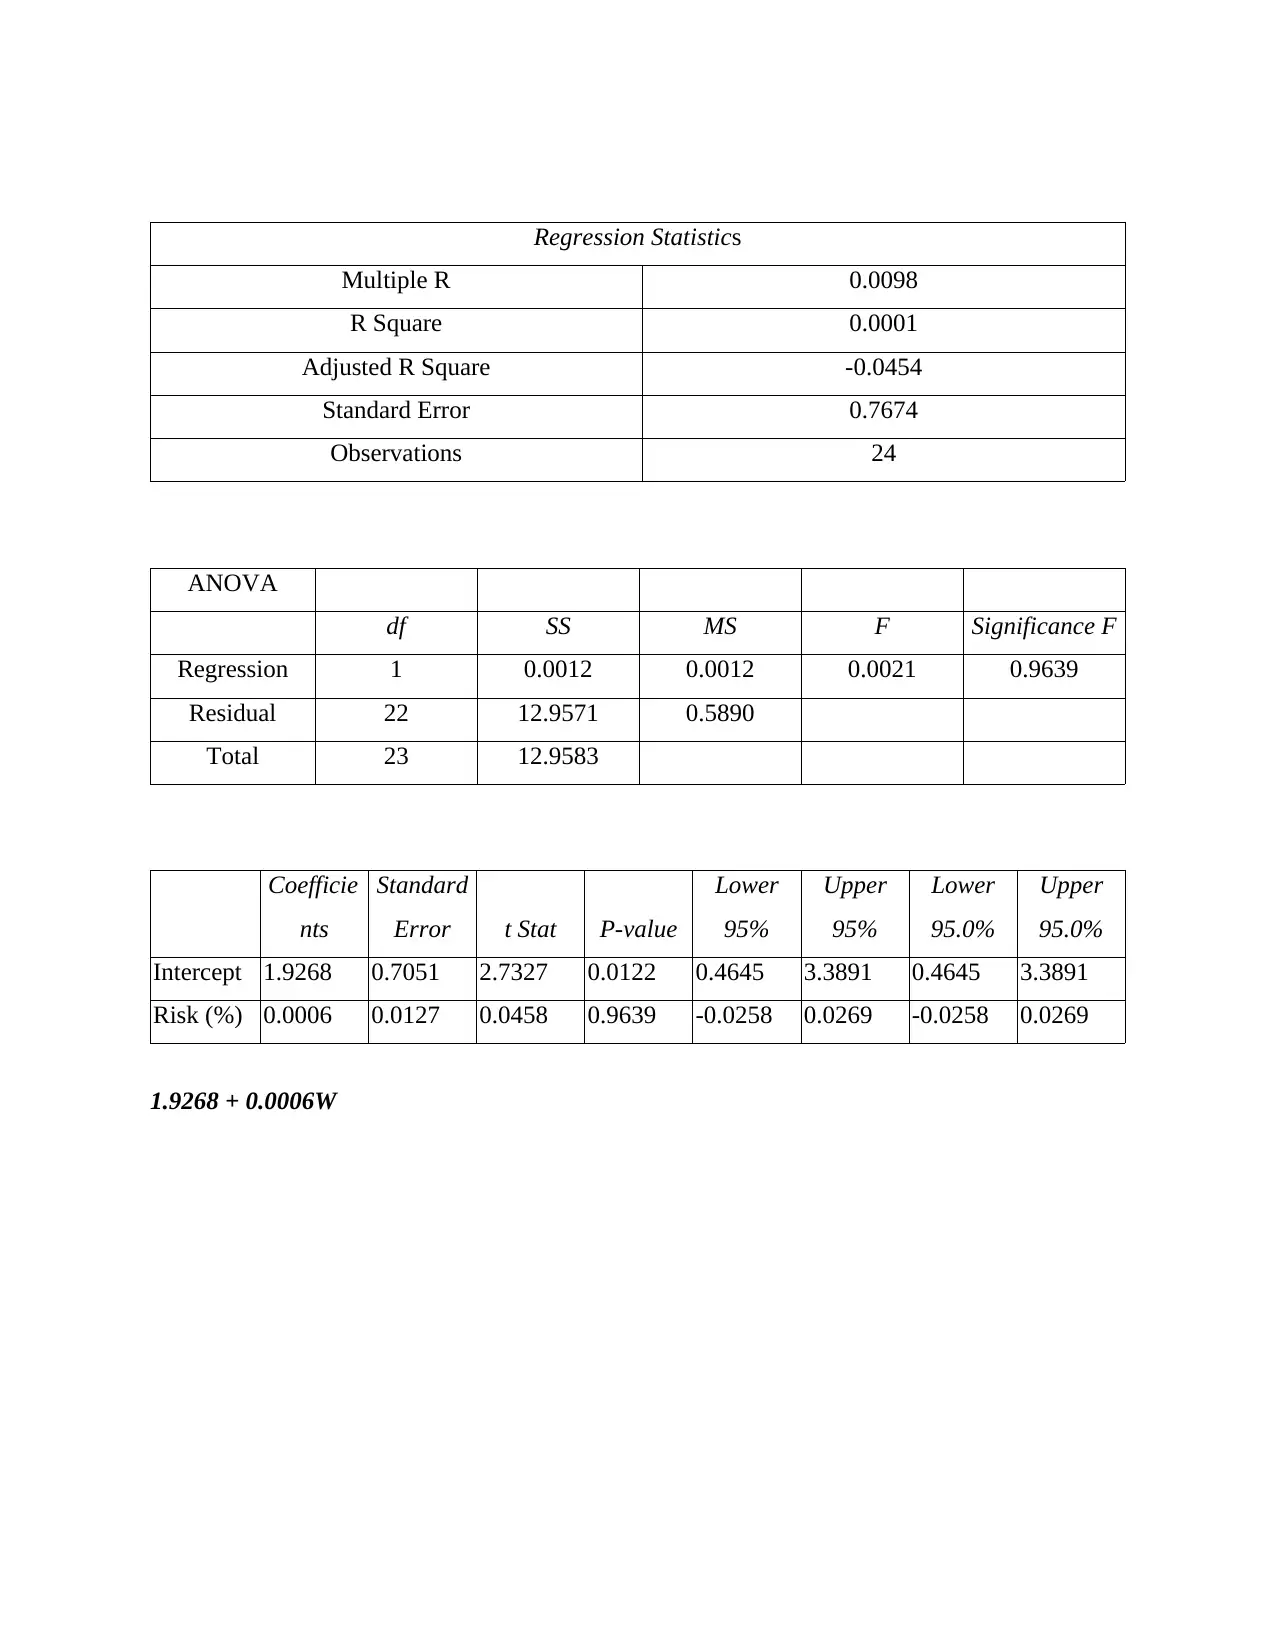
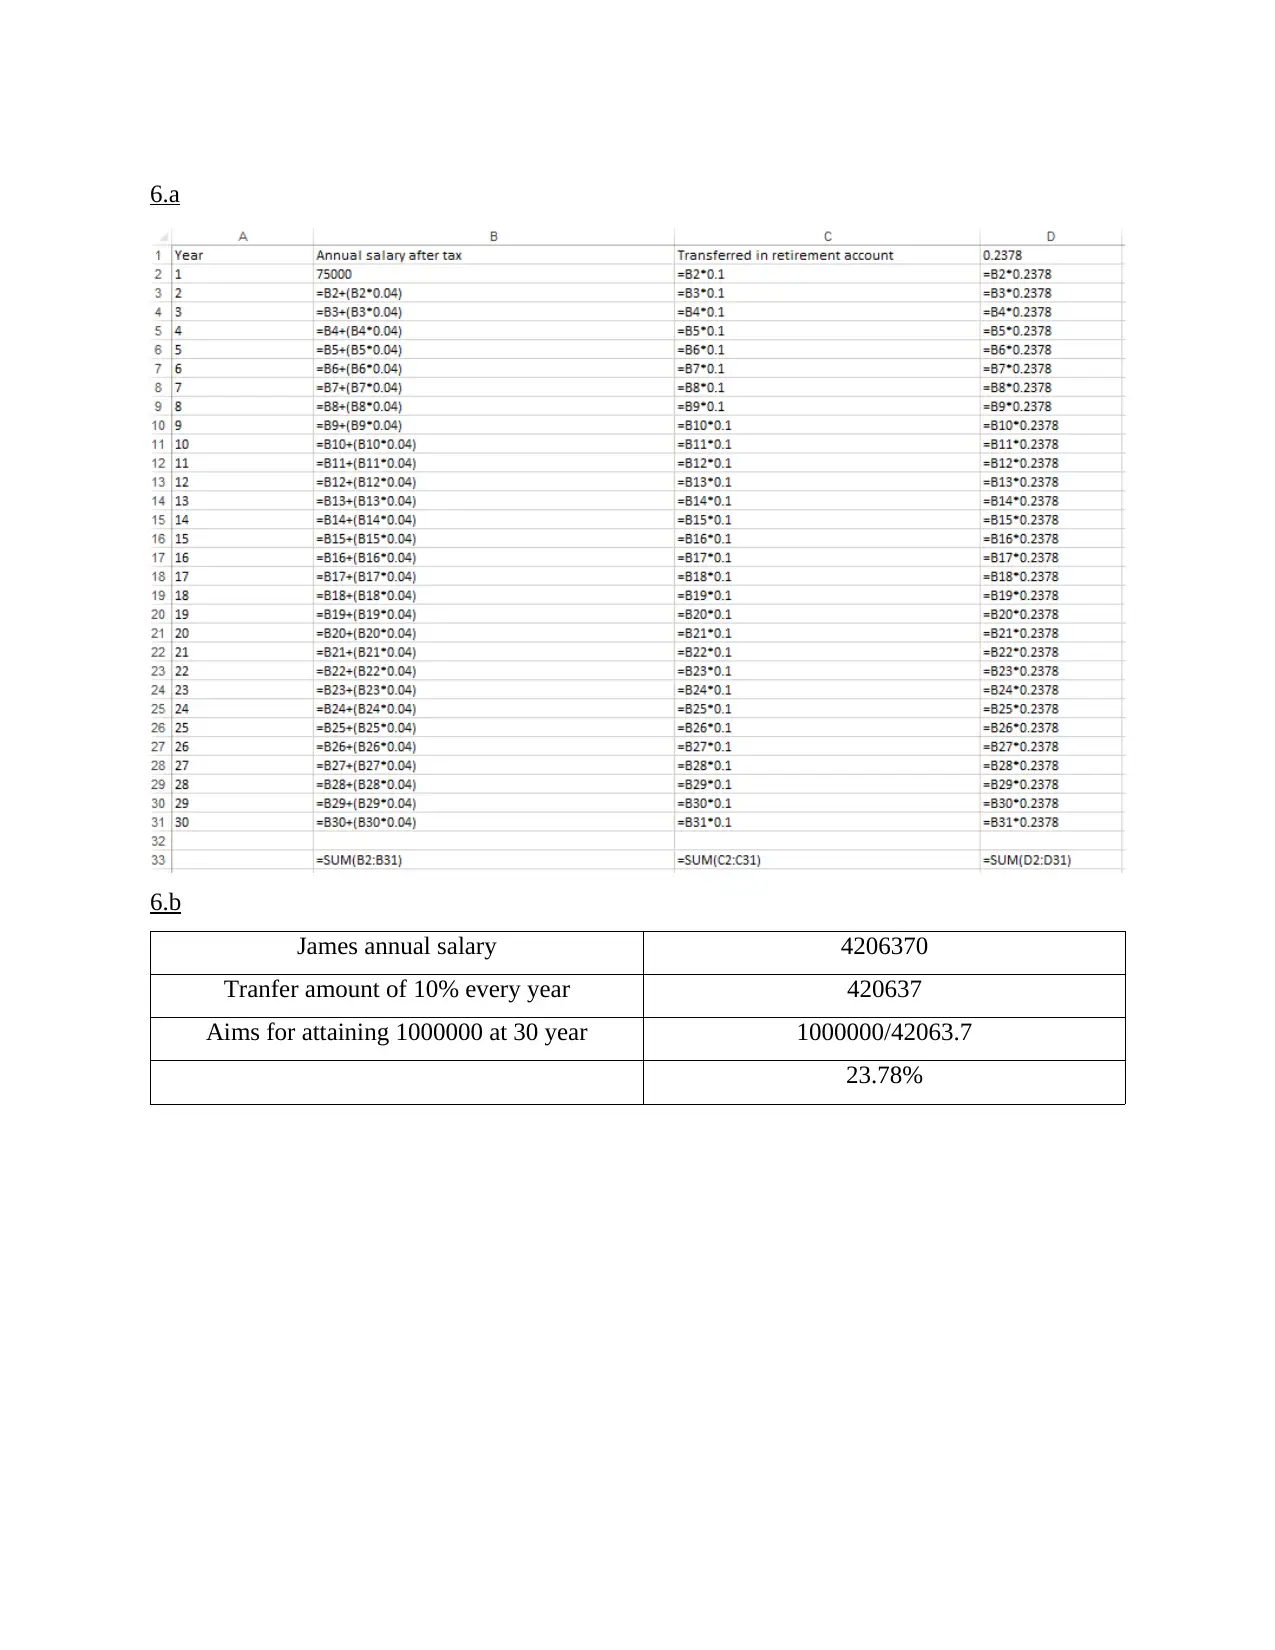
This business analytics report delves into various aspects of data analysis and predictive modeling. It begins by explaining how to measure the accuracy of classification models using the confusion matrix and related metrics like precision and recall. The report then explores the application of logistic regression with a hypothetical example involving technical and non-technical articles. Section B focuses on developing regression models, including steps for predicting spending patterns and a discussion on predictive models for new customers. The report also analyzes data, providing insights and recommendations based on repair data and suggests additional data points to enhance analysis. Furthermore, it suggests a predictive model for assessing the risk of diabetes based on age, weight, and gender, providing estimated regression models for each factor. The report concludes with additional analyses, including salary and transfer amount calculations and references to relevant online resources. This report provides a comprehensive overview of business analytics techniques, demonstrating the application of statistical methods in various business scenarios. The report uses examples to illustrate the concepts and includes the formulas used to derive the results.
Document Page
BUSINESS ANALYTICS
tabler-icon-diamond-filled.svg

Secure Best Marks with AI Grader

Need help grading? Try our AI Grader for instant feedback on your assignments.
Document Page
TABLE OF CONTENTS
SECTION A.....................................................................................................................................2
1 Explaining how to measure accuracy of classification model.................................................2
2. Application of logistic regre...................................................................................................4
SECTION B.....................................................................................................................................5
3.a Steps for developing regression model for predicting spending more than $700.................5
3.b Developing predictive model for predicting spend amount of a new male customer with
specified criteria..........................................................................................................................6
4.a Analysing data with reference to insights and recommendation...........................................6
4.b Other data could be added for making it more useful...........................................................6
5.a What predictive model is suggested related to risk of diabetes to age, weight and gender of
person..........................................................................................................................................7
5.b Developing estimated regression model...............................................................................7
6.a..............................................................................................................................................10
6.b..............................................................................................................................................10
REFERENCES..............................................................................................................................11
Document Page
SECTION A
1 Explaining how to measure accuracy of classification model
Classification model attempts for drawing conclusion through observed values as this
will try for predicting value of one or more outcomes.
Table 1
Confusion matrix Actual
Predicted
True Positive False Positive
False Negative True Negative
Accuracy (TP + TN)/ (TP + TN + FP + FN)
Precession TP / (TP +FP)
Recall TP / (TP + FN)
True Positive rate TP / (TP + FN)
False Positive rate FP/ (FP + Tn)
It could be measured with key testing metrics which is stated below:
Confusion matrix: It is referred as matrix representation of outcomes of binary testing
(Confusion matrix, 2019). For instance, consider case of forecasting malaria so in this context
medical testing has been done with outcome of some specific tests. In actual, one is going for
validating hypothesis of declaring that person has malaria is acceptable of not. With the
assumptions of 100 people, 20 people have malaria but in real scenario, only 15 has malaria and
in those 15 also, 12 people were diagnosed correctly. Let, put this outcome in confusion matrix:
Table 2
Confusion matrix
Actual
Having malaria Not having malaria
Predicted
Having malaria 12 8
Not having malaria 3 77
With combination of table 1 and 2,
ï‚· True positive: 12 (Correctly predicted)
Document Page
ï‚· True negative: 77 (Correctly predicted)
ï‚· False positive: 8 (Low risk error)
ï‚· False negative: 3 (Type-I error)
With context of accuracy of prediction model, the outcome must be in ratio of accurately
predicted number along with total number of people i.e. (12+77)/100 which is 0.89 with study of
confusion matrix, it has been extracted:
ï‚· On basis of top row depicting the aggregate of prediction for having malaria. In these
predictions, it had been forecasted correctly that 12 people are correctly having malaria in
actual. So, ratio 12/ (12 + 8) is 0.6 is accuracy measure of model for detecting person to
have malaria which is known as precision of model.
ï‚· With consideration of first column, it signifies total number of people having malaria in
actual and it has been forecasted that 12 are correct. Henceforth, ratio 12/ (12 + 3) is 0.8
as accuracy measure of model for detecting person out of all people who have malaria in
actual is termed as recall.
tabler-icon-diamond-filled.svg

Secure Best Marks with AI Grader

Need help grading? Try our AI Grader for instant feedback on your assignments.
Document Page
2. Application of logistic regre
Document Page
Logistic regression is very useful techniques for understanding or to forecast effect of
series of variable with context of binary response variable (Logistic regression, 2019). In this,
hypothetical example has been created of two classes labeled 0 and 1 which represents technical
and non-technical article (class 0 is negative class which signifies about probability of less than
0.5 through sigmoid function where it is classified as 0. In the same series, class 1 is positive
class and if probability is greater than 0.5 then it is categorised as 1. Every class has two features
time which shows average time required for reading an article in an hour and sentences reflect
number of sentences in book. Now there is requirement of training logistic regression model
where training engages to extract optimal values of coefficients such as B0, B1 and B2 and
during training there is extraction of value of coefficients as first step with application of
coefficient as other step for optimising their value and continuation to get consistent accuracy
through model. In this example, it has been iterated for 20 times but it could be iterated for
getting higher accuracy.
SECTION B
3.a Steps for developing regression model for predicting spending more than $700
Steps
1. On XlMiner analysis toolPak pane, logistic regression must be clicked.
2. Enter B1:B501 for input Y range as these are output variables.
3. Enter C1:G501 for input X range as predictor variables.
4. Keep labels selected as first row comprises labels which describes content of every
column.
5. Its constant is zero then there will be absence of constant term in equation.
6. Selection of confidence level 95%.
7. Enter H1 for output range.
8. Click Ok.
3.b Developing predictive model for predicting spend amount of a new male customer with
specified criteria
In this scenario, predictive model could not be implied because of not able to meet all
criteria.
Document Page
4.a Analysing data with reference to insights and recommendation
Count - Type of repair Type of repair
Repairperson 1 2 Total Result
1 4 6 10
2 23 17 40
3 17 23 40
Total Result 44 46 90
On basis of above data, there is evaluation of type of repair and name of repair person.
With context to type of repair, mechanical type is denoted as 1 and electrical is replaced as 2.
Simultaneously, on basis repair person James, John and bob has been denoted with 1, 2 and 3
respectively. It could be clearly viewed that John and Bob are at equal number of repair but John
had attained expertise in mechanical whereas Bob in Electrical. Conversely, James had repaired
10 in which it is combination of 4 mechanical and 6 electrical repair.
4.b Other data could be added for making it more useful
In this data, level of repair could be categorised to be highly specific such as low,
medium and high.
5.a What predictive model is suggested related to risk of diabetes to age, weight and gender of
person
Regression could be used as it could be both logistic and linear as well. In this study, linear
regression is implied because it shows ease which has the strongest association with likelihood
and laid more emphasis on placing of improving variables over delivery cost.
5.b Developing estimated regression model
Age = X
Regression Statistics
Multiple R 0.8509
R Square 0.7241
Adjusted R Square 0.7115
Standard Error 7.2956
Observations 24
tabler-icon-diamond-filled.svg

Paraphrase This Document

Need a fresh take? Get an instant paraphrase of this document with our AI Paraphraser
Document Page
ANOVA
df SS MS F Significance F
Regression 1 3072.9842 3072.9842 57.7345 0.0000
Residual 22 1170.9741 53.2261
Total 23 4243.9583
Coefficie
nts
Standard
Error t Stat P-value
Lower
95%
Upper
95%
Lower
95.0%
Upper
95.0%
Intercept 20.8831 6.7030 3.1155 0.0050 6.9819 34.7842 6.9819 34.7842
Risk (%) 0.9175 0.1207 7.5983 0.0000 0.6671 1.1679 0.6671 1.1679
20.88 + 0.9175X
Weight = Y
Regression Statistics
Multiple R 0.4110
R Square 0.1689
Adjusted R Square 0.1312
Standard Error 10.9081
Observations 24
ANOVA
df SS MS F Significance F
Regression 1 532.1114 532.1114 4.4720 0.0460
Residual 22 2617.7220 118.9874
Total 23 3149.8333
Document Page
Coefficie
nts
Standard
Error t Stat P-value
Lower
95%
Upper
95%
Lower
95.0%
Upper
95.0%
Intercept 48.4193 10.0221 4.8313 0.0001 27.6348 69.2037 27.6348 69.2037
Risk (%) 0.3818 0.1805 2.1147 0.0460 0.0074 0.7562 0.0074 0.7562
48.4193 + 0.3818Y
Gender= Z
Regression Statistics
Multiple R 0.1195
R Square 0.0143
Adjusted R Square -0.0305
Standard Error 0.5167
Observations 24
ANOVA
df SS MS F Significance F
Regression 1 0.0851 0.0851 0.3187 0.5781
Residual 22 5.8732 0.2670
Total 23 5.9583
Coefficie
nts
Standard
Error t Stat P-value
Lower
95%
Upper
95%
Lower
95.0%
Upper
95.0%
Intercept 1.1970 0.4747 2.5216 0.0194 0.2125 2.1815 0.2125 2.1815
Risk (%) 0.0048 0.0086 0.5646 0.5781 -0.0129 0.0226 -0.0129 0.0226
1.1970 + 0.0048Z
Lifestyle = W
Document Page
Regression Statistics
Multiple R 0.0098
R Square 0.0001
Adjusted R Square -0.0454
Standard Error 0.7674
Observations 24
ANOVA
df SS MS F Significance F
Regression 1 0.0012 0.0012 0.0021 0.9639
Residual 22 12.9571 0.5890
Total 23 12.9583
Coefficie
nts
Standard
Error t Stat P-value
Lower
95%
Upper
95%
Lower
95.0%
Upper
95.0%
Intercept 1.9268 0.7051 2.7327 0.0122 0.4645 3.3891 0.4645 3.3891
Risk (%) 0.0006 0.0127 0.0458 0.9639 -0.0258 0.0269 -0.0258 0.0269
1.9268 + 0.0006W
tabler-icon-diamond-filled.svg

Secure Best Marks with AI Grader

Need help grading? Try our AI Grader for instant feedback on your assignments.
Document Page
6.a
6.b
James annual salary 4206370
Tranfer amount of 10% every year 420637
Aims for attaining 1000000 at 30 year 1000000/42063.7
23.78%
Document Page
REFERENCES
Online
Confusion matrix. 2019. [Online]. Available through
<https://towardsdatascience.com/understanding-confusion-matrix-a9ad42dcfd62>.
Logistic regression. 2019. [Online]. Available through
<https://www.saedsayad.com/logistic_regression.htm>.
chevron_up_icon
1 out of 12
circle_padding
hide_on_mobile
zoom_out_icon
[object Object]