Business Analytics Report: Analysis of Key Business Principles
VerifiedAdded on 2020/11/12
|11
|2422
|206
Report
AI Summary
This report delves into the core principles of business analytics, exploring its purpose, role, and strategic value in driving competitive advantages. It outlines the analytics ecosystem and its adoption across various industries, alongside an explanation of data mining processes and their implications. Task 1 focuses on defining business analytics, highlighting its significance in strategic decision-making, improving profitability, and enhancing operational efficiency. It also covers the importance of descriptive, predictive, and prescriptive analytics, and the Cross-Industry Standard Process for Data Mining (CRISP-DM). Task 2 presents a practical application, including calculations using MS-Excel, descriptive statistics, and a regression model to analyze property prices, identifying key contributing factors. The report concludes with a summary of the statistical evaluations and their implications, offering insights into the distribution levels, class intervals, and the relationships between independent and dependent variables. The analysis is relevant to a real estate buyer’s advocacy firm seeking to enter the Melbourne property market.
PRINCIPLES OF BUSINESS
ANALYTICS
ANALYTICS
Paraphrase This Document
Need a fresh take? Get an instant paraphrase of this document with our AI Paraphraser
Table of Contents
INTRODUCTION...........................................................................................................................1
TASK 1............................................................................................................................................1
TASK 2............................................................................................................................................5
2.1 Calculation using Ms-Excel.............................................................................................5
2.2 Regression Model.............................................................................................................6
2.3 Key contributing factors for property price based on results...........................................7
CONCLUSION................................................................................................................................8
REFERENCES................................................................................................................................9
INTRODUCTION
Business analytics is a skill, practices, technology which is used by mangers to explore
and investigate the previous performance of business in order to gain the insight and drive that
analysed data for business planning (Chen, Chiang and Storey, 2012). It focuses basically on
developing a new understanding and new insights to improve its business performance which is
based on various statistical and data methods. The following report contains the detail analysis of
purpose, role and importance of business analytics in order to create the strategic value and
competitive advantages. It also defines the analytics ecosystem and their adoption in various
industries. It also explains the process involved in data mining and their implications.
TASK 1
Business analytics: Business analytics is a considered as a practice, technology and skills used
by managers to investigate and explore the past performance of business to take strategic
decisions (Hofmann and Klinkenberg, 2013). Business intelligence mainly focuses on the use of
consistence metrics to measure the previous performance and make strategic business decisions
in order to achieve its organisational goal. It makes extensive uses of various statistical analyses
which includes predictive and explanatory models and fact based management in order to
support decision making process.
Following are the various importances of Business analytics:
It is a methodology which is used by managers to make strategic and sound commercial
decisions to gain competitive advantages and create strategic value. It basically impacts
the complete functioning of an organisation.
It also helps the mangers to improve the profitability of a business and increase its market
share and revenue which help companies to provide higher return to its various
shareholders.
It also facilitates complete understanding of various available data through primary and
secondary sources. Mangers analyse these data in order to improve its business
operational efficiency of various departments to reduce its cost and gain competitive
advantages over its competitors.
Mangers use these data and combine it with various well though available models to
improve its business decision making process.
1
⊘ This is a preview!⊘
Do you want full access?
Subscribe today to unlock all pages.
Trusted by 1+ million students worldwide
It also converts the various available data into valuable information which is used by
mangers to take effective decisions in order to gain the competitive advantages. This
information is provided into required given format which is comfortable to decision
makers.
Business analytics is an important aspect of any business as it provides a deep understanding
about the business and industry in which a business is established (Schläfke, Silvi and Möller,
2012). The main role of business analytics is to provide comprehensive data about business and
identify the problems and improve its business operational efficiency to reduce the cost and
increase the quality of product delivered by company to gain competitive advantage over its
competitors and capture market share and increase its financial position. Business analytics also
provides the deep information about the technological enhancement in industries and adopt the
latest technology to capture the market share by improving its product quality and financial
position. The main purpose of using business analytics is to gain the insight knowledge and data
to provide the better and effective decisions to create a strategic value and gain competitive
advantages.
Analytics eco system si a system in which companies and business analyst uses various
analytics tools to determine the need of its customers and create value. It also help companies to
improve its business performance by optimizing its cost and increasing its market share there are
various methods of analytics used by companies such as follows:
Descriptive Analytics: Descriptive analytics is used by analyst to describe and summarize the
various raw data available through various sources and makes it easy to interpret by top level of
managements to understand the needs of its consumers and deliver effective products to satisfy
their needs and improve its business performance and its financial position (De Oliveira,
McCormack and Trkman, 2012). It is an analytics which describe the past, past include the data
which occurred in one year or in one minute. It underlies the data count, aggregate of a various
filtered column in which basic maths are applied.
Predictive Analytics: Predictive analytics is a root which has an ability to predict that which
may happen. In this type of analytic managers make prediction in order to understand the future.
It provides the estimates of the likely hood of the outcome which can incur in future. The
foundations of predictive analytic is completely based upon the probabilities, companies uses
these statistics to make forecast the future sales while preparing budget for the company.
2
Paraphrase This Document
Need a fresh take? Get an instant paraphrase of this document with our AI Paraphraser
Prescriptive Analytics: Prescriptive analytics is new field which allows its users to provide
various possible actions which can be used to over the problems and draw suitable solutions.
These analytics are basically focuses on providing advice to achieve certain solution of a given
problem. It basically attempts to quantify the various effects of future decisions to advice on the
possible outcomes before any decisions are made (Van Barneveld, Arnold and Campbell, 2012).
Data provided through these types of analytics are beyond the predictive and descriptive
analytics by recommending more than one various possible course of action. Basically it predicts
multiple possible futures and helps companies to assess a various possible outcomes which are
based upon the course of action. This type of analytic are basically used to optimize the
scheduling, production and inventory in the supply chain management.
Cross Industry Standard Process for Data Mining: Cross Industry Standard Process for Data
Mining also known as CRISP DM is a standard process model which helps the mangers to define
the common techniques which are used by various data mining experts in data analytics models
(Cao, Duan and Li, 2015). This process was developed in the year 1996 and it has now become
the EU project under the funding initiative in 1997 by ESPRIT. It divides the data mining
process in to six major processes such as under:
a) Data Cleaning: It is the first step in which analyst cleans the data by using various
techniques such as filling up the data which are missing and combines them to
compute the results in order to improve the business operations of an organisation.
b) Data Integration: in this process the data collected from various sources are
integrated as these data are in various formats stored in different locations. Basically
this is the most complex process as these data normally does not match the various
sources from which it is collected.
c) Data Selection: In this stage data which is most relevant to analyse the trends or
change in customer taste and preference are retrieved from different database. In this
stage a huge amount of historical data required for analysis are selected and stored.
d) Data Transformation: The next process is to consolidate and transform the selected
data into various suitable forms for mining these data. Basically this process includes
aggregation, normalization, generalization etc.
3
e) Data Mining: In this process the data experts applies various methods in order to
extract the patterns from these data. This mining process includes various tasks which
includes classification, clustering, prediction, time series analysis etc.
Pattern Evaluation: After the data mining process is completed data experts identifies the most
interesting patterns which represents knowledge based on various types of interesting measures.
A pattern which is evaluated is considered to be an interesting pattern when it is easily
understandable and potentially useful (Saxena and Srinivasan, 2012).
f) Knowledge Representation: Knowledge representation is a means which is used by
data expert to represent the data which is easily understandable by user and is
appealing. It also includes the information which is mined from these data by using
various techniques.
The CRISP – DM also consists of different six phases which basically occurs in a cyclical
process which is similar to data mining process (Côrte-Real, Ruivo and Oliveira, 2014). First
step is to understand the requirements of Business and evaluation of various sources and
assumptions to consider other important factors. The step involves the understanding of the data
later in the next step data is prepared to find out the various available outcomes.
There are various challenges which are faced by an agile business environment to
implement the data mining and business analytics. Following are some various challenges:
Analytics Talent: Due to the scarcity of data Analyst Company cannot find the
right talent in the market to implement the data mining process in companies. As
this is a new area and the talent for analytics are still under the development.
Culture: As this data analytics is a new concept companies still practice the old
traditional management style for decision making process. Some companies think
that changing to new contemporary management style will affect the business
structure resulting in the loss of all the previous knowledge.
Return on Investment: As this is a new concept and attracts the cost, companies
think that adapting to the new business analytics project is complex and costly; it
might incur additional charges resulting in the increased cost of production.
4
⊘ This is a preview!⊘
Do you want full access?
Subscribe today to unlock all pages.
Trusted by 1+ million students worldwide
TASK 2
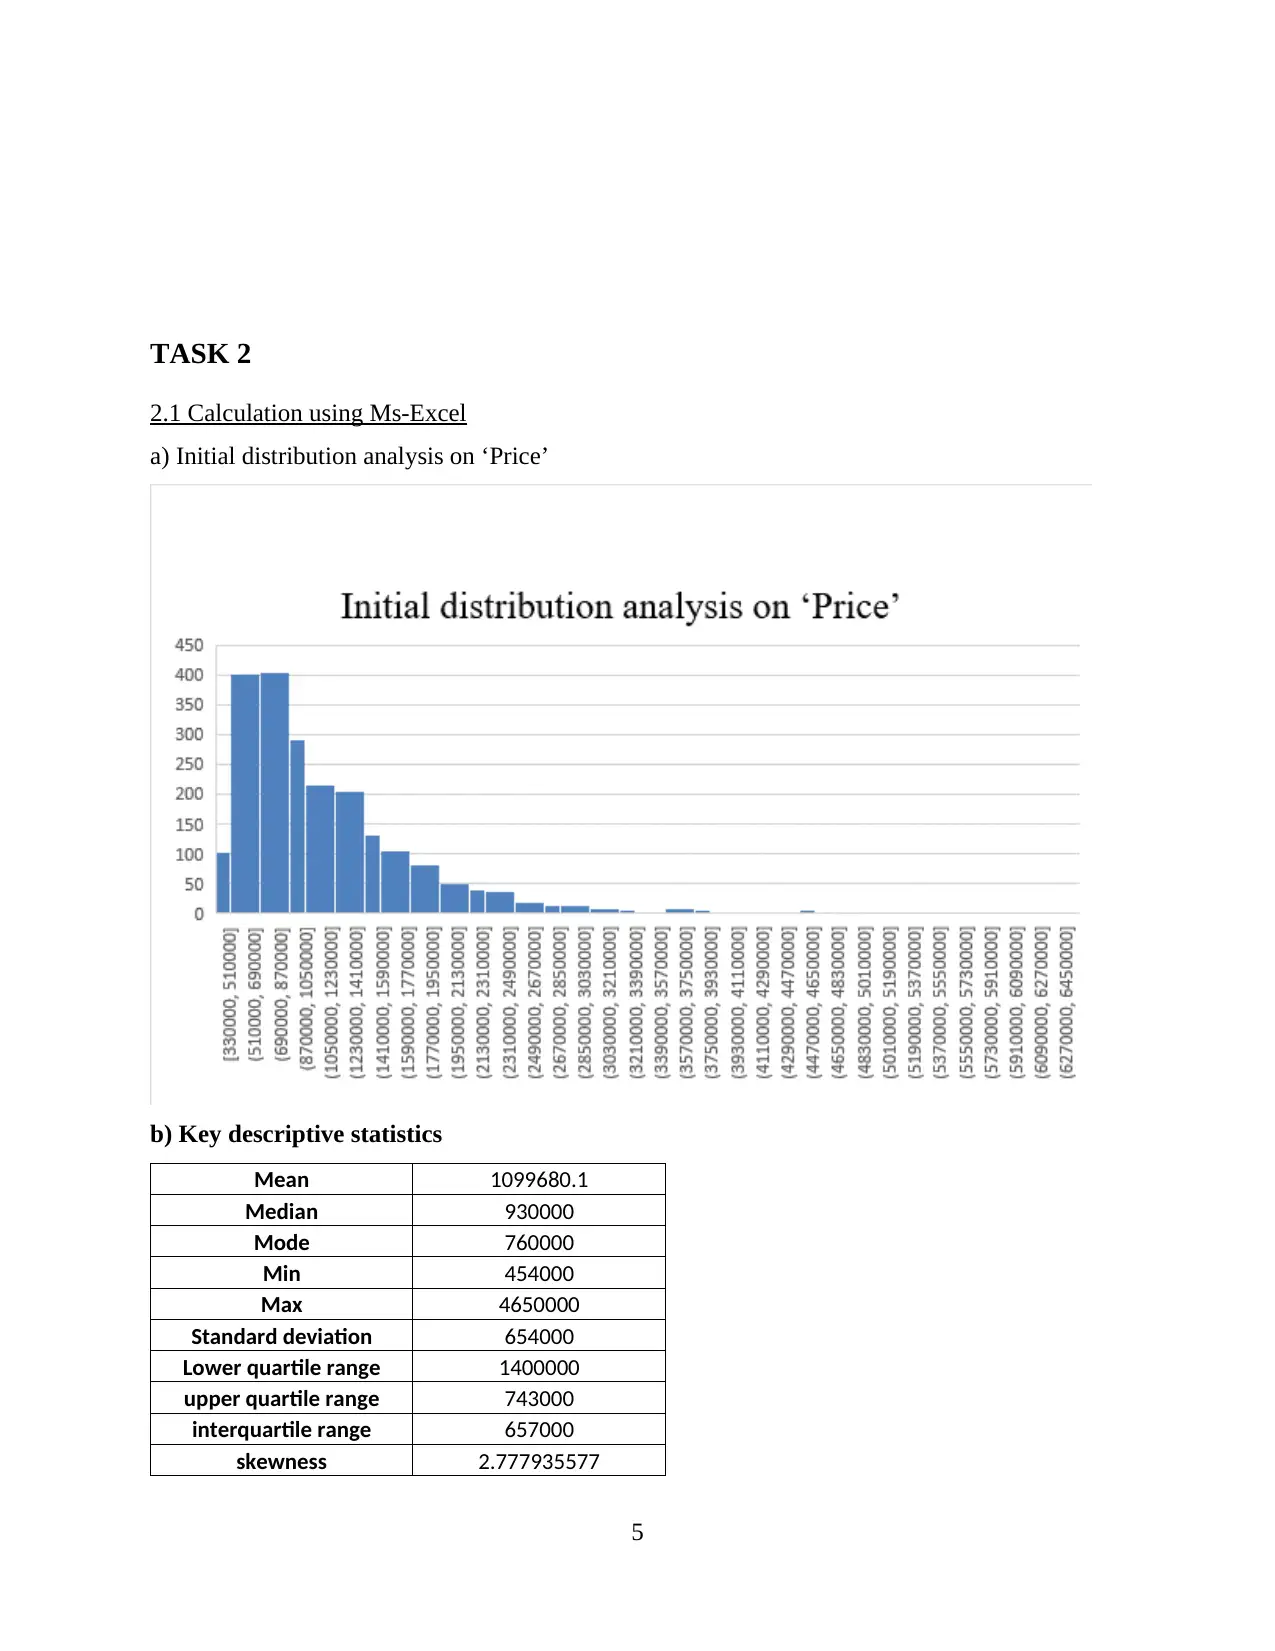
2.1 Calculation using Ms-Excel
a) Initial distribution analysis on ‘Price’
b) Key descriptive statistics
Mean 1099680.1
Median 930000
Mode 760000
Min 454000
Max 4650000
Standard deviation 654000
Lower quartile range 1400000
upper quartile range 743000
interquartile range 657000
skewness 2.777935577
5
Paraphrase This Document
Need a fresh take? Get an instant paraphrase of this document with our AI Paraphraser
variance 808.7026648
range 4196000
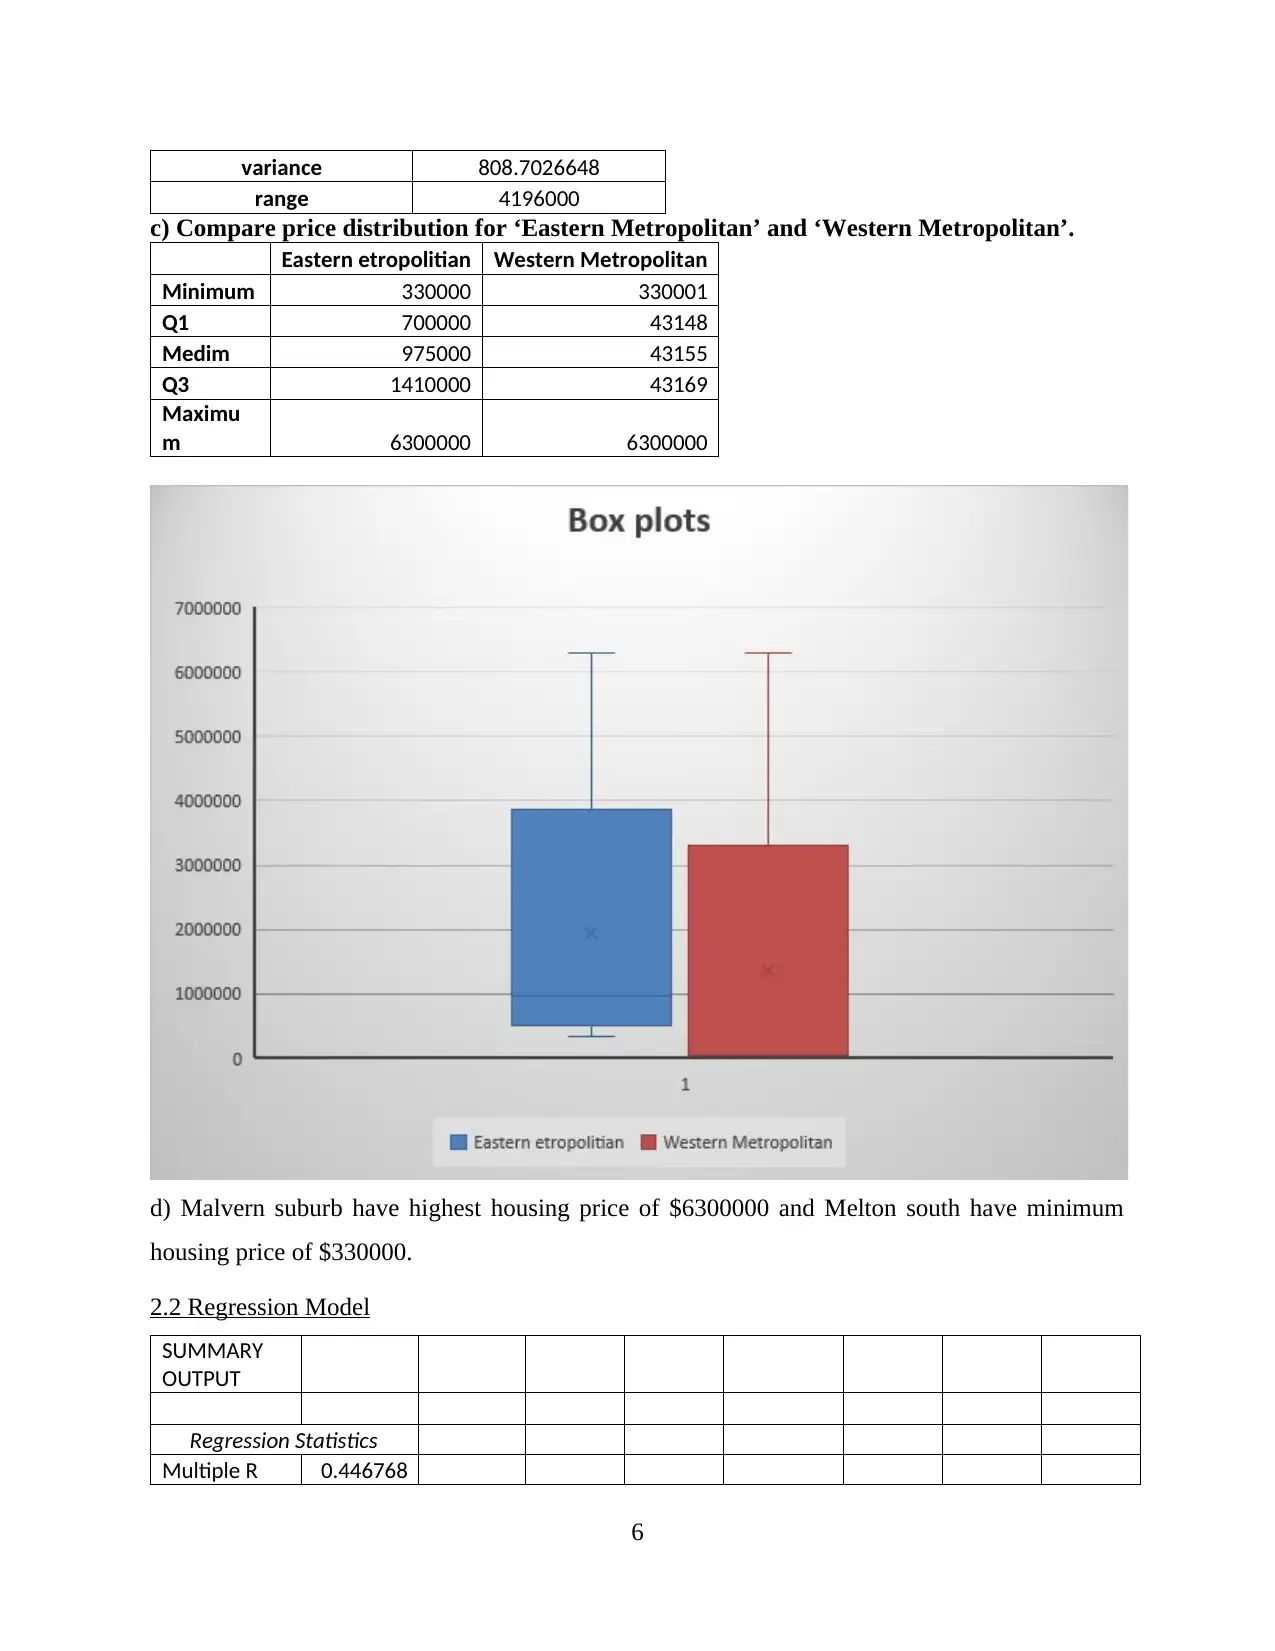
c) Compare price distribution for ‘Eastern Metropolitan’ and ‘Western Metropolitan’.
Eastern etropolitian Western Metropolitan
Minimum 330000 330001
Q1 700000 43148
Medim 975000 43155
Q3 1410000 43169
Maximu
m 6300000 6300000
d) Malvern suburb have highest housing price of $6300000 and Melton south have minimum
housing price of $330000.
2.2 Regression Model
SUMMARY
OUTPUT
Regression Statistics
Multiple R 0.446768
6
range 4196000
c) Compare price distribution for ‘Eastern Metropolitan’ and ‘Western Metropolitan’.
Eastern etropolitian Western Metropolitan
Minimum 330000 330001
Q1 700000 43148
Medim 975000 43155
Q3 1410000 43169
Maximu
m 6300000 6300000
d) Malvern suburb have highest housing price of $6300000 and Melton south have minimum
housing price of $330000.
2.2 Regression Model
SUMMARY
OUTPUT
Regression Statistics
Multiple R 0.446768
6
R Square 0.199602
Adjusted R
Square 0.19135
Standard
Error 7.300915
Observations 99
ANOVA
df SS MS F
Significan
ce F
Regression 1
1289.39
1
1289.39
1
24.1896
8 3.56E-06
Residual 97
5170.42
5
53.3033
5
Total 98
6459.81
7
Coefficien
ts
Standar
d Error t Stat P-value
Lower
95%
Upper
95%
Lower
95.0%
Upper
95.0%
Intercept 21.43952
1.60257
4
13.3781
8
9.45E-
24 18.25886
24.6201
9
18.2588
6
24.6201
9
1870000 -6.4E-06 1.3E-06 -4.9183
3.56E-
06 -9E-06
-3.8E-
06 -9E-06
-3.8E-
06
0 500000 1000000 1500000 2000000 2500000 3000000 3500000 4000000 4500000 5000000
0
5
10
15
20
25
30
35
40
45
50 Regression line
Price
Distance
7
⊘ This is a preview!⊘
Do you want full access?
Subscribe today to unlock all pages.
Trusted by 1+ million students worldwide
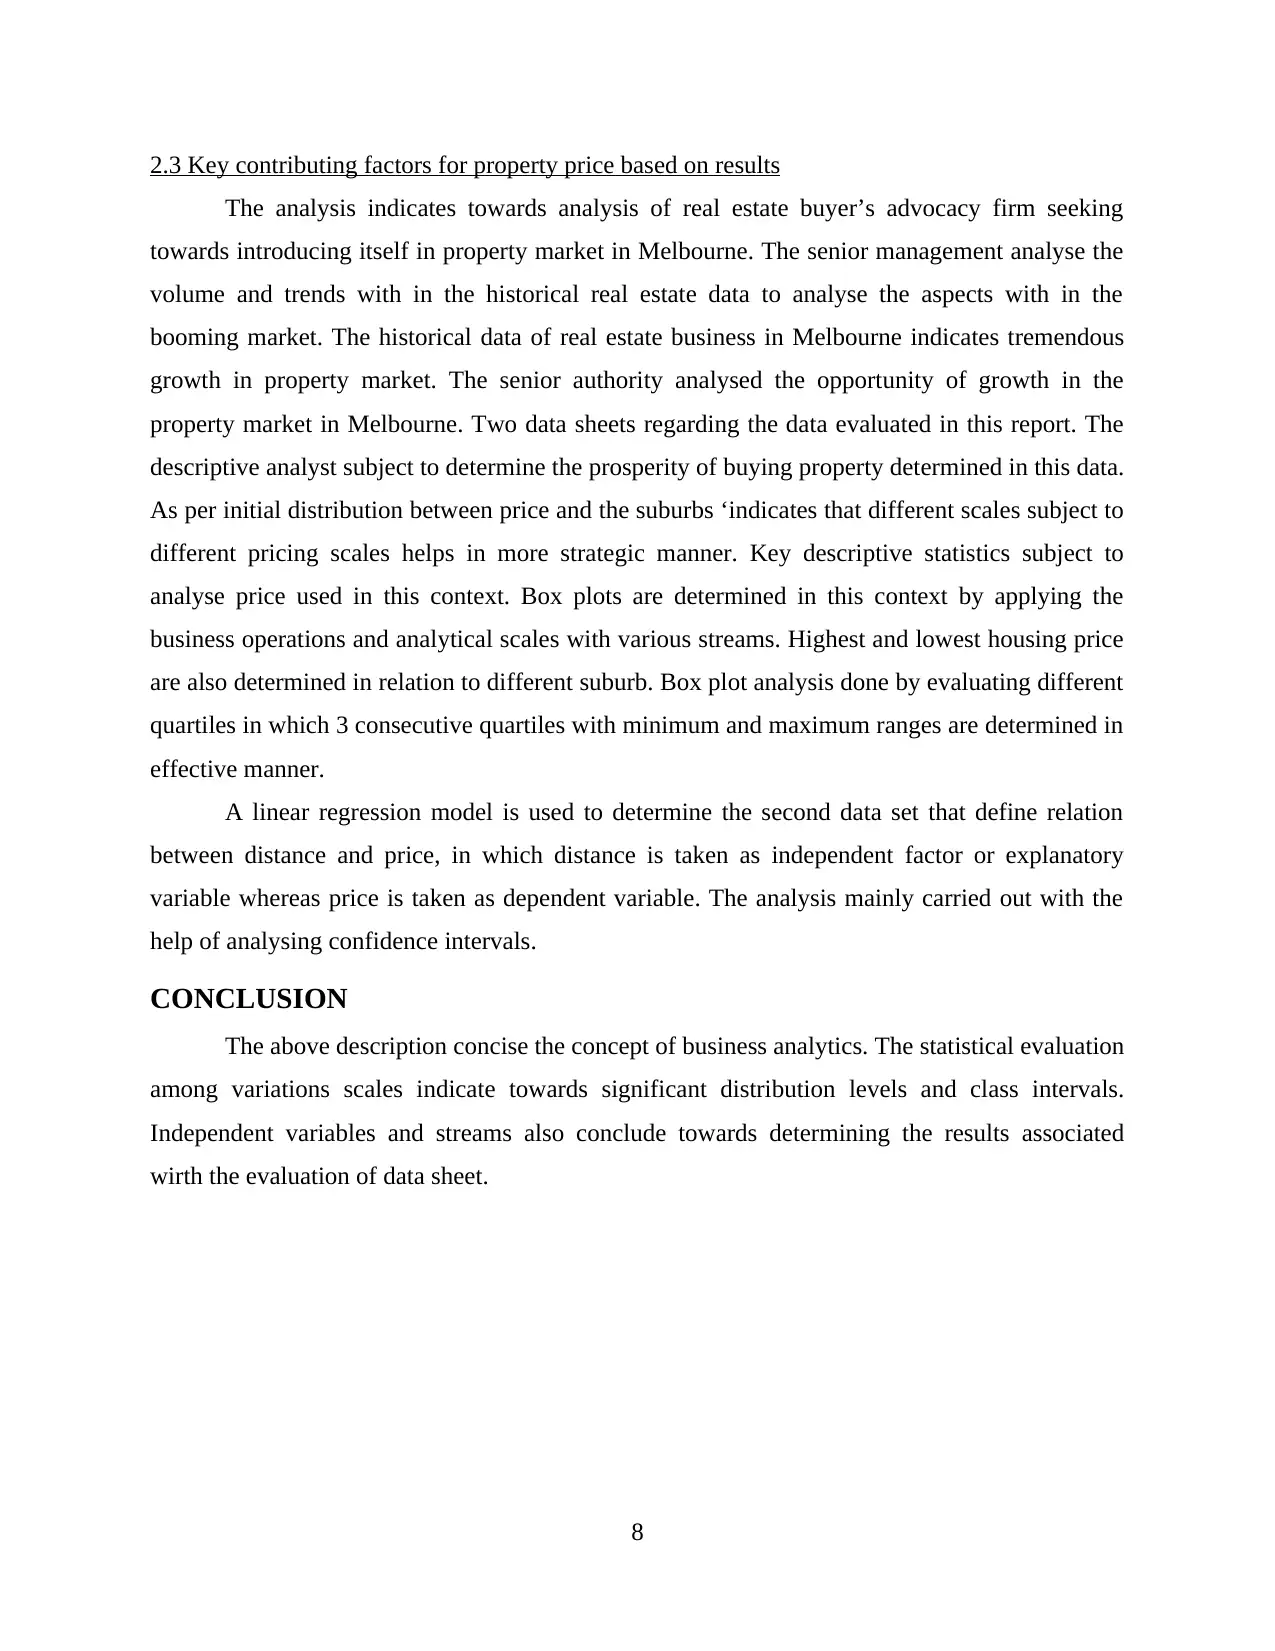
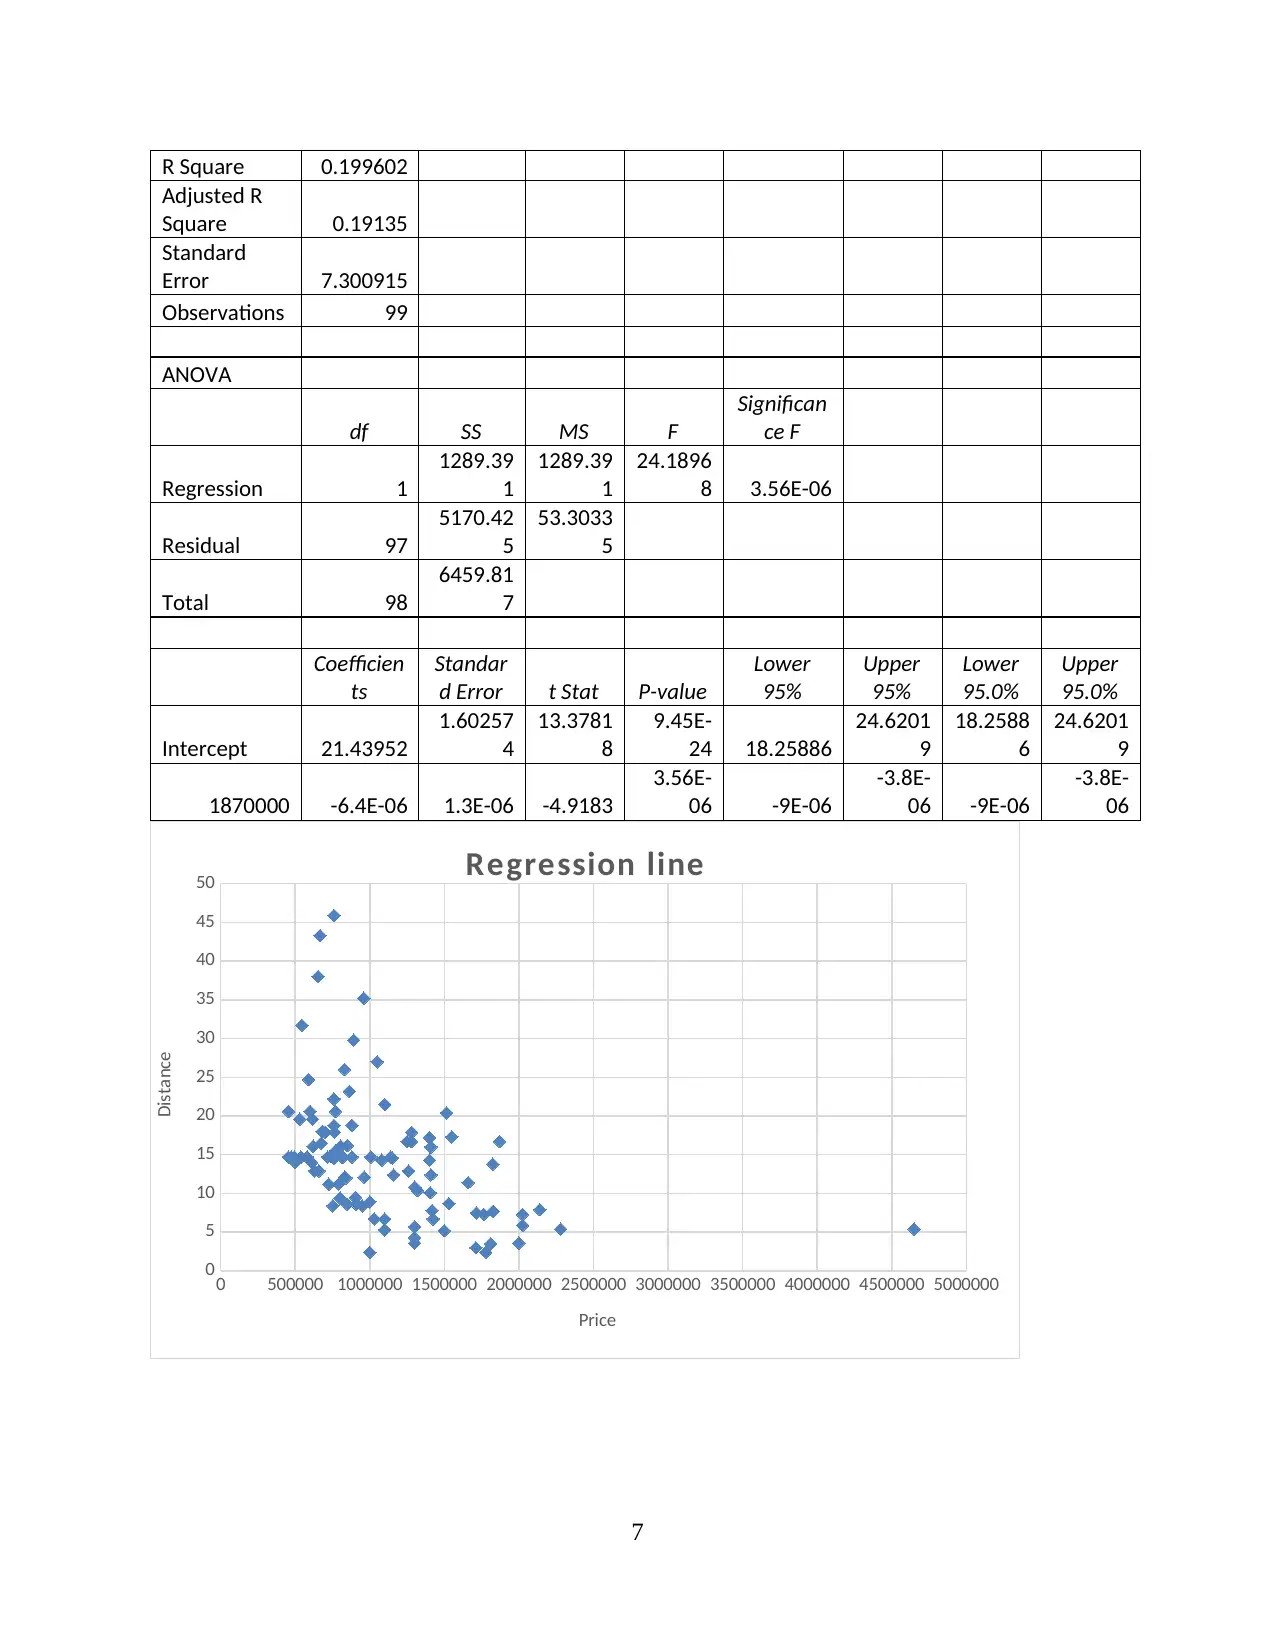
2.3 Key contributing factors for property price based on results
The analysis indicates towards analysis of real estate buyer’s advocacy firm seeking
towards introducing itself in property market in Melbourne. The senior management analyse the
volume and trends with in the historical real estate data to analyse the aspects with in the
booming market. The historical data of real estate business in Melbourne indicates tremendous
growth in property market. The senior authority analysed the opportunity of growth in the
property market in Melbourne. Two data sheets regarding the data evaluated in this report. The
descriptive analyst subject to determine the prosperity of buying property determined in this data.
As per initial distribution between price and the suburbs ‘indicates that different scales subject to
different pricing scales helps in more strategic manner. Key descriptive statistics subject to
analyse price used in this context. Box plots are determined in this context by applying the
business operations and analytical scales with various streams. Highest and lowest housing price
are also determined in relation to different suburb. Box plot analysis done by evaluating different
quartiles in which 3 consecutive quartiles with minimum and maximum ranges are determined in
effective manner.
A linear regression model is used to determine the second data set that define relation
between distance and price, in which distance is taken as independent factor or explanatory
variable whereas price is taken as dependent variable. The analysis mainly carried out with the
help of analysing confidence intervals.
CONCLUSION
The above description concise the concept of business analytics. The statistical evaluation
among variations scales indicate towards significant distribution levels and class intervals.
Independent variables and streams also conclude towards determining the results associated
wirth the evaluation of data sheet.
8
Paraphrase This Document
Need a fresh take? Get an instant paraphrase of this document with our AI Paraphraser
REFERENCES
Books and Journals:
Chen, H., Chiang, R. H. and Storey, V. C., 2012. Business intelligence and analytics: From big
data to big impact. MIS quarterly. 36(4).
Hofmann, M. and Klinkenberg, R. eds., 2013. RapidMiner: Data mining use cases and business
analytics applications. CRC Press.
Schläfke, M., Silvi, R. and Möller, K., 2012. A framework for business analytics in performance
management. International Journal of Productivity and Performance Management.
62(1). pp.110-122.
De Oliveira, M. P. V., McCormack, K. and Trkman, P., 2012. Business analytics in supply
chains–The contingent effect of business process maturity. Expert systems with
applications. 39(5). pp.5488-5498.
Van Barneveld, A., Arnold, K. E. and Campbell, J. P., 2012. Analytics in higher education:
Establishing a common language. EDUCAUSE learning initiative. 1(1). pp.l-ll.
Cao, G., Duan, Y. and Li, G., 2015. Linking business analytics to decision making effectiveness:
A path model analysis. IEEE Transactions on Engineering Management. 62(3). pp.384-
395.
Saxena, R. and Srinivasan, A., 2012. Business analytics: a practitioner’s guide. Springer Science
& Business Media.
Côrte-Real, N., Ruivo, P. and Oliveira, T., 2014. The diffusion stages of business intelligence &
analytics (BI&A): A systematic mapping study. Procedia Technology. 16. pp.172-179.
9
1 out of 11
Related Documents


Your All-in-One AI-Powered Toolkit for Academic Success.
+13062052269
info@desklib.com
Available 24*7 on WhatsApp / Email
![[object Object]](/_next/static/media/star-bottom.7253800d.svg)
Unlock your academic potential
Copyright © 2020–2025 A2Z Services. All Rights Reserved. Developed and managed by ZUCOL.