Good Harvest Organic Farm: BUS501 Business Analytics Report
VerifiedAdded on 2020/03/16
|14
|2721
|96
Report
AI Summary
This report provides a detailed business analytics analysis of Good Harvest Organic Farm, examining its sales and profit performance using a year's worth of data. The analysis utilizes SPSS to address key business questions, including identifying top-selling products, comparing payment methods (cash vs. credit/card), assessing the impact of product location on sales, and determining if there are significant differences in sales and gross profits across different months and seasons. Statistical methods such as t-tests and ANOVA are employed to test hypotheses and draw conclusions about the farm's performance. The findings reveal that the best-selling products are Water and Fruit, credit and card payments significantly differ from cash payments, product location impacts sales, and profits vary significantly across months. However, the report finds no significant seasonal impact on gross sales. The report concludes with a discussion of the results and provides recommendations based on the data analysis.
BUS501 - Business Analytics and Statistics
Name:
Lecturer name:
7th October 2017
Name:
Lecturer name:
7th October 2017
Paraphrase This Document
Need a fresh take? Get an instant paraphrase of this document with our AI Paraphraser
Table of Contents
1......................................................................................................................................Introduction
.........................................................................................................................................................3
2....................................................................Problem definition and business intelligence required
.........................................................................................................................................................4
3..........................................................................Selected analytics methods and technical analysis
.........................................................................................................................................................5
4.........................................................................................................................Results and findings
.........................................................................................................................................................5
Analysis 1: What are the top/worst selling products in terms of sales?.......................................5
Analysis 2: Is there a difference in payments methods?..............................................................6
Hypothesis 1:............................................................................................................................7
Hypothesis 2:............................................................................................................................7
Analysis 3: Are the differences in sales performance based on where the product is located in
the shop?......................................................................................................................................8
Hypothesis 4:............................................................................................................................8
Analysis 4: Is there a difference in sales and gross profits between different months of the
year?.............................................................................................................................................9
Hypothesis 5:............................................................................................................................9
Hypothesis 6:..........................................................................................................................10
Analysis 5: Are their differences in sales performance between different seasons?.................10
Hypothesis 7:..........................................................................................................................11
5. Discussion of the results and recommendations........................................................................11
References......................................................................................................................................13
Table 1: Top/Worst selling products...............................................................................................5
Table 2: t-Test: Two-Sample Assuming Equal Variances..............................................................6
Table 3: t-Test: Two-Sample Assuming Equal Variances..............................................................7
Table 4: Analysis of variance (ANOVA) for the total sales versus product location.....................8
Table 5: Mean total sales based on product location.......................................................................9
Table 6: Analysis of variance (ANOVA) for the net sales versus months....................................10
Table 7: Mean net sales based on month of the year.....................................................................11
Table 8: Analysis of variance (ANOVA) for the gross profits versus months..............................11
Table 9: Mean gross profits based on month of the year...............................................................12
Table 10: Analysis of variance (ANOVA) for the net sales versus seasons.................................13
Table 11: Mean net sales based on season.....................................................................................13
⊘ This is a preview!⊘
Do you want full access?
Subscribe today to unlock all pages.
Trusted by 1+ million students worldwide
1. Introduction
Many people are drawn to starting organic farms. One such is Good Harvest organic farm
which deals with a variety of products i.e. they deal in farming the organic products and also
selling of the products directly to the customers through one of their initiatives which is home
delivery. The organization (Good Harvest) has been in existence for about two years now. The
CEO of the company is much interested on how he can tap into data to intuitive decisions
(Das & Vidyashankar, 2006). In this study, we therefore analyse the business performance of
the company (Good Harvest Organic Farm and Market). A year data of the company touching
on a range of issues such as product name, product class, sales (gross and net sales), profits,
month of the year, and season among others are provided and as such we utilize the data to
make recommendations to the new CEO so that he can make informed decisions which are
fact based. The main challenge that the CEO would want to understand is mostly related to the
performance of the company (Siegel, 2013). He would like to see how does the performance
compare for the different months of the year/season?
2. Problem definition and business intelligence required
Any retail/sales organization need to be aware that its competitive advantage majorly relies
on continuing to make decisions that are correct and real-time. This could involve,
promotions at store front, customer incentives, checking and understanding store stock levels,
making procurements and ensuring that decisions of the organization are made in real-
time. In this case, the CEO had set out some of the research questions he wanted to be
answered in the analysis. The questions are as follows;
a) What are the top/worst selling products in terms of sales?
b) Is there a difference in payments methods?
Paraphrase This Document
Need a fresh take? Get an instant paraphrase of this document with our AI Paraphraser
c) Are the differences in sales performance based on where the product is located in the
shop? How does this effect both profits and revenue?
d) Is there a difference in sales and gross profits between different months of the year?
e) Are their differences in sales performance between different seasons?
3. Selected analytics methods and technical analysis
Statistical Package for Social Sciences (SPSS) was used for the purposes of analyzing the
data. The different research questions required different statistical analysis approach. The
approaches ranged from descriptive analytics to predictive analytics. Some of the statistical
approaches employed include ANOVA and T-test. The sample data as is presented in the
SPSS is shown below;
4. Results and findings
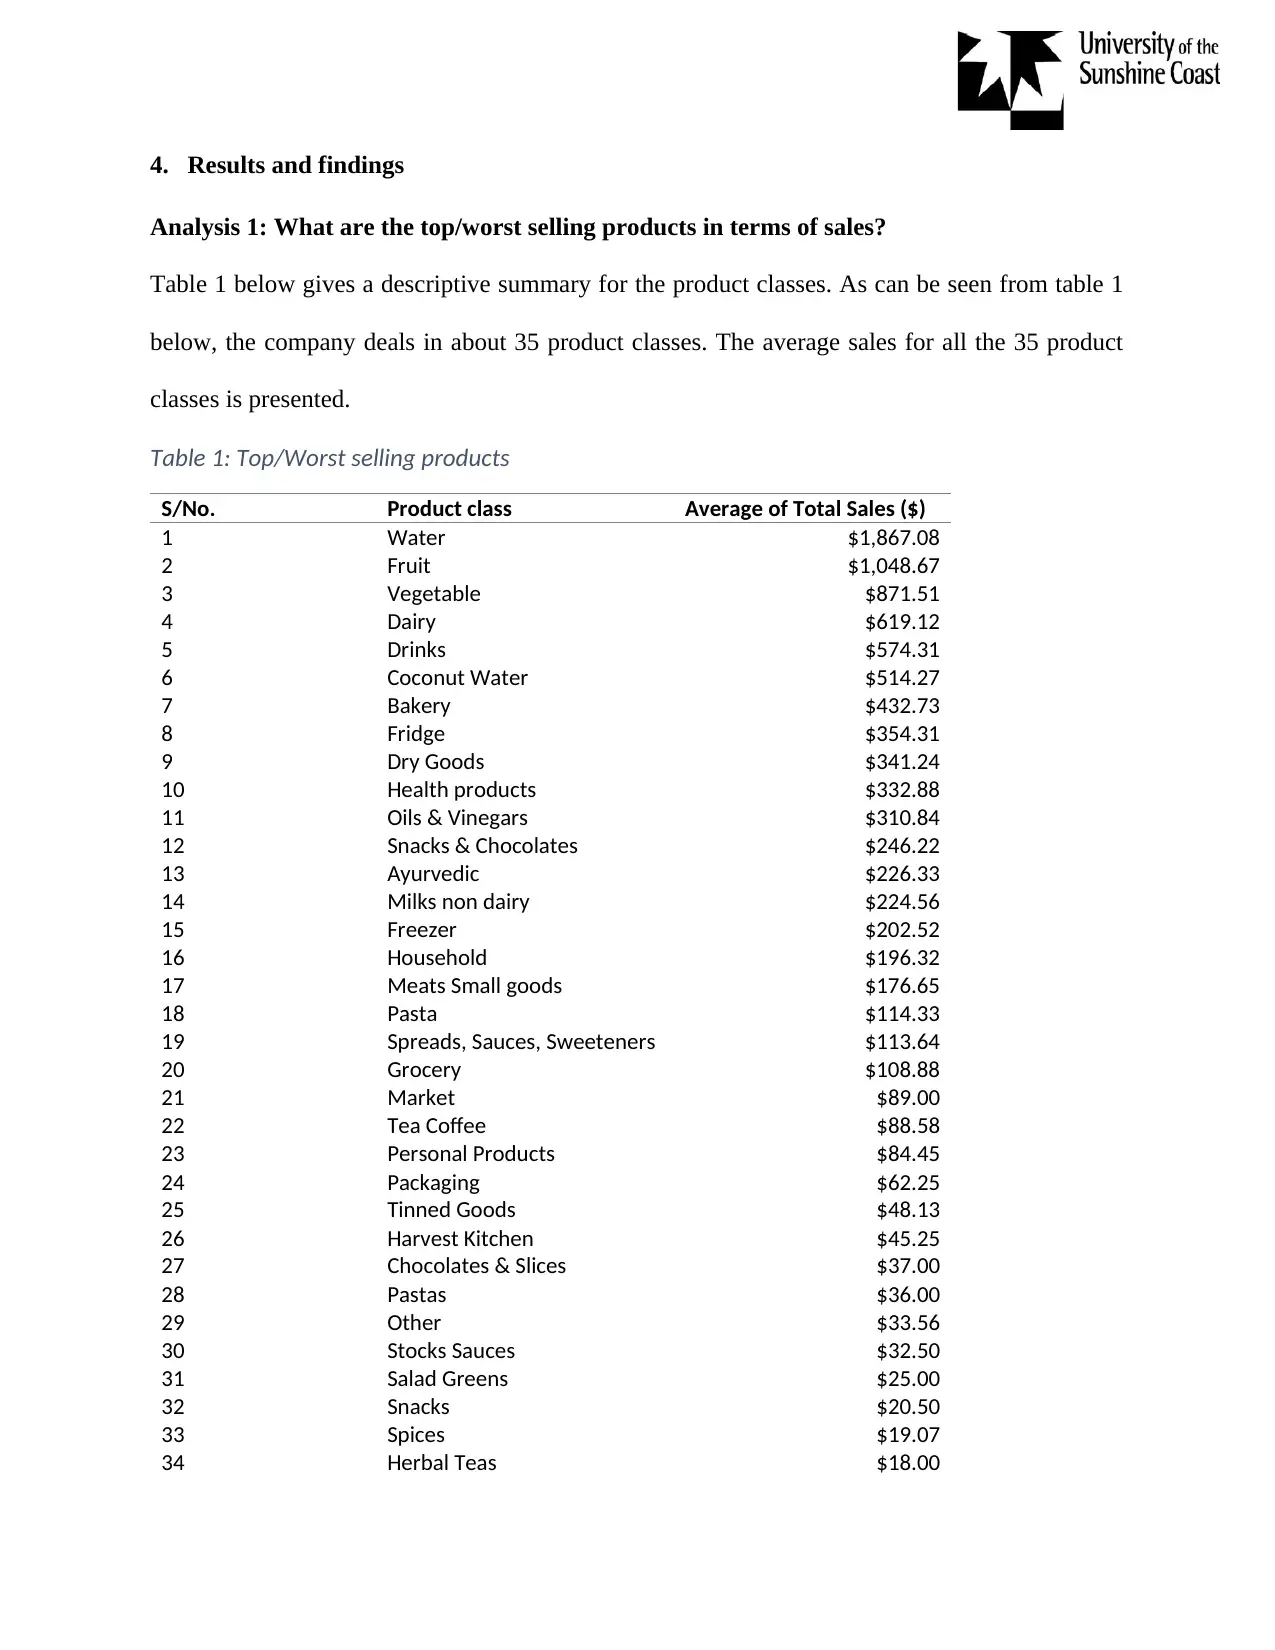
Analysis 1: What are the top/worst selling products in terms of sales?
Table 1 below gives a descriptive summary for the product classes. As can be seen from table 1
below, the company deals in about 35 product classes. The average sales for all the 35 product
classes is presented.
Table 1: Top/Worst selling products
S/No. Product class Average of Total Sales ($)
1 Water $1,867.08
2 Fruit $1,048.67
3 Vegetable $871.51
4 Dairy $619.12
5 Drinks $574.31
6 Coconut Water $514.27
7 Bakery $432.73
8 Fridge $354.31
9 Dry Goods $341.24
10 Health products $332.88
11 Oils & Vinegars $310.84
12 Snacks & Chocolates $246.22
13 Ayurvedic $226.33
14 Milks non dairy $224.56
15 Freezer $202.52
16 Household $196.32
17 Meats Small goods $176.65
18 Pasta $114.33
19 Spreads, Sauces, Sweeteners $113.64
20 Grocery $108.88
21 Market $89.00
22 Tea Coffee $88.58
23 Personal Products $84.45
24 Packaging $62.25
25 Tinned Goods $48.13
26 Harvest Kitchen $45.25
27 Chocolates & Slices $37.00
28 Pastas $36.00
29 Other $33.56
30 Stocks Sauces $32.50
31 Salad Greens $25.00
32 Snacks $20.50
33 Spices $19.07
34 Herbal Teas $18.00
⊘ This is a preview!⊘
Do you want full access?
Subscribe today to unlock all pages.
Trusted by 1+ million students worldwide
35 Juicing $5.00
Grand Total $370.02
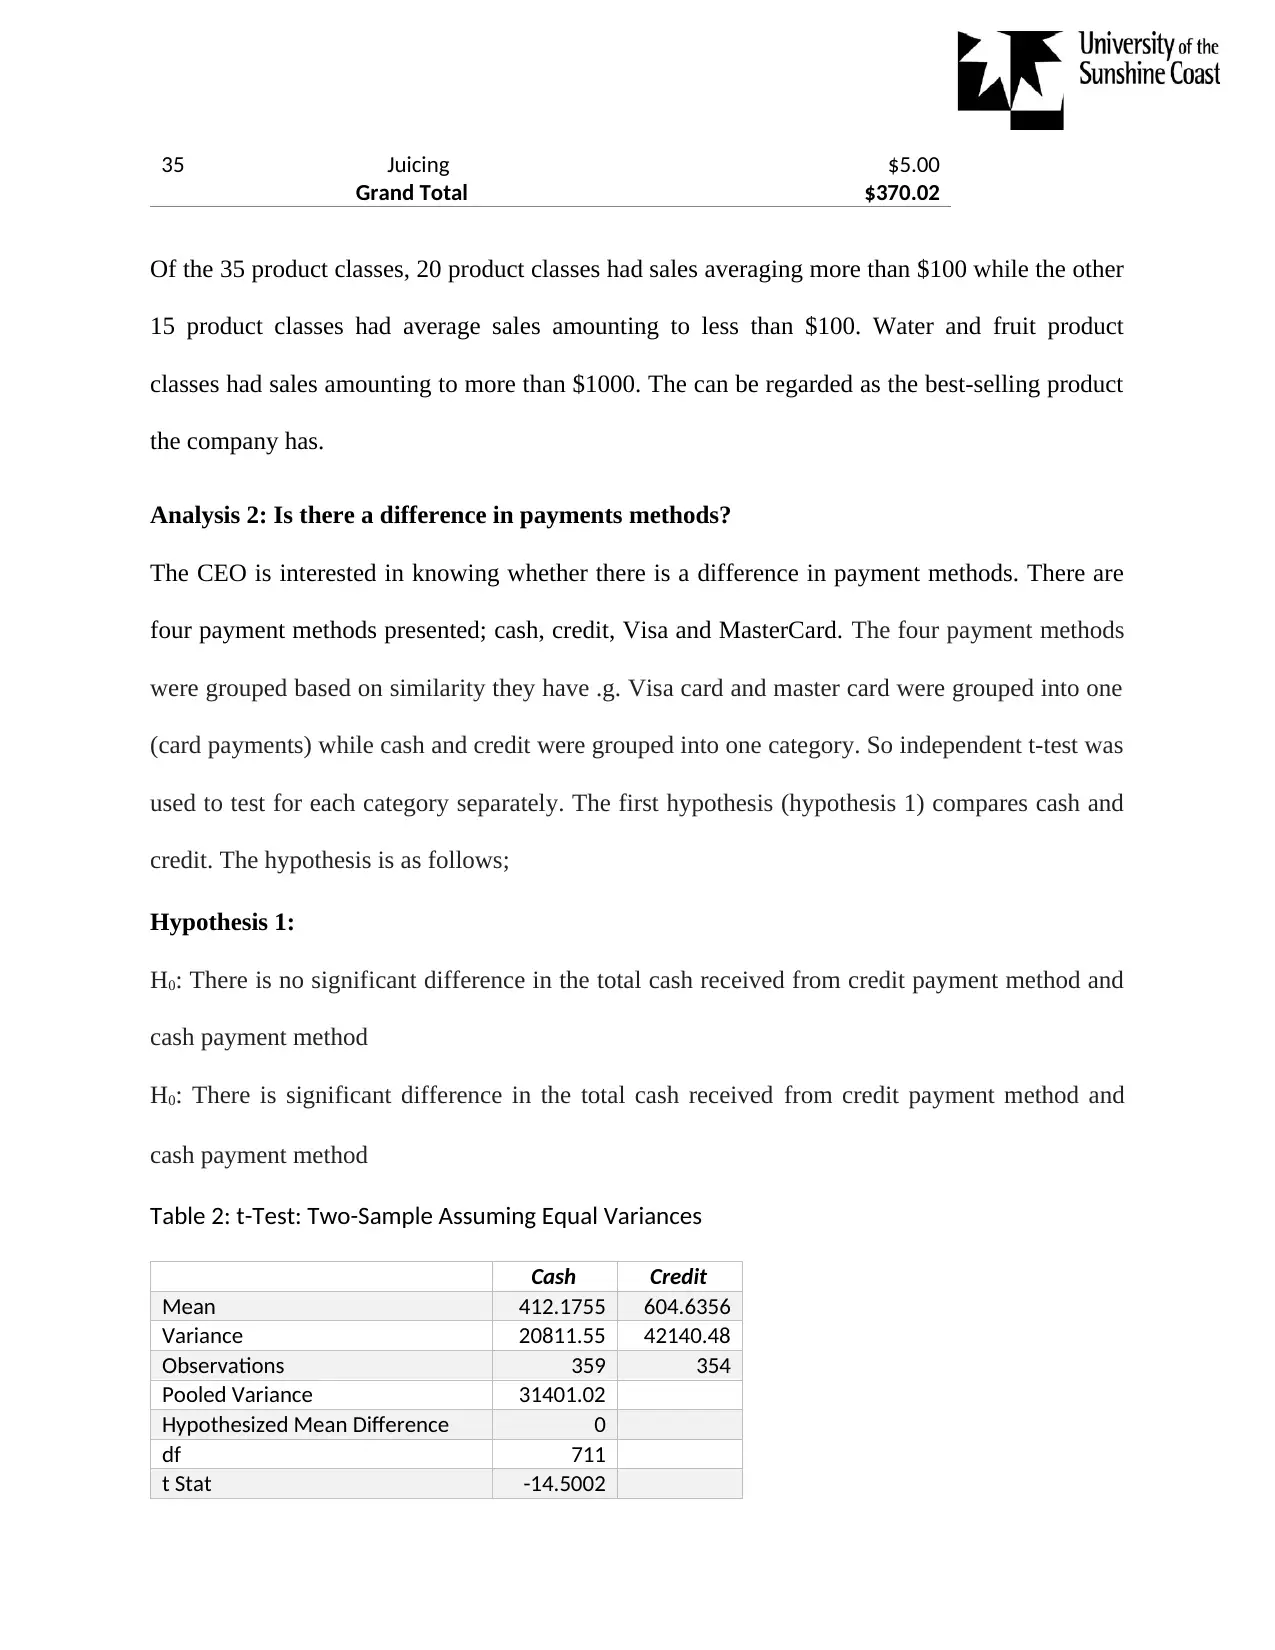
Of the 35 product classes, 20 product classes had sales averaging more than $100 while the other
15 product classes had average sales amounting to less than $100. Water and fruit product
classes had sales amounting to more than $1000. The can be regarded as the best-selling product
the company has.
Analysis 2: Is there a difference in payments methods?
The CEO is interested in knowing whether there is a difference in payment methods. There are
four payment methods presented; cash, credit, Visa and MasterCard. The four payment methods
were grouped based on similarity they have .g. Visa card and master card were grouped into one
(card payments) while cash and credit were grouped into one category. So independent t-test was
used to test for each category separately. The first hypothesis (hypothesis 1) compares cash and
credit. The hypothesis is as follows;
Hypothesis 1:
H0: There is no significant difference in the total cash received from credit payment method and
cash payment method
H0: There is significant difference in the total cash received from credit payment method and
cash payment method
Table 2: t-Test: Two-Sample Assuming Equal Variances
Cash Credit
Mean 412.1755 604.6356
Variance 20811.55 42140.48
Observations 359 354
Pooled Variance 31401.02
Hypothesized Mean Difference 0
df 711
t Stat -14.5002
Grand Total $370.02
Of the 35 product classes, 20 product classes had sales averaging more than $100 while the other
15 product classes had average sales amounting to less than $100. Water and fruit product
classes had sales amounting to more than $1000. The can be regarded as the best-selling product
the company has.
Analysis 2: Is there a difference in payments methods?
The CEO is interested in knowing whether there is a difference in payment methods. There are
four payment methods presented; cash, credit, Visa and MasterCard. The four payment methods
were grouped based on similarity they have .g. Visa card and master card were grouped into one
(card payments) while cash and credit were grouped into one category. So independent t-test was
used to test for each category separately. The first hypothesis (hypothesis 1) compares cash and
credit. The hypothesis is as follows;
Hypothesis 1:
H0: There is no significant difference in the total cash received from credit payment method and
cash payment method
H0: There is significant difference in the total cash received from credit payment method and
cash payment method
Table 2: t-Test: Two-Sample Assuming Equal Variances
Cash Credit
Mean 412.1755 604.6356
Variance 20811.55 42140.48
Observations 359 354
Pooled Variance 31401.02
Hypothesized Mean Difference 0
df 711
t Stat -14.5002
Paraphrase This Document
Need a fresh take? Get an instant paraphrase of this document with our AI Paraphraser
P(T<=t) one-tail 0.000
t Critical one-tail 1.647
P(T<=t) two-tail 0.000
t Critical two-tail 1.963306
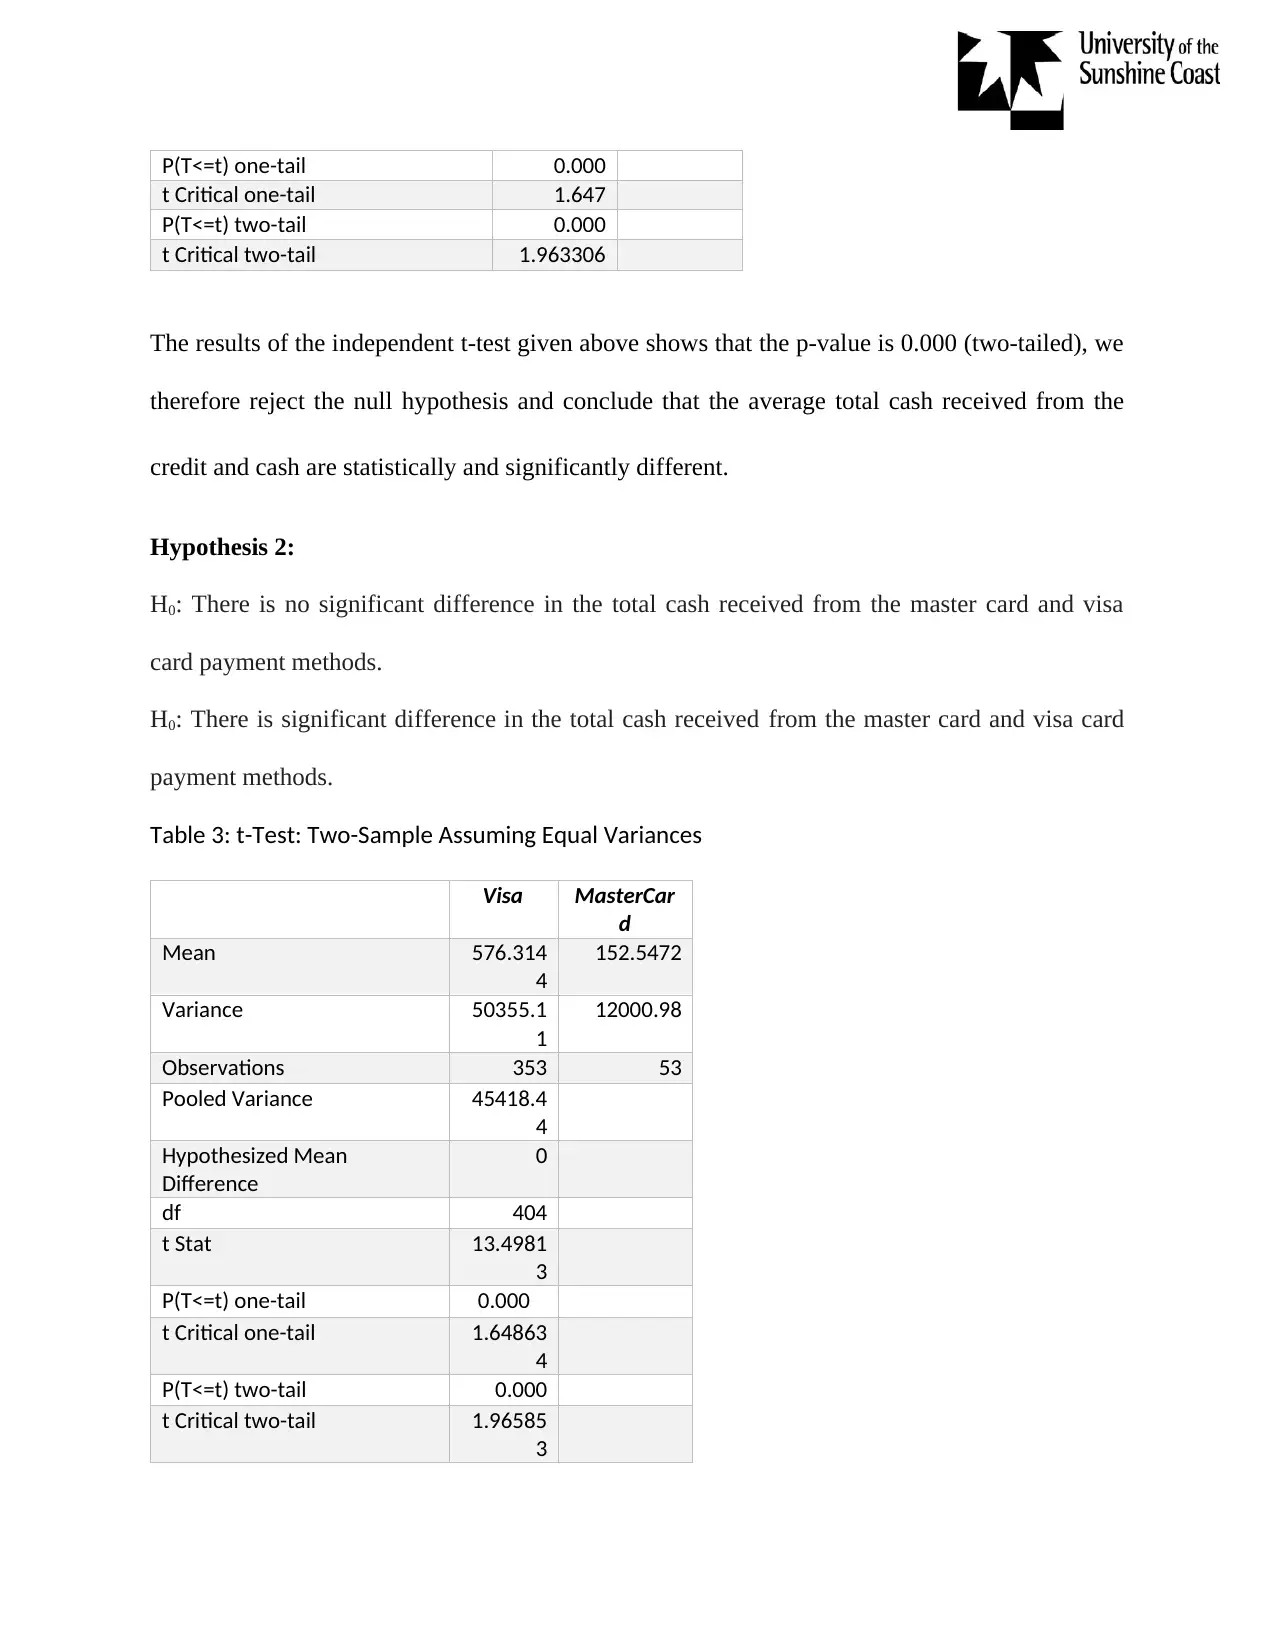
The results of the independent t-test given above shows that the p-value is 0.000 (two-tailed), we
therefore reject the null hypothesis and conclude that the average total cash received from the
credit and cash are statistically and significantly different.
Hypothesis 2:
H0: There is no significant difference in the total cash received from the master card and visa
card payment methods.
H0: There is significant difference in the total cash received from the master card and visa card
payment methods.
Table 3: t-Test: Two-Sample Assuming Equal Variances
Visa MasterCar
d
Mean 576.314
4
152.5472
Variance 50355.1
1
12000.98
Observations 353 53
Pooled Variance 45418.4
4
Hypothesized Mean
Difference
0
df 404
t Stat 13.4981
3
P(T<=t) one-tail 0.000
t Critical one-tail 1.64863
4
P(T<=t) two-tail 0.000
t Critical two-tail 1.96585
3
t Critical one-tail 1.647
P(T<=t) two-tail 0.000
t Critical two-tail 1.963306
The results of the independent t-test given above shows that the p-value is 0.000 (two-tailed), we
therefore reject the null hypothesis and conclude that the average total cash received from the
credit and cash are statistically and significantly different.
Hypothesis 2:
H0: There is no significant difference in the total cash received from the master card and visa
card payment methods.
H0: There is significant difference in the total cash received from the master card and visa card
payment methods.
Table 3: t-Test: Two-Sample Assuming Equal Variances
Visa MasterCar
d
Mean 576.314
4
152.5472
Variance 50355.1
1
12000.98
Observations 353 53
Pooled Variance 45418.4
4
Hypothesized Mean
Difference
0
df 404
t Stat 13.4981
3
P(T<=t) one-tail 0.000
t Critical one-tail 1.64863
4
P(T<=t) two-tail 0.000
t Critical two-tail 1.96585
3
The results of the independent t-test given above shows that the p-value is 0.000 (two-tailed), we
therefore reject the null hypothesis and conclude that the average total cash received from the
master card and visa card payment methods are statistically and significantly different.
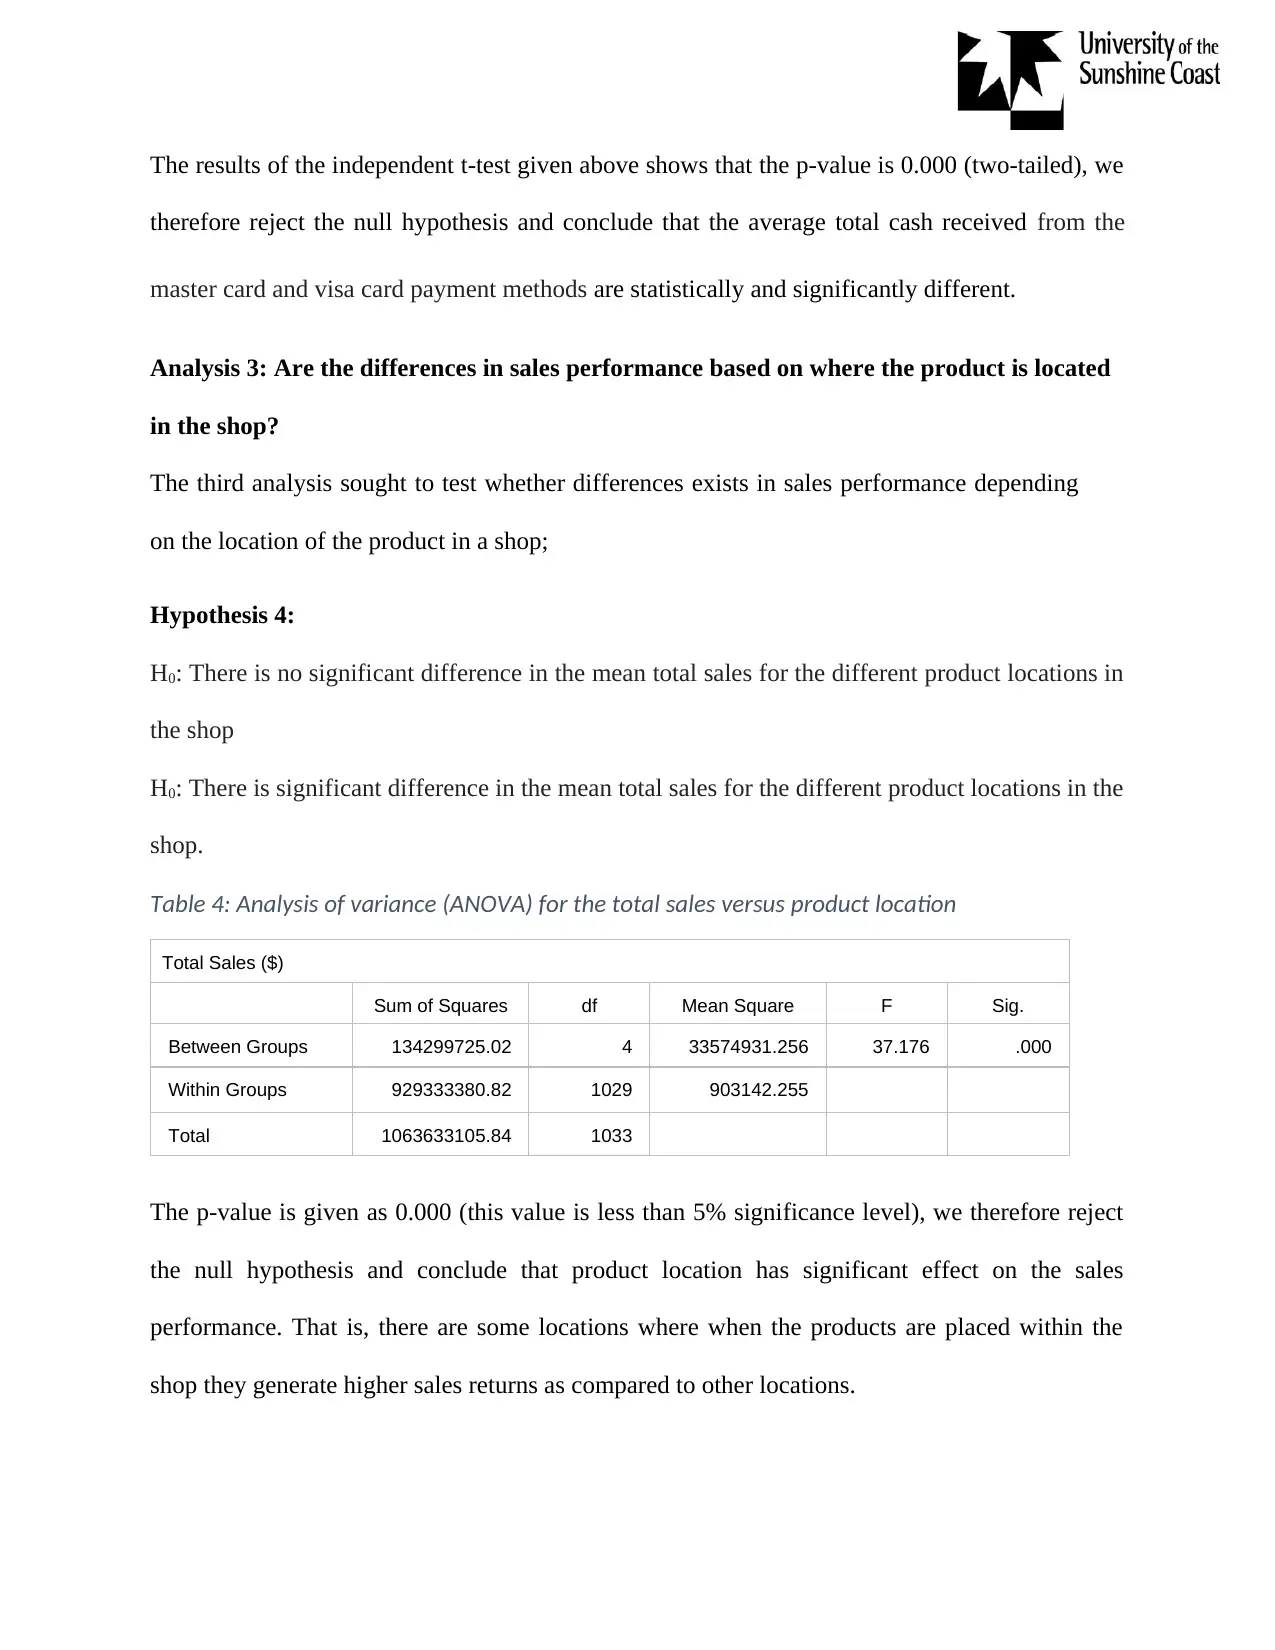
Analysis 3: Are the differences in sales performance based on where the product is located
in the shop?
The third analysis sought to test whether differences exists in sales performance depending
on the location of the product in a shop;
Hypothesis 4:
H0: There is no significant difference in the mean total sales for the different product locations in
the shop
H0: There is significant difference in the mean total sales for the different product locations in the
shop.
Table 4: Analysis of variance (ANOVA) for the total sales versus product location
Total Sales ($)
Sum of Squares df Mean Square F Sig.
Between Groups 134299725.02 4 33574931.256 37.176 .000
Within Groups 929333380.82 1029 903142.255
Total 1063633105.84 1033
The p-value is given as 0.000 (this value is less than 5% significance level), we therefore reject
the null hypothesis and conclude that product location has significant effect on the sales
performance. That is, there are some locations where when the products are placed within the
shop they generate higher sales returns as compared to other locations.
therefore reject the null hypothesis and conclude that the average total cash received from the
master card and visa card payment methods are statistically and significantly different.
Analysis 3: Are the differences in sales performance based on where the product is located
in the shop?
The third analysis sought to test whether differences exists in sales performance depending
on the location of the product in a shop;
Hypothesis 4:
H0: There is no significant difference in the mean total sales for the different product locations in
the shop
H0: There is significant difference in the mean total sales for the different product locations in the
shop.
Table 4: Analysis of variance (ANOVA) for the total sales versus product location
Total Sales ($)
Sum of Squares df Mean Square F Sig.
Between Groups 134299725.02 4 33574931.256 37.176 .000
Within Groups 929333380.82 1029 903142.255
Total 1063633105.84 1033
The p-value is given as 0.000 (this value is less than 5% significance level), we therefore reject
the null hypothesis and conclude that product location has significant effect on the sales
performance. That is, there are some locations where when the products are placed within the
shop they generate higher sales returns as compared to other locations.
⊘ This is a preview!⊘
Do you want full access?
Subscribe today to unlock all pages.
Trusted by 1+ million students worldwide
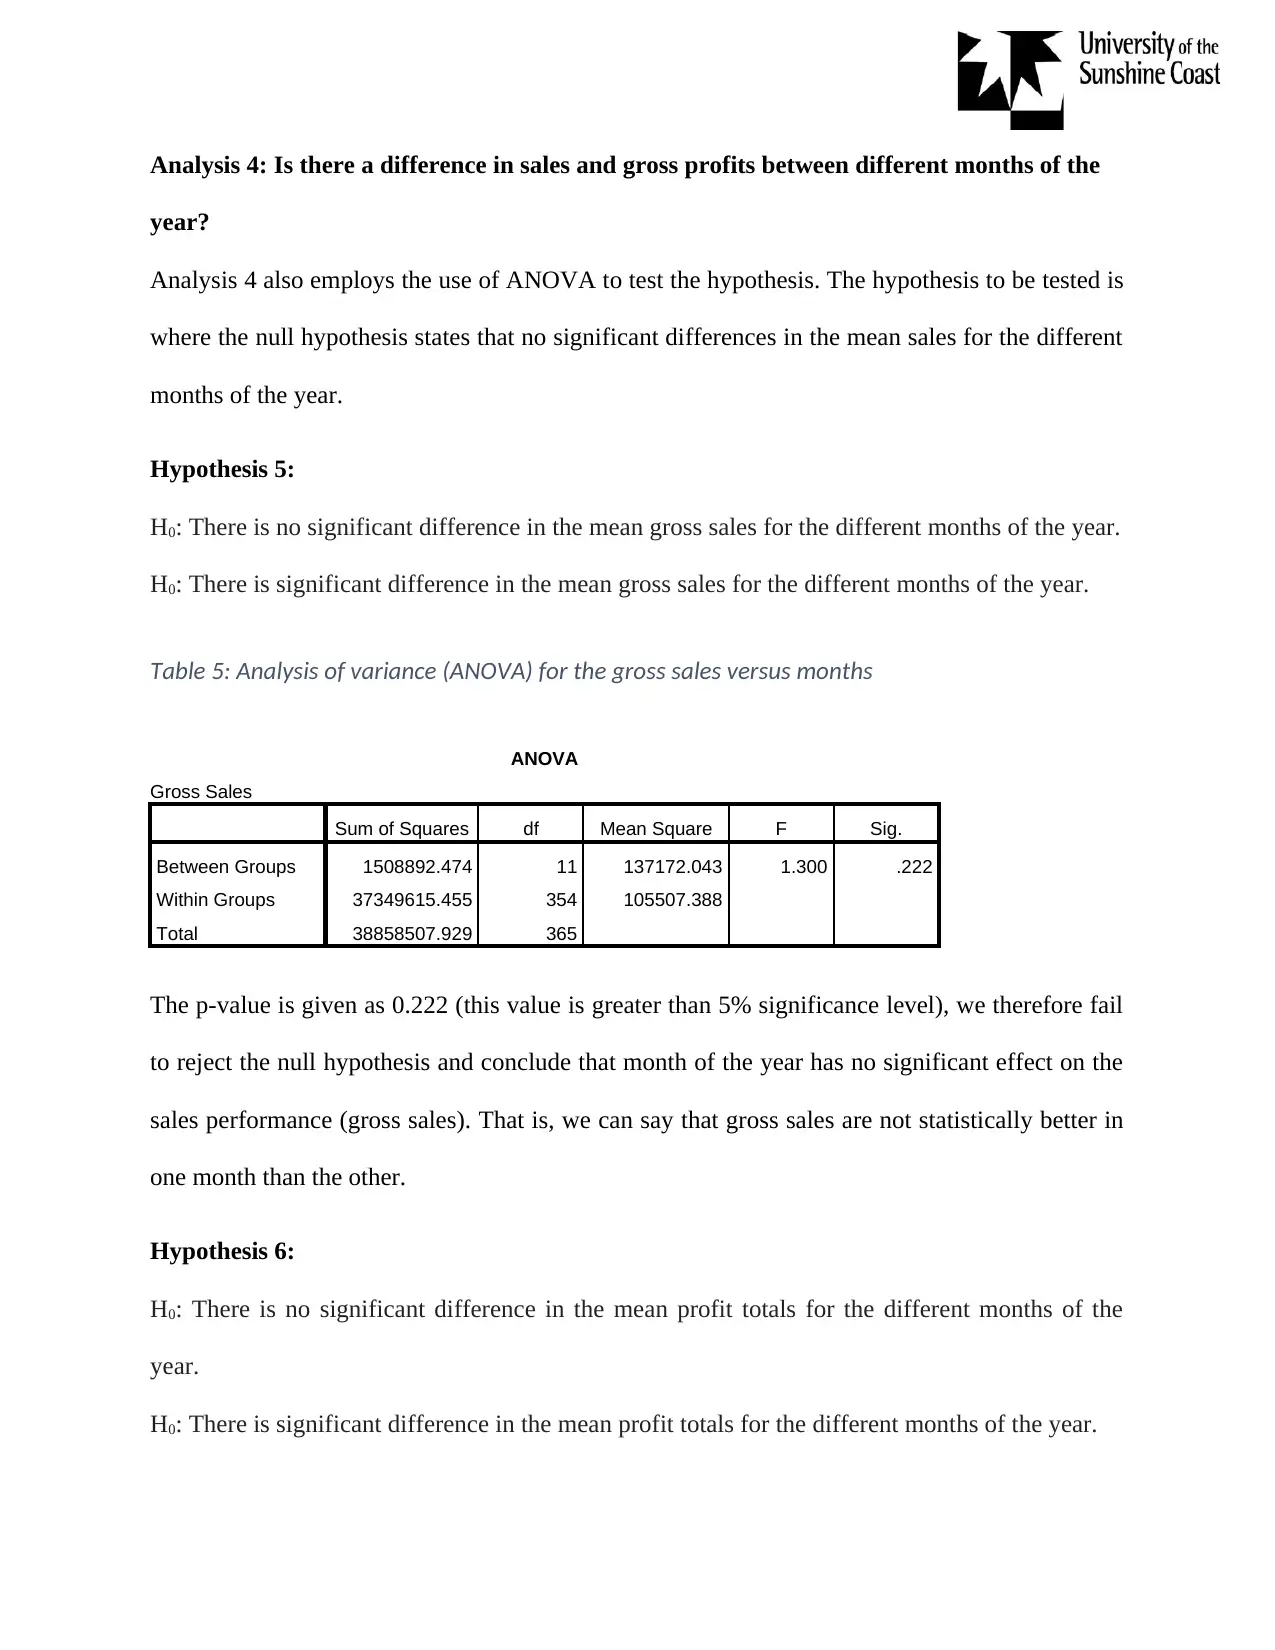
Analysis 4: Is there a difference in sales and gross profits between different months of the
year?
Analysis 4 also employs the use of ANOVA to test the hypothesis. The hypothesis to be tested is
where the null hypothesis states that no significant differences in the mean sales for the different
months of the year.
Hypothesis 5:
H0: There is no significant difference in the mean gross sales for the different months of the year.
H0: There is significant difference in the mean gross sales for the different months of the year.
Table 5: Analysis of variance (ANOVA) for the gross sales versus months
ANOVA
Gross Sales
Sum of Squares df Mean Square F Sig.
Between Groups 1508892.474 11 137172.043 1.300 .222
Within Groups 37349615.455 354 105507.388
Total 38858507.929 365
The p-value is given as 0.222 (this value is greater than 5% significance level), we therefore fail
to reject the null hypothesis and conclude that month of the year has no significant effect on the
sales performance (gross sales). That is, we can say that gross sales are not statistically better in
one month than the other.
Hypothesis 6:
H0: There is no significant difference in the mean profit totals for the different months of the
year.
H0: There is significant difference in the mean profit totals for the different months of the year.
Paraphrase This Document
Need a fresh take? Get an instant paraphrase of this document with our AI Paraphraser
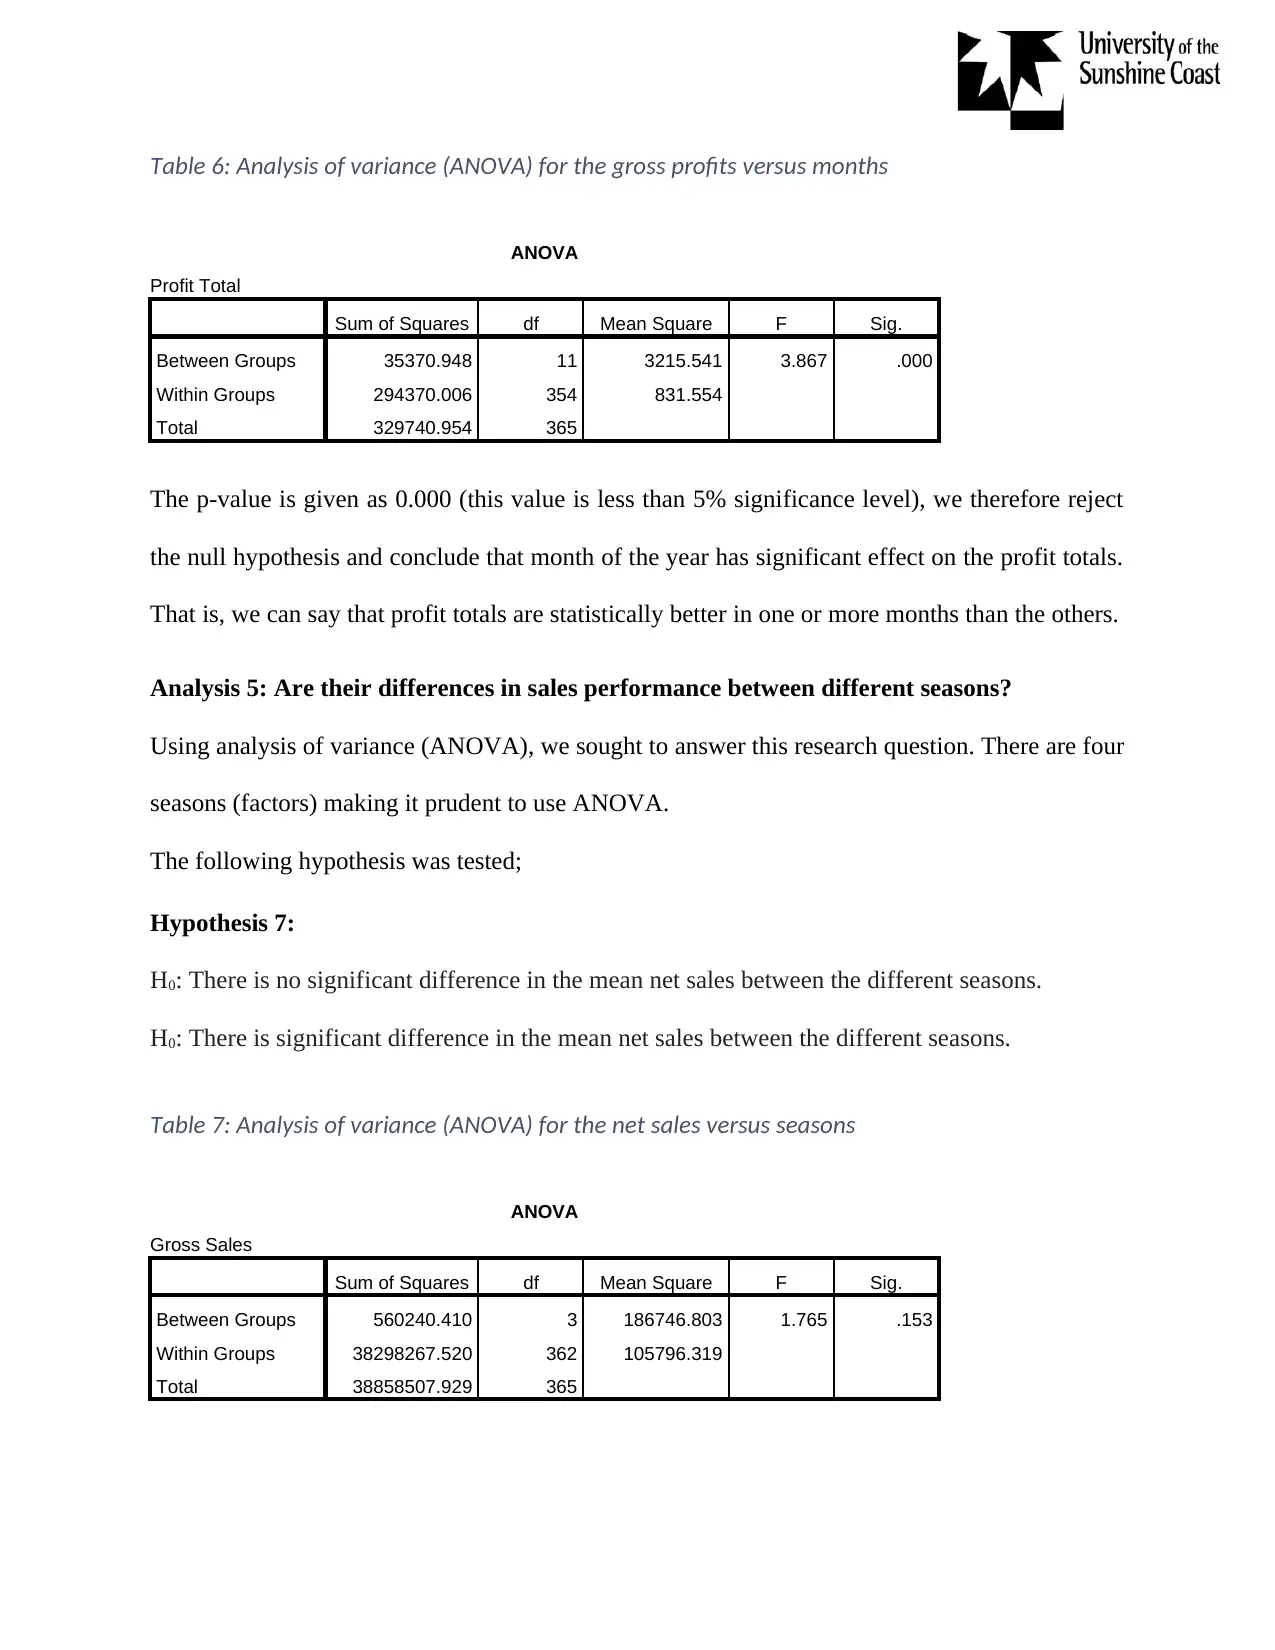
Table 6: Analysis of variance (ANOVA) for the gross profits versus months
ANOVA
Profit Total
Sum of Squares df Mean Square F Sig.
Between Groups 35370.948 11 3215.541 3.867 .000
Within Groups 294370.006 354 831.554
Total 329740.954 365
The p-value is given as 0.000 (this value is less than 5% significance level), we therefore reject
the null hypothesis and conclude that month of the year has significant effect on the profit totals.
That is, we can say that profit totals are statistically better in one or more months than the others.
Analysis 5: Are their differences in sales performance between different seasons?
Using analysis of variance (ANOVA), we sought to answer this research question. There are four
seasons (factors) making it prudent to use ANOVA.
The following hypothesis was tested;
Hypothesis 7:
H0: There is no significant difference in the mean net sales between the different seasons.
H0: There is significant difference in the mean net sales between the different seasons.
Table 7: Analysis of variance (ANOVA) for the net sales versus seasons
ANOVA
Gross Sales
Sum of Squares df Mean Square F Sig.
Between Groups 560240.410 3 186746.803 1.765 .153
Within Groups 38298267.520 362 105796.319
Total 38858507.929 365
ANOVA
Profit Total
Sum of Squares df Mean Square F Sig.
Between Groups 35370.948 11 3215.541 3.867 .000
Within Groups 294370.006 354 831.554
Total 329740.954 365
The p-value is given as 0.000 (this value is less than 5% significance level), we therefore reject
the null hypothesis and conclude that month of the year has significant effect on the profit totals.
That is, we can say that profit totals are statistically better in one or more months than the others.
Analysis 5: Are their differences in sales performance between different seasons?
Using analysis of variance (ANOVA), we sought to answer this research question. There are four
seasons (factors) making it prudent to use ANOVA.
The following hypothesis was tested;
Hypothesis 7:
H0: There is no significant difference in the mean net sales between the different seasons.
H0: There is significant difference in the mean net sales between the different seasons.
Table 7: Analysis of variance (ANOVA) for the net sales versus seasons
ANOVA
Gross Sales
Sum of Squares df Mean Square F Sig.
Between Groups 560240.410 3 186746.803 1.765 .153
Within Groups 38298267.520 362 105796.319
Total 38858507.929 365
The p-value is given as 0.153 (this value is greater than 5% significance level), we therefore fail
to reject the null hypothesis and conclude that season has no significant effect on the sales
performance (gross sales). That is, we can say that gross sales are not statistically better in one
season than the others.
5. Discussion of the results and recommendations
The aim of this study was to analyze the company’s (Good Harvest) data and understand how the
company is performing in terms of sales and profits. A number of analysis were done to better
understand how the organization is fairing on. For instance, we worked on understanding which
of the company’s products perform best and which one performs poorly in terms of the sales. It
came out that indeed there are some products which had a better edge in terms of the revenues
they generate as compared to others. Some of the products that were found to be doing well were
the drinks, coconut water, bakery, water and dairy products. The mentioned products had sales
amounting to more than $400. On the other hand, products such as salad greens, snacks, spices,
herbal teas and juicing generated revenues less than or equal to $25.
We also established that there are some factors that could affect the sales revenues. One such
factor was the location of the product in the shop. There are some locations that results to higher
revenues than the others. However, season or month of the year had no influence on sales
revenues but month had influence on profits generated.
Based on the above analysis it is important for the CEO to either scrap off the products that are
not bringing income to the company or may be look at innovative ways of increasing their sales
revenues. The company can also define its niche, that is, the company needs to know which
products it majorly focusses on-this will give it a competitive advantage over the others.
⊘ This is a preview!⊘
Do you want full access?
Subscribe today to unlock all pages.
Trusted by 1+ million students worldwide
1 out of 14
Related Documents


Your All-in-One AI-Powered Toolkit for Academic Success.
+13062052269
info@desklib.com
Available 24*7 on WhatsApp / Email
![[object Object]](/_next/static/media/star-bottom.7253800d.svg)
Unlock your academic potential
Copyright © 2020–2026 A2Z Services. All Rights Reserved. Developed and managed by ZUCOL.