Business Analytics & Wimpy Restaurant: A Performance Case Study

Verified

Added on  2023/06/12

|12
|1654
|453
Case Study
AI Summary
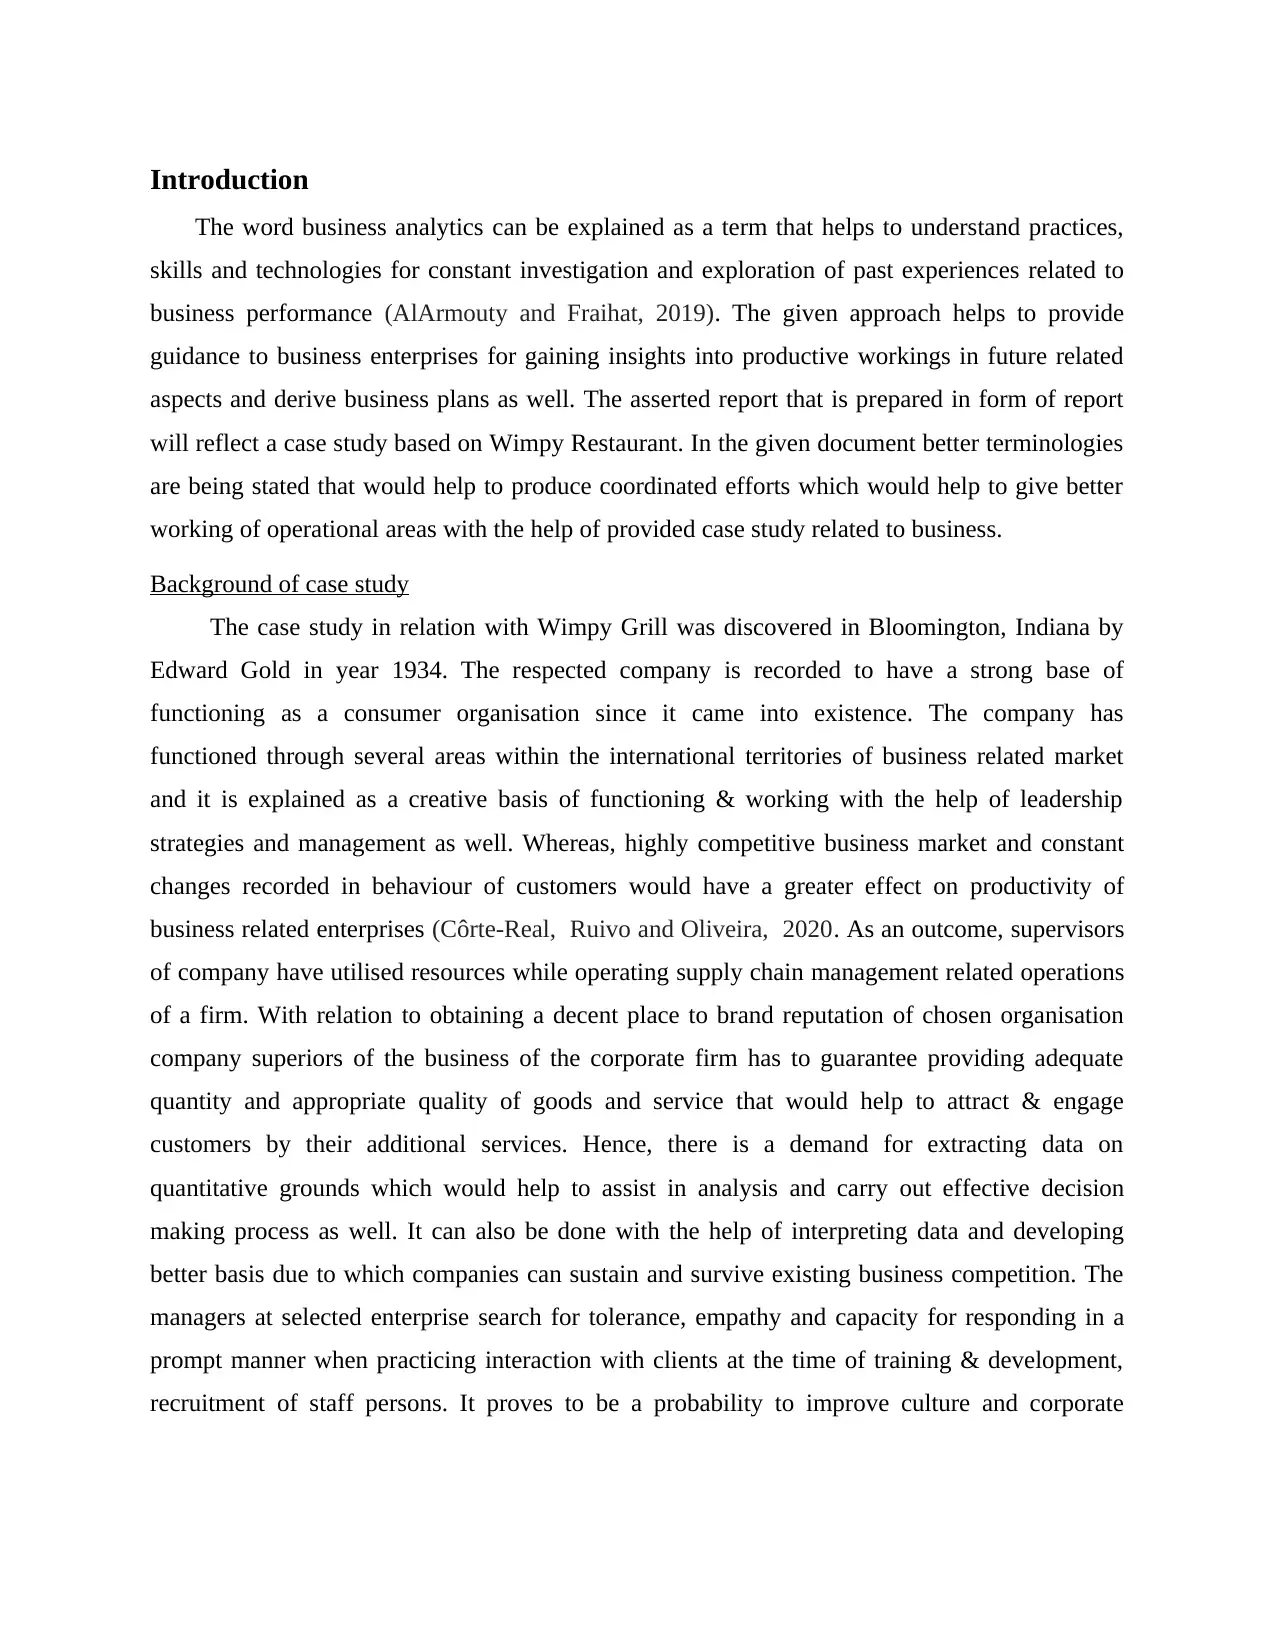
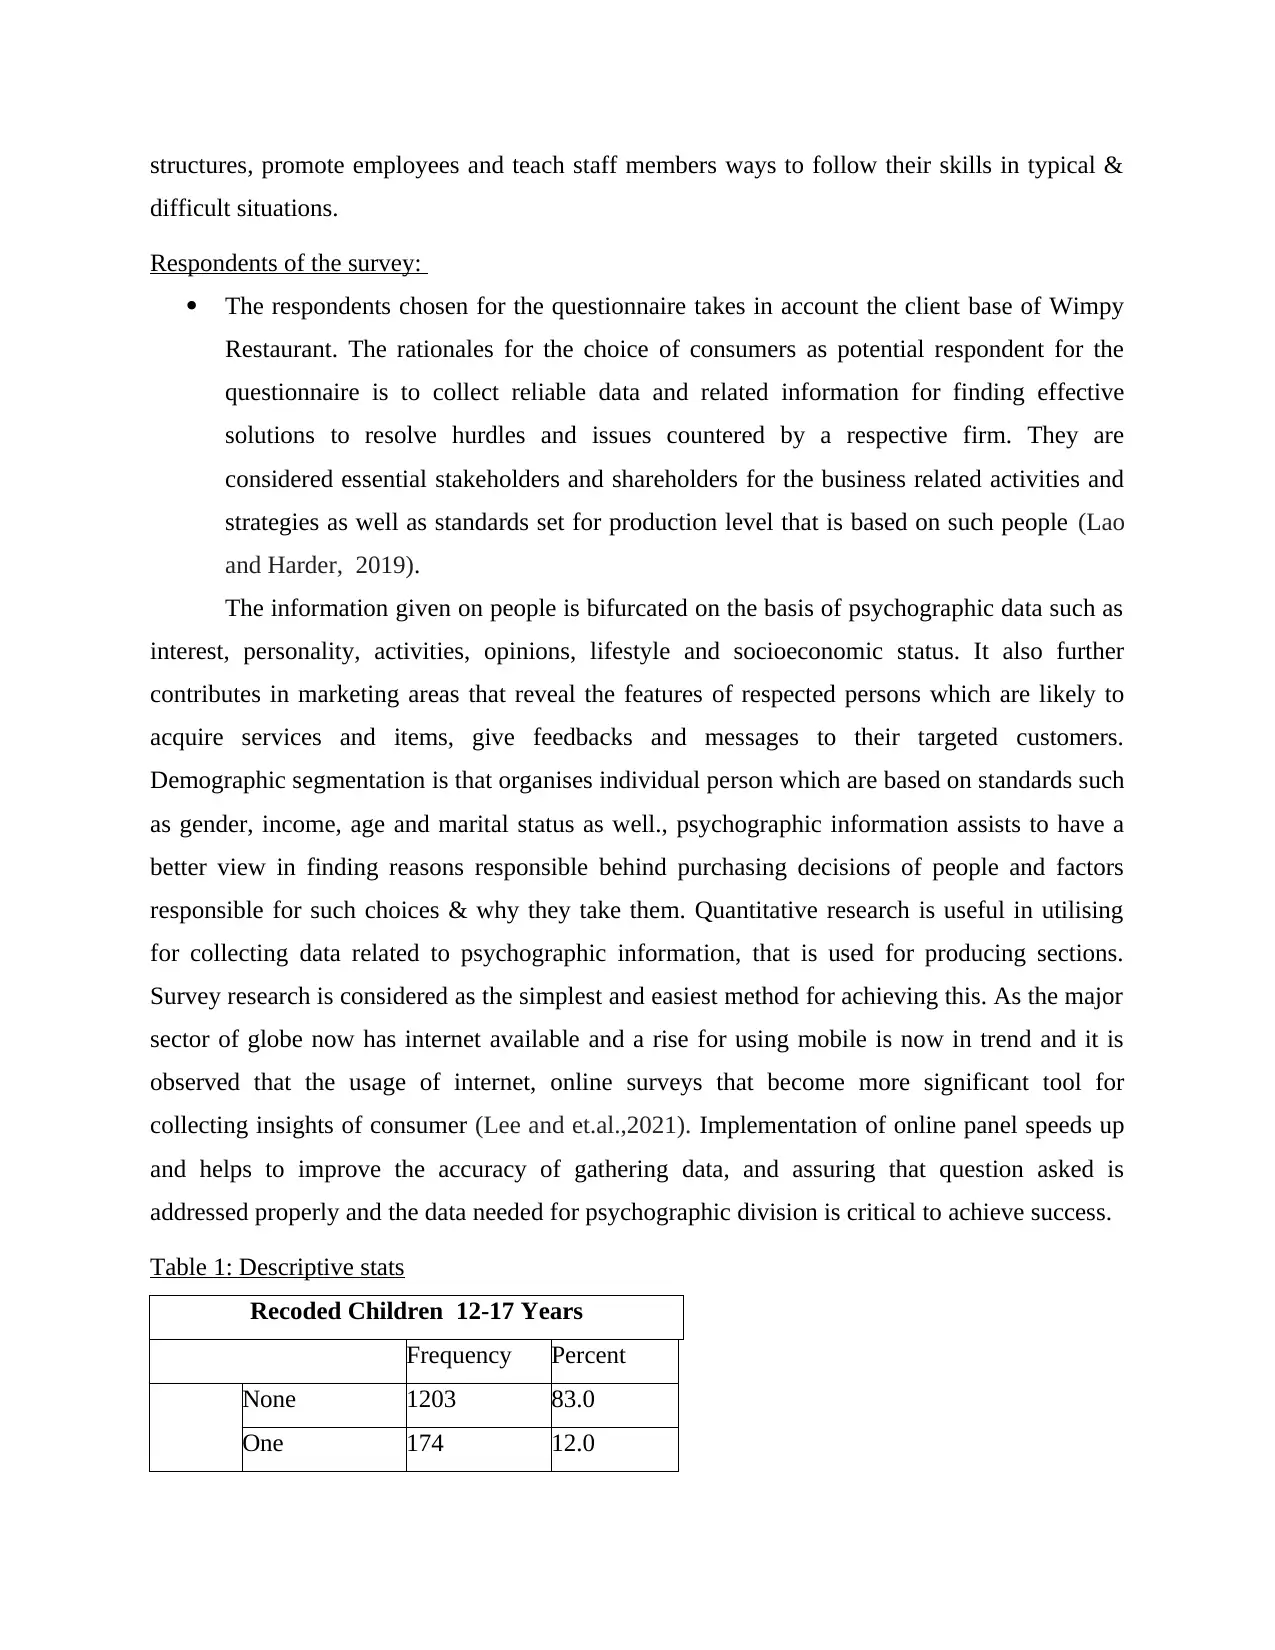
This case study report focuses on the application of business analytics to Wimpy Restaurant, tracing its history from its founding in 1934 to its current challenges in a competitive market. The analysis emphasizes the importance of data-driven decision-making, particularly in areas like supply chain management and customer engagement. It examines survey data collected from Wimpy Restaurant customers, segmenting them based on psychographic and demographic factors to better understand their preferences and behaviors. The report includes descriptive statistics on variables such as the presence of children, number of adults in the household, region, and education level. Ultimately, the study aims to provide actionable recommendations for Wimpy Restaurant to improve its operational efficiency, customer satisfaction, and overall business performance, highlighting the role of analytics in achieving these goals. Desklib provides access to similar case studies and study resources for students.
Document Page
Business Analytics
tabler-icon-diamond-filled.svg

Paraphrase This Document

Need a fresh take? Get an instant paraphrase of this document with our AI Paraphraser
Document Page
Introduction.................................................................................................................................................3
Background of case study........................................................................................................................3
Respondents of the survey:.....................................................................................................................4
Table 1: Descriptive stats.........................................................................................................................4
Regression Model..................................................................................................................................13
Recommendations.................................................................................................................................15
CONCLUSION.............................................................................................................................................16
REFERENCES..............................................................................................................................................17
Appendix...................................................................................................................................................18
Document Page
Introduction
The word business analytics can be explained as a term that helps to understand practices,
skills and technologies for constant investigation and exploration of past experiences related to
business performance (AlArmouty and Fraihat, 2019). The given approach helps to provide
guidance to business enterprises for gaining insights into productive workings in future related
aspects and derive business plans as well. The asserted report that is prepared in form of report
will reflect a case study based on Wimpy Restaurant. In the given document better terminologies
are being stated that would help to produce coordinated efforts which would help to give better
working of operational areas with the help of provided case study related to business.
Background of case study
The case study in relation with Wimpy Grill was discovered in Bloomington, Indiana by
Edward Gold in year 1934. The respected company is recorded to have a strong base of
functioning as a consumer organisation since it came into existence. The company has
functioned through several areas within the international territories of business related market
and it is explained as a creative basis of functioning & working with the help of leadership
strategies and management as well. Whereas, highly competitive business market and constant
changes recorded in behaviour of customers would have a greater effect on productivity of
business related enterprises (CĂ´rte-Real, Ruivo and Oliveira, 2020. As an outcome, supervisors
of company have utilised resources while operating supply chain management related operations
of a firm. With relation to obtaining a decent place to brand reputation of chosen organisation
company superiors of the business of the corporate firm has to guarantee providing adequate
quantity and appropriate quality of goods and service that would help to attract & engage
customers by their additional services. Hence, there is a demand for extracting data on
quantitative grounds which would help to assist in analysis and carry out effective decision
making process as well. It can also be done with the help of interpreting data and developing
better basis due to which companies can sustain and survive existing business competition. The
managers at selected enterprise search for tolerance, empathy and capacity for responding in a
prompt manner when practicing interaction with clients at the time of training & development,
recruitment of staff persons. It proves to be a probability to improve culture and corporate
Document Page
structures, promote employees and teach staff members ways to follow their skills in typical &
difficult situations.
Respondents of the survey:
ď‚· The respondents chosen for the questionnaire takes in account the client base of Wimpy
Restaurant. The rationales for the choice of consumers as potential respondent for the
questionnaire is to collect reliable data and related information for finding effective
solutions to resolve hurdles and issues countered by a respective firm. They are
considered essential stakeholders and shareholders for the business related activities and
strategies as well as standards set for production level that is based on such people (Lao
and Harder, 2019).
The information given on people is bifurcated on the basis of psychographic data such as
interest, personality, activities, opinions, lifestyle and socioeconomic status. It also further
contributes in marketing areas that reveal the features of respected persons which are likely to
acquire services and items, give feedbacks and messages to their targeted customers.
Demographic segmentation is that organises individual person which are based on standards such
as gender, income, age and marital status as well., psychographic information assists to have a
better view in finding reasons responsible behind purchasing decisions of people and factors
responsible for such choices & why they take them. Quantitative research is useful in utilising
for collecting data related to psychographic information, that is used for producing sections.
Survey research is considered as the simplest and easiest method for achieving this. As the major
sector of globe now has internet available and a rise for using mobile is now in trend and it is
observed that the usage of internet, online surveys that become more significant tool for
collecting insights of consumer (Lee and et.al.,2021). Implementation of online panel speeds up
and helps to improve the accuracy of gathering data, and assuring that question asked is
addressed properly and the data needed for psychographic division is critical to achieve success.
Table 1: Descriptive stats
Recoded Children 12-17 Years
Frequency Percent
None 1203 83.0
One 174 12.0
tabler-icon-diamond-filled.svg

Paraphrase This Document

Need a fresh take? Get an instant paraphrase of this document with our AI Paraphraser
Document Page
Two or More 73 5.0
Total 1450 100.0
From interpreting data collected above with the help of stats table prepared so far, it can
be concluded that there is a high occurrence number of 1203 in case of none recorded children at
the age of 12-17 years. There are 174 observant in the group that estimated to be verified as
children between the age of 12-17 age. Hence, it can be asserted that numerous results when
attained will be based on developing major emphasis on the group that is being recognised for
performing testing on results.
Table 2; Recoded Adults
Frequency Percent
One 307 21.2
Two 825 56.9
Three 202 13.9
Four or More 116 8.0
Total 1450 100.0
From the study of above prepared statistical table, it can be witnessed that variable two
was recorded of highest frequency for which adults were being conveyed through descriptive
evaluation. In the exploration better terms were being examined on the basis of which
synchronized actions can be taken into account when being associated with decision making
procedure of business related companies.
Table 3; Region
Frequency Percent
Northeast 325 22.4
Midwest 364 25.1
South 477 32.9
West 284 19.6
Total 1450 100.0
Document Page
From the above prepared table, it can be interpreted that operational test were being
achieved that helped to correlate towards binding of regional occurrences. Carried analysis
helped to carry out productive results that provided a guidance for better terminologies
considering south region reporting the highest count in the above prepared frequency table.
Table 4; Which of the following best represents the last level of education that you,
yourself, completed?
Frequency Percent
Some high school or less 24 1.7
Completed high school 208 14.3
Some college 589 40.6
Completed college 457 31.5
Post graduate 168 11.6
Total 1446 99.7
Missing Prefer not to answer 4 .3
Total 1450 100.0
From the above examination of above developed statistical table, it ca n be said that
highest count of respective person is recorded from similar college that presented last level of
education that has been completed. The asserted table provide guidance for developing better
terms of engagement with persons who have incorporated in for completing education terms in
high school or less which is observed to be one of the least count in above displayed quantitative
data table.
Document Page
tabler-icon-diamond-filled.svg

Paraphrase This Document

Need a fresh take? Get an instant paraphrase of this document with our AI Paraphraser
Document Page
REFERENCES
Books and Journals
AlArmouty, B. and Fraihat, S., 2019, October. Data analytics and business intelligence
framework for stock market trading. In 2019 2nd International Conference on new
Trends in Computing Sciences (ICTCS) (pp. 1-6). IEEE.
CĂ´rte-Real, N., Ruivo, P. and Oliveira, T., 2020. Leveraging internet of things and big data
analytics initiatives in European and American firms: Is data quality a way to extract
business value?. Information & Management. 57(1). p.103141.
Doddavaram, R. and Corlu, C.G., 2020, December. Teaching risk analytics using R. In 2020
Winter Simulation Conference (WSC) (pp. 3272-3281). IEEE.
Dzuranin, A.C., Jones, J.R. and Olvera, R.M., 2018. Infusing data analytics into the accounting
curriculum: A framework and insights from faculty. Journal of Accounting
Education. 43. pp.24-39.
Ferraris, A., and et.al.,2018. Big data analytics capabilities and knowledge management: impact
on firm performance. Management Decision.
Lao, L.J. and Harder, B.J., 2019. Gateway: a Geospatial Analytics System. The International
Archives of Photogrammetry, Remote Sensing and Spatial Information Sciences. 42.
pp.283-288.
Lee, G.M., and et.al.,2021. Mini-Track Introduction: Technology and Analytics in Emerging
Markets (TAEM). In Proceedings of the Annual Hawaii International Conference on
System Sciences (Vol. 2020, p. 1948).
Manko, B.A., 2021. Big data: The effect of analytics on marketing and business. Journal of
Information Technology Teaching Cases, p.20438869211057284.
Parks, R. and Cobb Payton, F., 2018. Designing a Healthcare Data Analytics Course: A
Contextual Active Learning Approach.
Paul, J.A. and MacDonald, L., 2020. Analytics curriculum for undergraduate and graduate
students. Decision Sciences Journal of Innovative Education, 18(1), pp.22-58.
Raut, R.D., and et.al., 2019. Linking big data analytics and operational sustainability practices
for sustainable business management. Journal of cleaner production, 224, pp.10-24.
Rialti, R., and et.al., 2019. Big data analytics capabilities and performance: Evidence from a
moderated multi-mediation model. Technological Forecasting and Social Change. 149.
p.119781.
Ukkola, K., 2018. Analytics and its requirements for data governance-an empirical research
Document Page
Appendix
Document Page
tabler-icon-diamond-filled.svg

Paraphrase This Document

Need a fresh take? Get an instant paraphrase of this document with our AI Paraphraser
Document Page
Document Page
chevron_up_icon
1 out of 12
circle_padding
hide_on_mobile
zoom_out_icon
[object Object]