Business Analytics Assignment - Decision Making and Analysis
VerifiedAdded on 2023/01/18
|17
|1844
|77
Homework Assignment
AI Summary
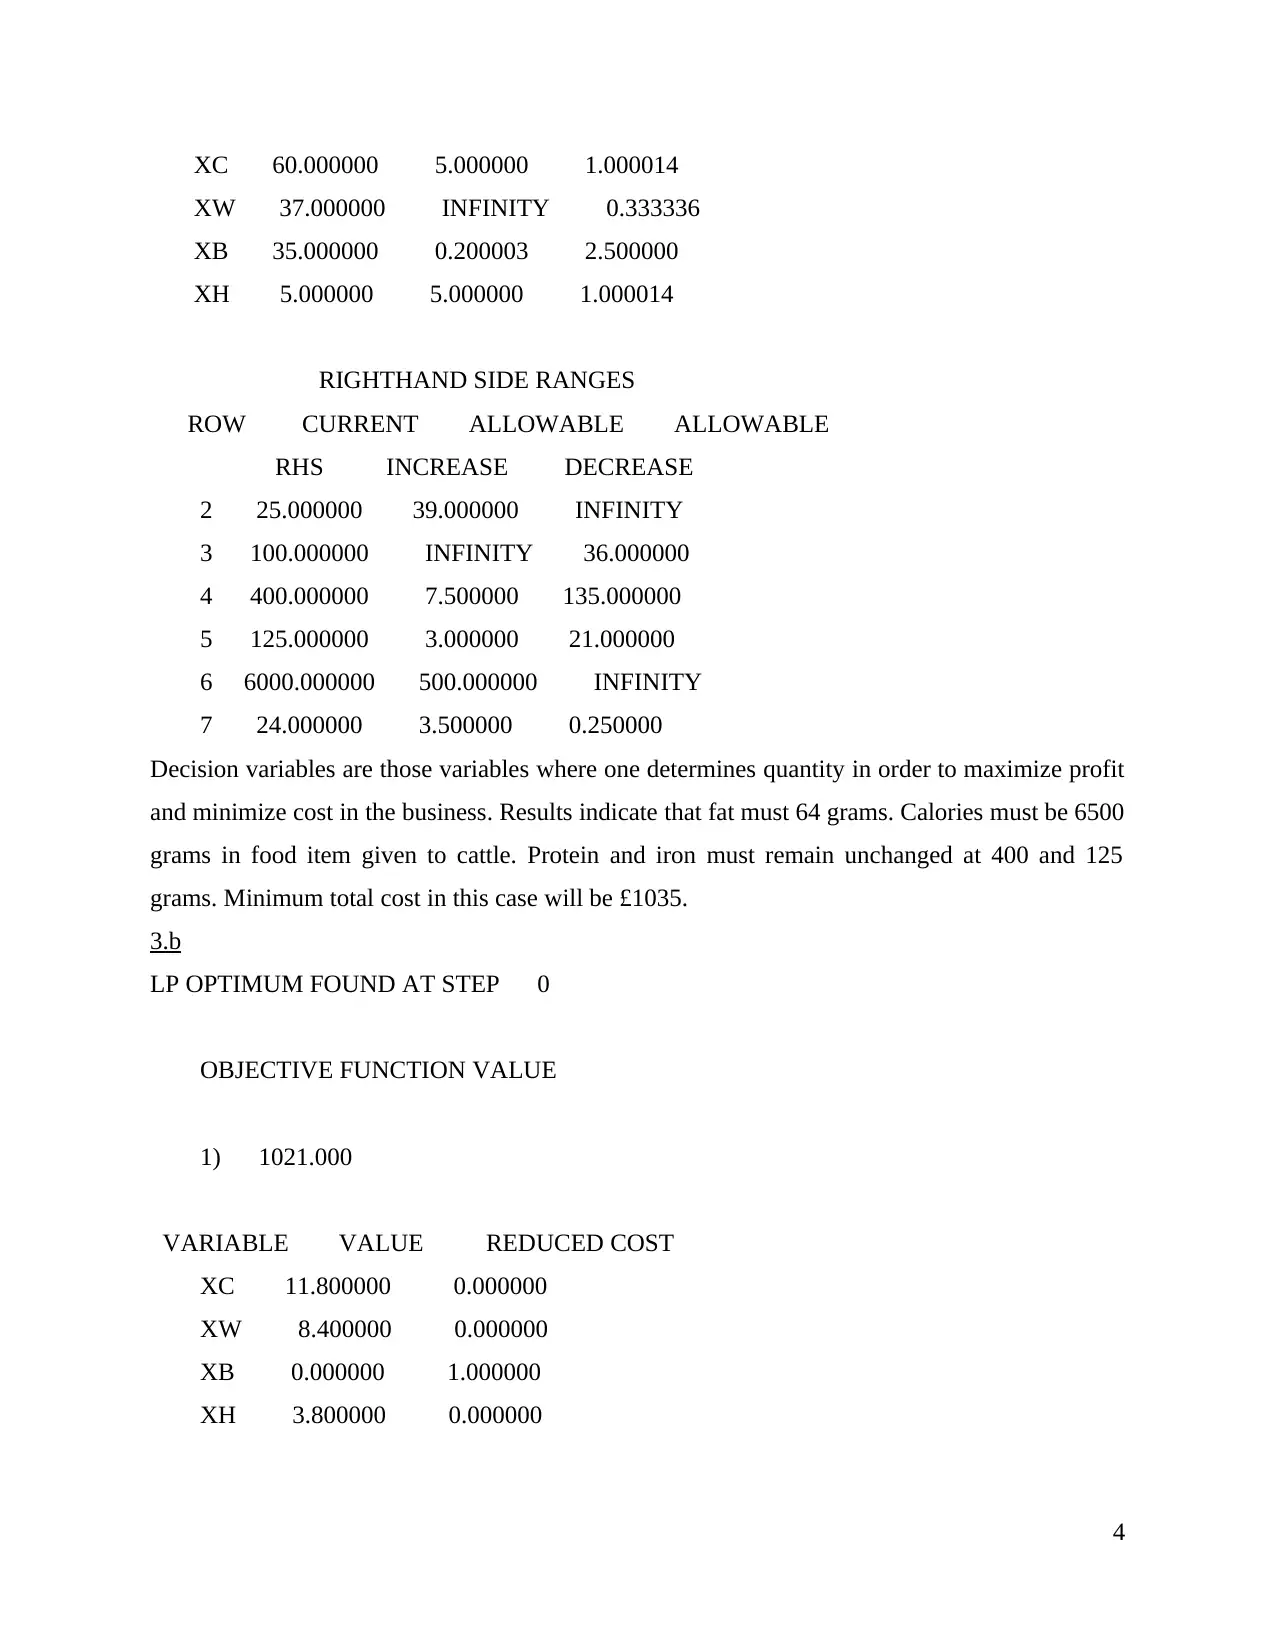
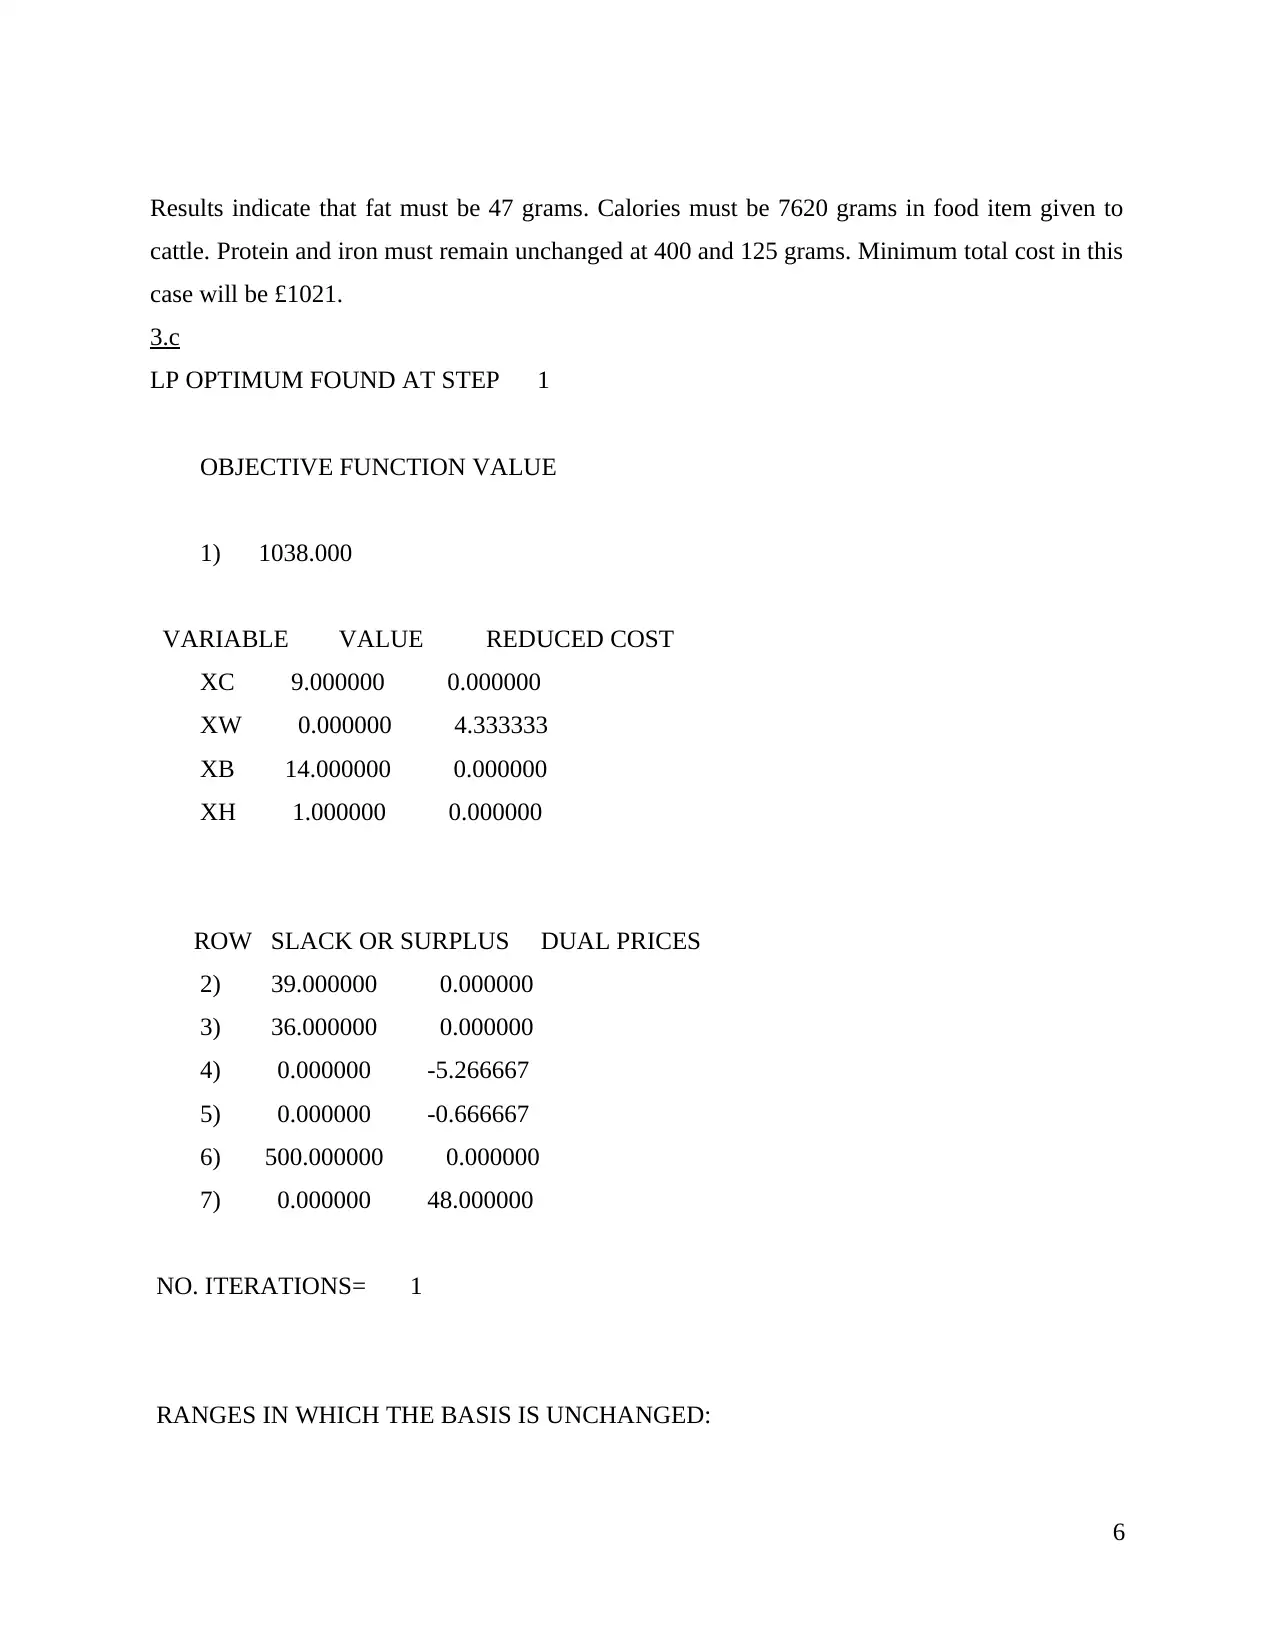
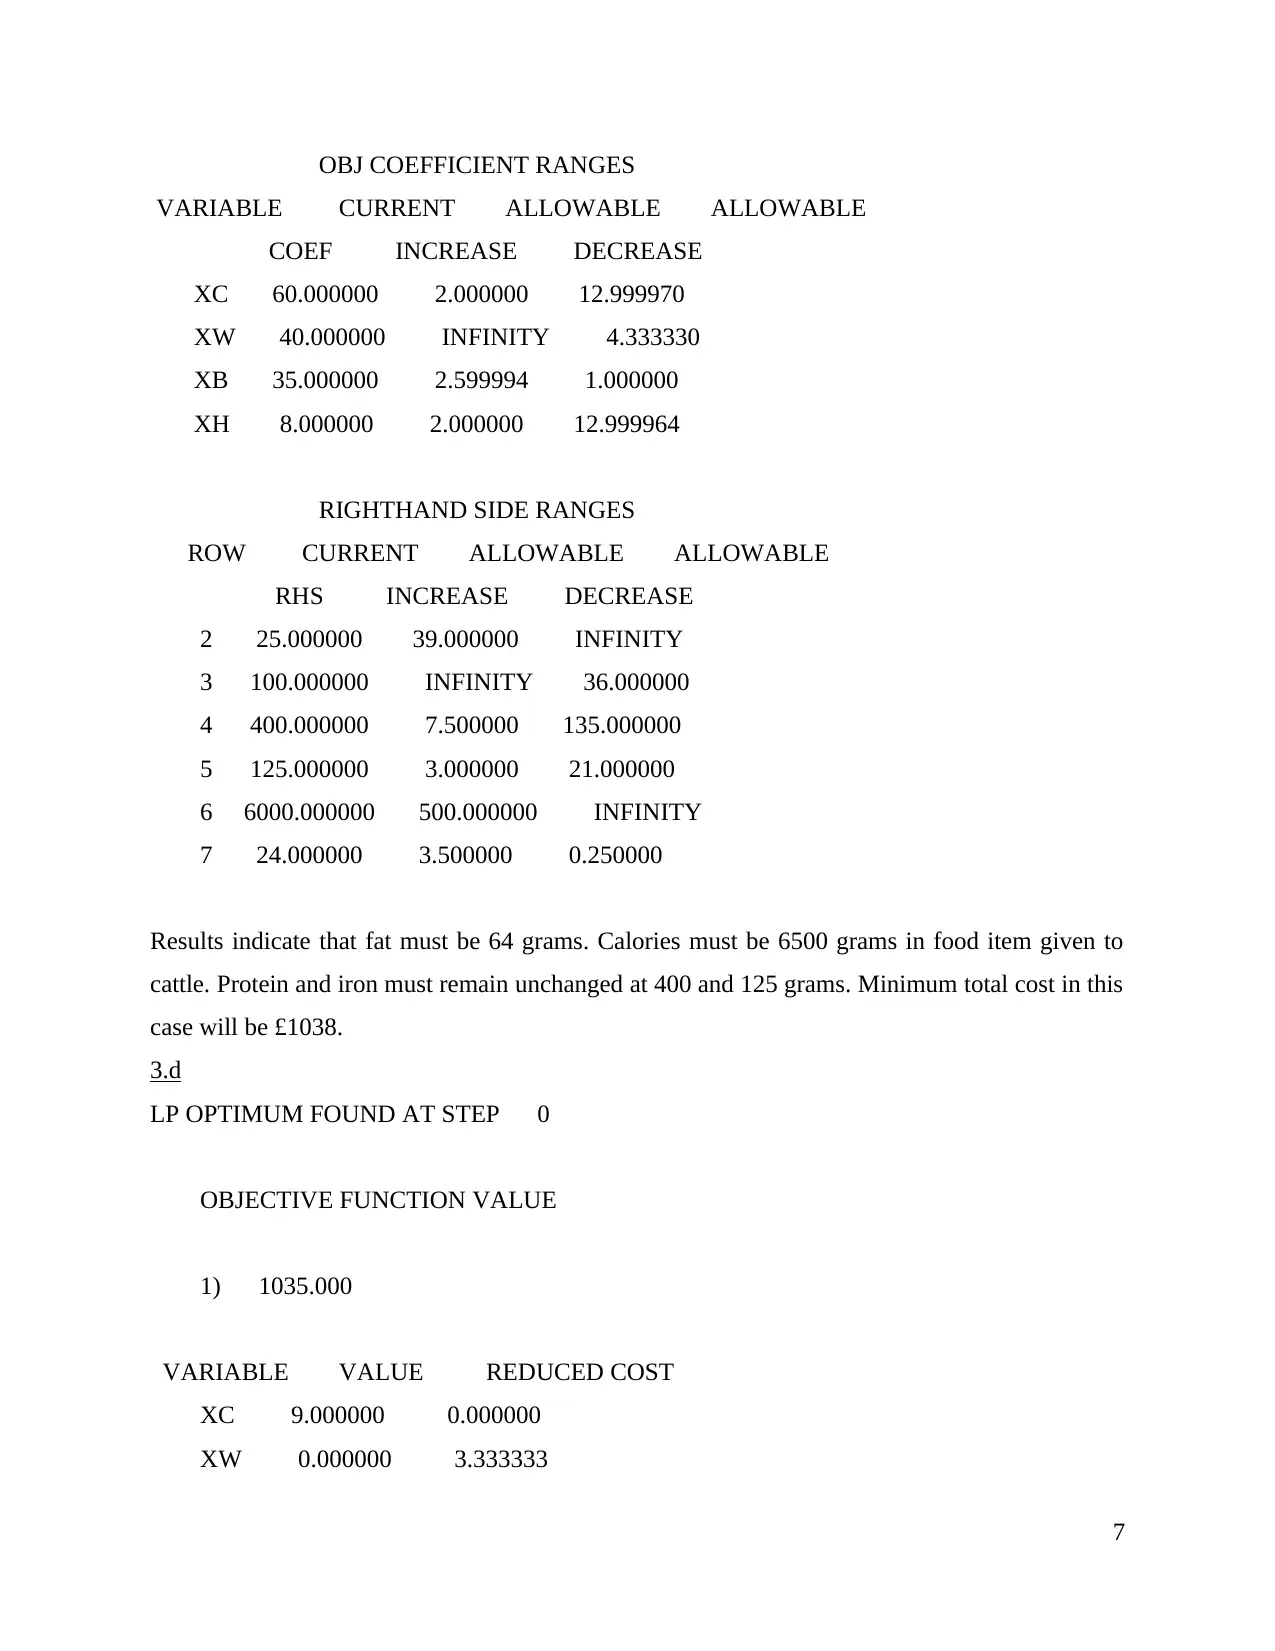
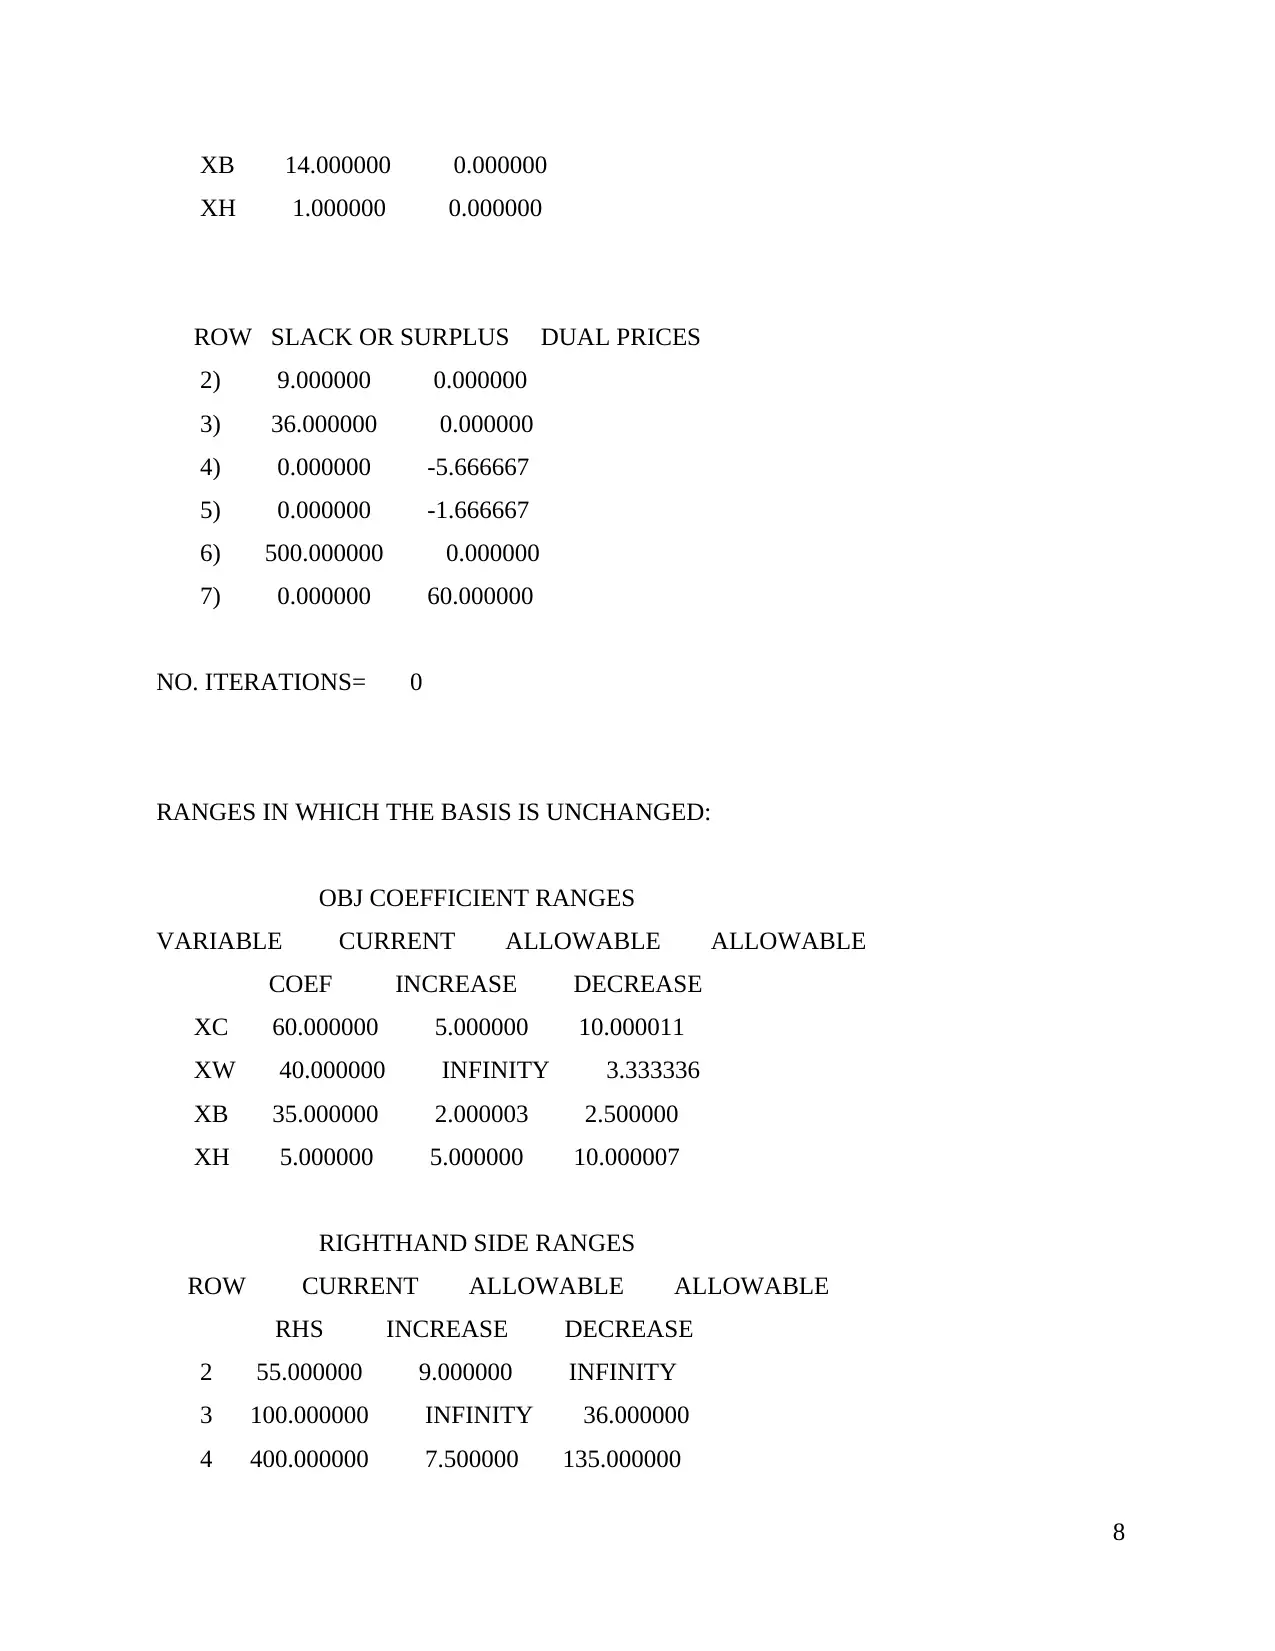
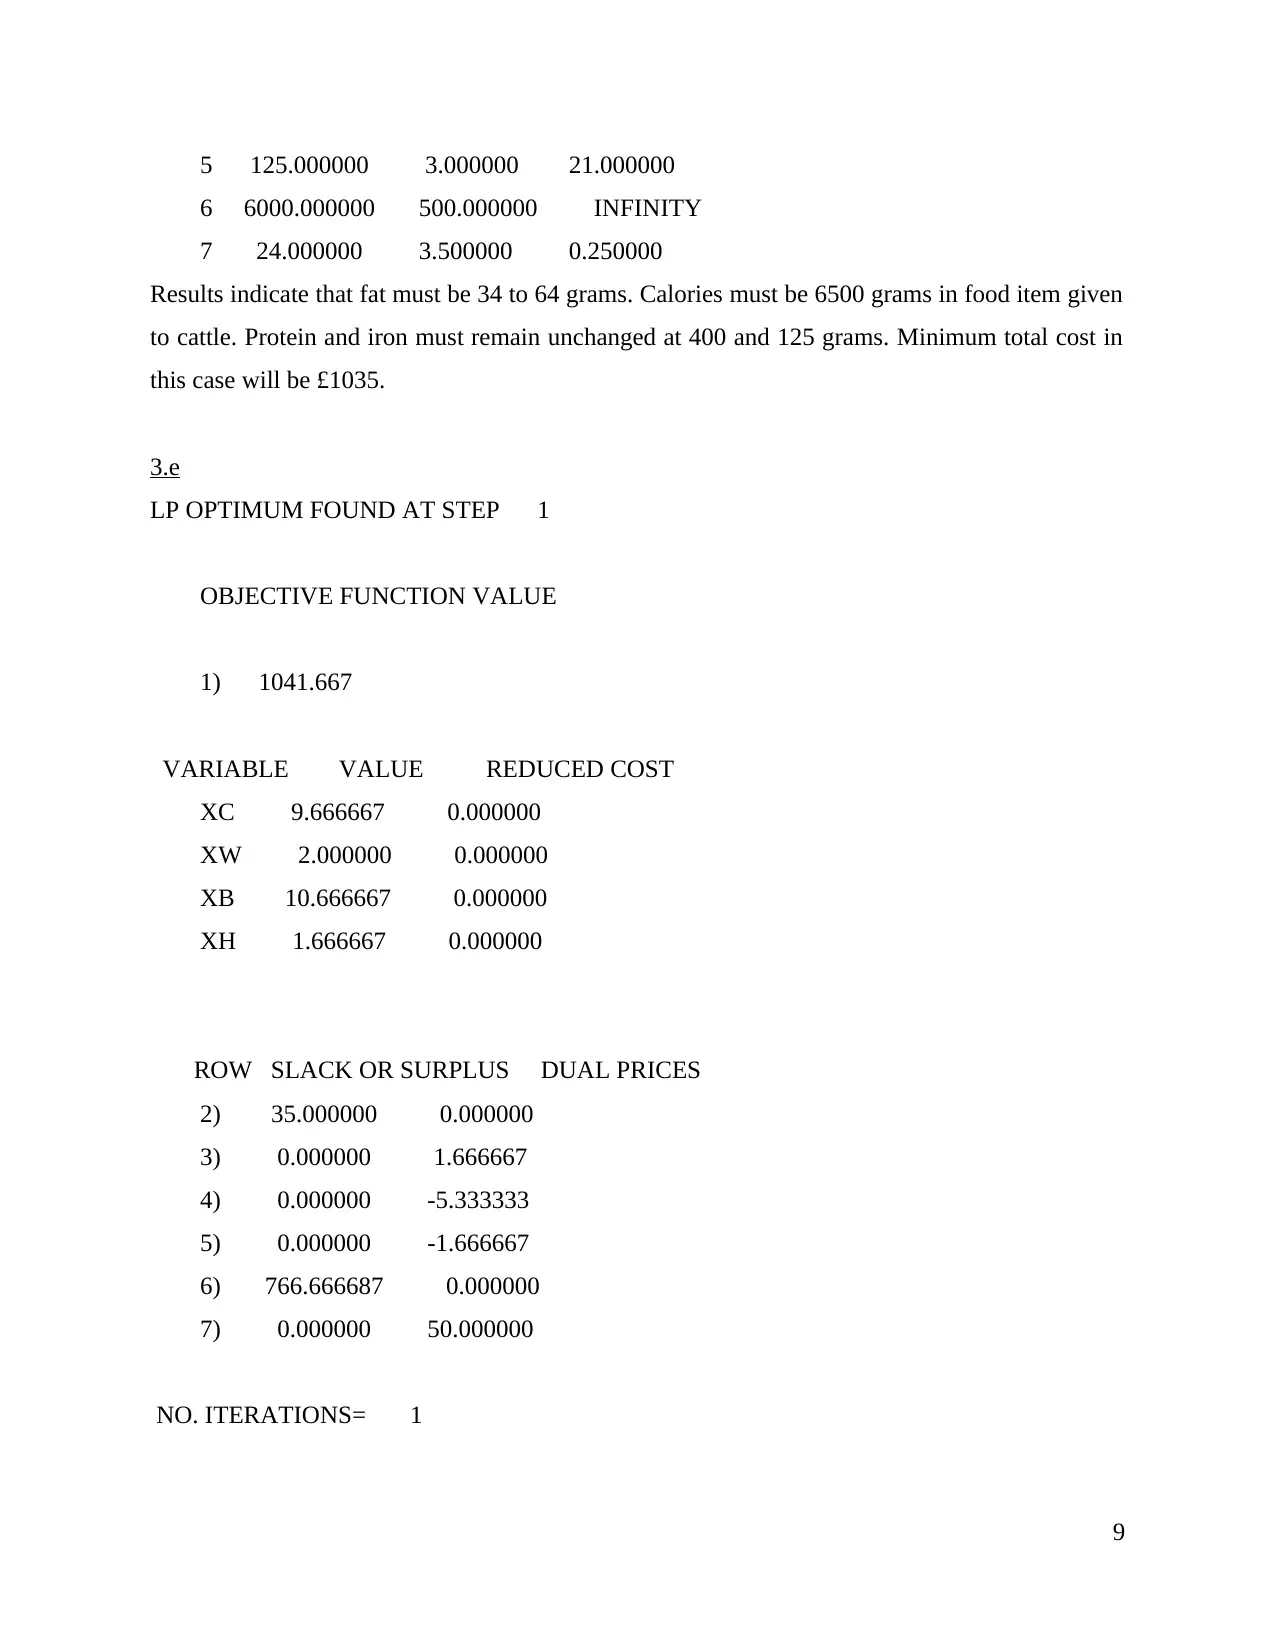
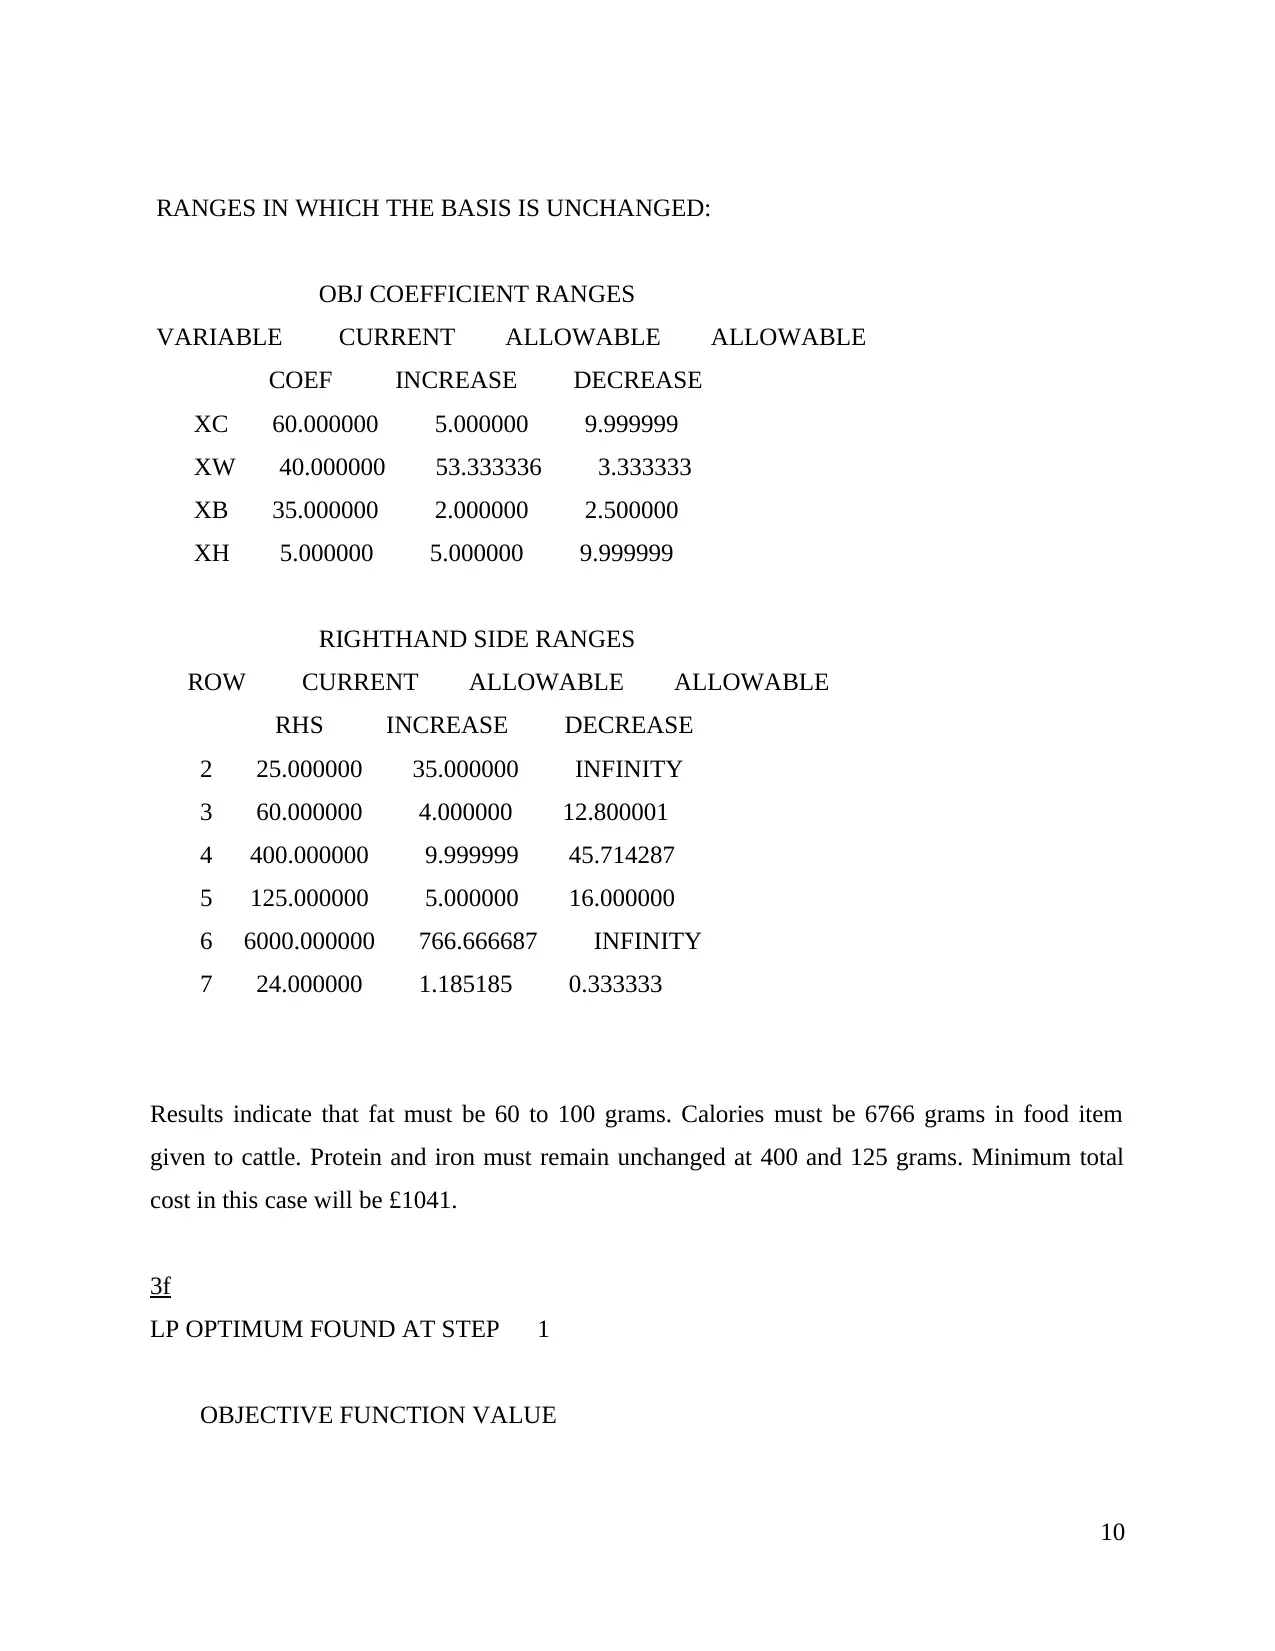
This document presents a comprehensive solution to a Business Analytics assignment, addressing multiple questions related to data analysis and optimization. The assignment begins with a hypothesis test comparing two email interfaces, detailing the calculation of sample standard deviations, test statistics, critical regions, and standard errors to determine significant differences. The solution then moves on to an integer linear model, formulating an equation for profit maximization with constraints, and identifying decision variables. The core of the assignment involves several linear programming (LP) problems, each exploring different scenarios to minimize costs and meet specific nutritional requirements for cattle feed. The LP solutions provide insights into optimal ingredient quantities, minimum total costs, and the impact of changing constraints. Finally, the assignment concludes with an analysis of expected monetary values (EMV) to make a decision based on the probability of weather conditions.

BUSINESS ANALYTICS
Paraphrase This Document
Need a fresh take? Get an instant paraphrase of this document with our AI Paraphraser

TABLE OF CONTENTS
Question 1........................................................................................................................................1
1.1 Hypothesis.............................................................................................................................1
1.2 Sample standard deviation for two interfaces.......................................................................1
1.3 Test statistic and its value.....................................................................................................1
1.4 Critical region.......................................................................................................................1
1.5 Standard error of test statistic................................................................................................2
1.6 Conclusion of test..................................................................................................................2
Q2.....................................................................................................................................................2
Integer linear model....................................................................................................................2
Q3.....................................................................................................................................................3
3.a................................................................................................................................................3
3.b................................................................................................................................................4
3.c................................................................................................................................................6
3.d................................................................................................................................................7
3.e................................................................................................................................................9
3f...............................................................................................................................................10
3g...............................................................................................................................................12
3h...............................................................................................................................................13
(4)...................................................................................................................................................14
REFERENCES..............................................................................................................................15

Question 1
1.1 Hypothesis
H0: There is no significant difference between email interface 1 and 2.
H1: There is significant difference between email interface 1 and 2.
1.2 Sample standard deviation for two interfaces
Sample standard deviation for two interfaces are 0.29 for email interface 1 and 0.35 for
email interface 2.
1.3 Test statistic and its value
T test is the statistic tool that is used to explore significant difference between email
interface 1 and 2. Value of level of significance is 0.00<0.05 which reflect that there is
significant difference between both interface in terms of performance.
1.4 Critical region
5% is the critical region value depicted in the above graph.
1
⊘ This is a preview!⊘
Do you want full access?
Subscribe today to unlock all pages.

Trusted by 1+ million students worldwide

1.5 Standard error of test statistic
Standard error of test statistic is 0.06 which is low. Standard error is the approximate
standard deviation of a statistical sample population (Bressan and et.al., 2016). It is the statistical
term which measure accuracy with which sample distribution represent a population by using a
standard deviation.
1.6 Conclusion of test
On the basis of above discussion, it is concluded that both email interface are completely
generating different results and firm can choose best one out of these alternatives so that less
time can be taken to update message that need to be send to the customer.
Q2
Integer linear model
Max = 7X1+10X2+9X3+3X4+8X5+6X6+8X7
Constraints
4Y1+5Y2+17Y3+10Y4+7Y5+5Y6 = >48
In the linear model given above it can be observed that two equations are prepared. In the first
equation profit maximization it the main objective and due to this reason, each project fixed net
profit is taken in to account. In the first equation.
X1 = Project 1
X2 = Project 2
X3 = Project 3
X4= Project 4
X5= Project 5
X6= Project 6
X7= Project 7
On constraint side main focus is to keep fixed cost as it is in total value but main emphasis is on
picking few projects out of all alternatives. Thus, all cost will be incurred within determined
level. Cost in few projects will be nil so that maximum gain can be made on the project that is
already profitable in nature.
2
Paraphrase This Document
Need a fresh take? Get an instant paraphrase of this document with our AI Paraphraser

Q3
3.a
LP OPTIMUM FOUND AT STEP 0
OBJECTIVE FUNCTION VALUE
1) 1035.000
VARIABLE VALUE REDUCED COST
XC 9.000000 0.000000
XW 0.000000 0.333333
XB 14.000000 0.000000
XH 1.000000 0.000000
ROW SLACK OR SURPLUS DUAL PRICES
2) 39.000000 0.000000
3) 36.000000 0.000000
4) 0.000000 -5.666667
5) 0.000000 -1.666667
6) 500.000000 0.000000
7) 0.000000 60.000000
NO. ITERATIONS= 0
RANGES IN WHICH THE BASIS IS UNCHANGED:
OBJ COEFFICIENT RANGES
VARIABLE CURRENT ALLOWABLE ALLOWABLE
COEF INCREASE DECREASE
3

XC 60.000000 5.000000 1.000014
XW 37.000000 INFINITY 0.333336
XB 35.000000 0.200003 2.500000
XH 5.000000 5.000000 1.000014
RIGHTHAND SIDE RANGES
ROW CURRENT ALLOWABLE ALLOWABLE
RHS INCREASE DECREASE
2 25.000000 39.000000 INFINITY
3 100.000000 INFINITY 36.000000
4 400.000000 7.500000 135.000000
5 125.000000 3.000000 21.000000
6 6000.000000 500.000000 INFINITY
7 24.000000 3.500000 0.250000
Decision variables are those variables where one determines quantity in order to maximize profit
and minimize cost in the business. Results indicate that fat must 64 grams. Calories must be 6500
grams in food item given to cattle. Protein and iron must remain unchanged at 400 and 125
grams. Minimum total cost in this case will be £1035.
3.b
LP OPTIMUM FOUND AT STEP 0
OBJECTIVE FUNCTION VALUE
1) 1021.000
VARIABLE VALUE REDUCED COST
XC 11.800000 0.000000
XW 8.400000 0.000000
XB 0.000000 1.000000
XH 3.800000 0.000000
4
⊘ This is a preview!⊘
Do you want full access?
Subscribe today to unlock all pages.

Trusted by 1+ million students worldwide

ROW SLACK OR SURPLUS DUAL PRICES
2) 22.200001 0.000000
3) 52.799999 0.000000
4) 0.000000 -5.600000
5) 0.000000 -1.000000
6) 1620.000000 0.000000
7) 0.000000 56.000000
NO. ITERATIONS= 0
RANGES IN WHICH THE BASIS IS UNCHANGED:
OBJ COEFFICIENT RANGES
VARIABLE CURRENT ALLOWABLE ALLOWABLE
COEF INCREASE DECREASE
XC 60.000000 5.000000 70.000000
XW 35.000000 1.666667 2.500000
XB 35.000000 INFINITY 1.000001
XH 5.000000 4.999999 INFINITY
RIGHTHAND SIDE RANGES
ROW CURRENT ALLOWABLE ALLOWABLE
RHS INCREASE DECREASE
2 25.000000 22.200001 INFINITY
3 100.000000 INFINITY 52.799999
4 400.000000 31.666666 147.500000
5 125.000000 19.000000 20.999998
6 6000.000000 1620.000000 INFINITY
7 24.000000 3.500000 1.187500
5
Paraphrase This Document
Need a fresh take? Get an instant paraphrase of this document with our AI Paraphraser

Results indicate that fat must be 47 grams. Calories must be 7620 grams in food item given to
cattle. Protein and iron must remain unchanged at 400 and 125 grams. Minimum total cost in this
case will be £1021.
3.c
LP OPTIMUM FOUND AT STEP 1
OBJECTIVE FUNCTION VALUE
1) 1038.000
VARIABLE VALUE REDUCED COST
XC 9.000000 0.000000
XW 0.000000 4.333333
XB 14.000000 0.000000
XH 1.000000 0.000000
ROW SLACK OR SURPLUS DUAL PRICES
2) 39.000000 0.000000
3) 36.000000 0.000000
4) 0.000000 -5.266667
5) 0.000000 -0.666667
6) 500.000000 0.000000
7) 0.000000 48.000000
NO. ITERATIONS= 1
RANGES IN WHICH THE BASIS IS UNCHANGED:
6

OBJ COEFFICIENT RANGES
VARIABLE CURRENT ALLOWABLE ALLOWABLE
COEF INCREASE DECREASE
XC 60.000000 2.000000 12.999970
XW 40.000000 INFINITY 4.333330
XB 35.000000 2.599994 1.000000
XH 8.000000 2.000000 12.999964
RIGHTHAND SIDE RANGES
ROW CURRENT ALLOWABLE ALLOWABLE
RHS INCREASE DECREASE
2 25.000000 39.000000 INFINITY
3 100.000000 INFINITY 36.000000
4 400.000000 7.500000 135.000000
5 125.000000 3.000000 21.000000
6 6000.000000 500.000000 INFINITY
7 24.000000 3.500000 0.250000
Results indicate that fat must be 64 grams. Calories must be 6500 grams in food item given to
cattle. Protein and iron must remain unchanged at 400 and 125 grams. Minimum total cost in this
case will be £1038.
3.d
LP OPTIMUM FOUND AT STEP 0
OBJECTIVE FUNCTION VALUE
1) 1035.000
VARIABLE VALUE REDUCED COST
XC 9.000000 0.000000
XW 0.000000 3.333333
7
⊘ This is a preview!⊘
Do you want full access?
Subscribe today to unlock all pages.

Trusted by 1+ million students worldwide

XB 14.000000 0.000000
XH 1.000000 0.000000
ROW SLACK OR SURPLUS DUAL PRICES
2) 9.000000 0.000000
3) 36.000000 0.000000
4) 0.000000 -5.666667
5) 0.000000 -1.666667
6) 500.000000 0.000000
7) 0.000000 60.000000
NO. ITERATIONS= 0
RANGES IN WHICH THE BASIS IS UNCHANGED:
OBJ COEFFICIENT RANGES
VARIABLE CURRENT ALLOWABLE ALLOWABLE
COEF INCREASE DECREASE
XC 60.000000 5.000000 10.000011
XW 40.000000 INFINITY 3.333336
XB 35.000000 2.000003 2.500000
XH 5.000000 5.000000 10.000007
RIGHTHAND SIDE RANGES
ROW CURRENT ALLOWABLE ALLOWABLE
RHS INCREASE DECREASE
2 55.000000 9.000000 INFINITY
3 100.000000 INFINITY 36.000000
4 400.000000 7.500000 135.000000
8
Paraphrase This Document
Need a fresh take? Get an instant paraphrase of this document with our AI Paraphraser

5 125.000000 3.000000 21.000000
6 6000.000000 500.000000 INFINITY
7 24.000000 3.500000 0.250000
Results indicate that fat must be 34 to 64 grams. Calories must be 6500 grams in food item given
to cattle. Protein and iron must remain unchanged at 400 and 125 grams. Minimum total cost in
this case will be £1035.
3.e
LP OPTIMUM FOUND AT STEP 1
OBJECTIVE FUNCTION VALUE
1) 1041.667
VARIABLE VALUE REDUCED COST
XC 9.666667 0.000000
XW 2.000000 0.000000
XB 10.666667 0.000000
XH 1.666667 0.000000
ROW SLACK OR SURPLUS DUAL PRICES
2) 35.000000 0.000000
3) 0.000000 1.666667
4) 0.000000 -5.333333
5) 0.000000 -1.666667
6) 766.666687 0.000000
7) 0.000000 50.000000
NO. ITERATIONS= 1
9

RANGES IN WHICH THE BASIS IS UNCHANGED:
OBJ COEFFICIENT RANGES
VARIABLE CURRENT ALLOWABLE ALLOWABLE
COEF INCREASE DECREASE
XC 60.000000 5.000000 9.999999
XW 40.000000 53.333336 3.333333
XB 35.000000 2.000000 2.500000
XH 5.000000 5.000000 9.999999
RIGHTHAND SIDE RANGES
ROW CURRENT ALLOWABLE ALLOWABLE
RHS INCREASE DECREASE
2 25.000000 35.000000 INFINITY
3 60.000000 4.000000 12.800001
4 400.000000 9.999999 45.714287
5 125.000000 5.000000 16.000000
6 6000.000000 766.666687 INFINITY
7 24.000000 1.185185 0.333333
Results indicate that fat must be 60 to 100 grams. Calories must be 6766 grams in food item
given to cattle. Protein and iron must remain unchanged at 400 and 125 grams. Minimum total
cost in this case will be £1041.
3f
LP OPTIMUM FOUND AT STEP 1
OBJECTIVE FUNCTION VALUE
10
⊘ This is a preview!⊘
Do you want full access?
Subscribe today to unlock all pages.

Trusted by 1+ million students worldwide
1 out of 17
Related Documents

Your All-in-One AI-Powered Toolkit for Academic Success.
+13062052269
info@desklib.com
Available 24*7 on WhatsApp / Email
Unlock your academic potential
Copyright © 2020–2025 A2Z Services. All Rights Reserved. Developed and managed by ZUCOL.