Report on Business Analytics and Statistics for Good Harvest Company
VerifiedAdded on 2020/03/16
|15
|2570
|33
Report
AI Summary
This report provides a comprehensive analysis of Good Harvest, a startup focused on organic farm products, using a year's worth of data to identify key performance indicators and areas for improvement. The analysis includes descriptive statistics for gross sales, net sales, and profit, along with visualizations. Key findings include the identification of top-selling products (water, fruits, vegetables, dairy, and drinks) and worst-selling products (juicing, herbal teas, spices, snacks, and salad greens). The report also examines the impact of payment methods on sales, revealing significant differences, and analyzes the influence of product location within the shop. Furthermore, the analysis investigates the relationship between sales and gross profits across different months and seasons, uncovering that while monthly sales remain consistent, gross profits vary significantly. The report concludes with recommendations for the CEO and management team, including a need to investigate profit variations, remove underperforming products, and leverage data analytics for informed decision-making.
Business Analytics and Statistics
Name:
Lecturer name:
3rd October 2017
1
Name:
Lecturer name:
3rd October 2017
1
Paraphrase This Document
Need a fresh take? Get an instant paraphrase of this document with our AI Paraphraser
Table of Contents
1. Introduction..............................................................................................................................4
2. Problem definition and business intelligence required.............................................................4
3. Results and findings.................................................................................................................5
Analysis 1: Descriptive statistics.................................................................................................5
Visualizations of the descriptive statistics................................................................................6
Analysis 2: What are the top/worst selling products in terms of sales?.......................................6
Analysis 3: Is there a difference in payments methods?..............................................................7
Hypothesis 1:............................................................................................................................7
Analysis 4: Are the differences in sales performance based on where the product is located in
the shop?......................................................................................................................................8
Hypothesis 4:............................................................................................................................9
Analysis 5: Is there a difference in sales and gross profits between different months of the
year?...........................................................................................................................................10
Hypothesis 5:..........................................................................................................................10
Hypothesis 6:..........................................................................................................................10
Analysis 6: Are there differences in sales performance between different seasons?.................11
Hypothesis 7:..........................................................................................................................11
Discussion of the results and recommendations............................................................................12
References......................................................................................................................................14
2
Table 1: Descriptive Statistics.........................................................................................................5
Table 2: Descriptive Statistics.........................................................................................................5
Table 3: Best-selling products (Top 5)............................................................................................6
Table 4: Worst selling products (Top 5)..........................................................................................7
Table 5: ANOVA: Single Factor.....................................................................................................8
Table 6: ANOVA.............................................................................................................................8
Table 9: Analysis of variance (ANOVA) for the total sales versus product location.....................9
Table 10: Mean total sales based on product location.....................................................................9
Table 11: Analysis of variance (ANOVA) for the net sales versus months..................................10
Table 13: Analysis of variance (ANOVA) for the gross profits versus months............................11
Table 15: Analysis of variance (ANOVA) for the net sales versus seasons.................................12
3
⊘ This is a preview!⊘
Do you want full access?
Subscribe today to unlock all pages.
Trusted by 1+ million students worldwide
1. Introduction
The aim of each and every business enterprise is how they can minimize the costs while
maximizing the profits. This is not a different case for one young start up by the name Good
Harvest. The enterprise is into business of growing organic farm products and selling them
directly to the customers. The CEO is concerned with the costs of goods the company incurs
as well as the revenues. This report is therefore meant to give the insights in regard to the cost
of goods sold as well as the revenue analysis of the company. The CEO can then make
measures that deem appropriate based on the findings.
2. Problem definition and business intelligence required
Cost of goods sold represents the total sum aggregate of the costs of all goods and services
that have been incurred during the accounting period. The costs of goods helps in
determining the profits made by the company. Sometimes the cost of goods can rise making
the profits earned during that period to be lower. This study therefore sought to answer the
following research questions;
a) What are the top/worst selling products in terms of sales?
b) Is there a difference in payments methods?
c) Are the differences in sales performance based on where the product is located in the
shop? How does this effect both profits and revenue?
d) Is there a difference in sales and gross profits between different months of the year?
e) Are their differences in sales performance between different seasons?
4
Paraphrase This Document
Need a fresh take? Get an instant paraphrase of this document with our AI Paraphraser
3. Results and findings
Analysis 1: Descriptive statistics
In this section, we present the descriptive statistics for the three main variables. That is, the gross
sales, the net sales and the profit made by the company.
Table 1: Descriptive Statistics
N Minimum Maximum Mean Std. Deviation
Gross_Sales 366 0 2642 1044.97 326.285
Net_Sales 366 0 2370 1014.26 313.986
Profit Total 366 -33.98 271.97 30.7098 30.05661
Valid N (listwise) 366
Table 2: Descriptive Statistics
N Minimum Maximum Mean Std. Deviation
Cost of Goods ($) 1034 0 8573 205.22 561.072
Total Profit 1034 .00 8702.93 164.7338 482.10651
Total Sales ($) 1034 0 17276 369.96 1014.719
Valid N (listwise) 1034
As can be seen from the above two tables, the average cost of goods for the company
was$205.22, the average profit was $164.73 and the average total sales was $369.96.
5
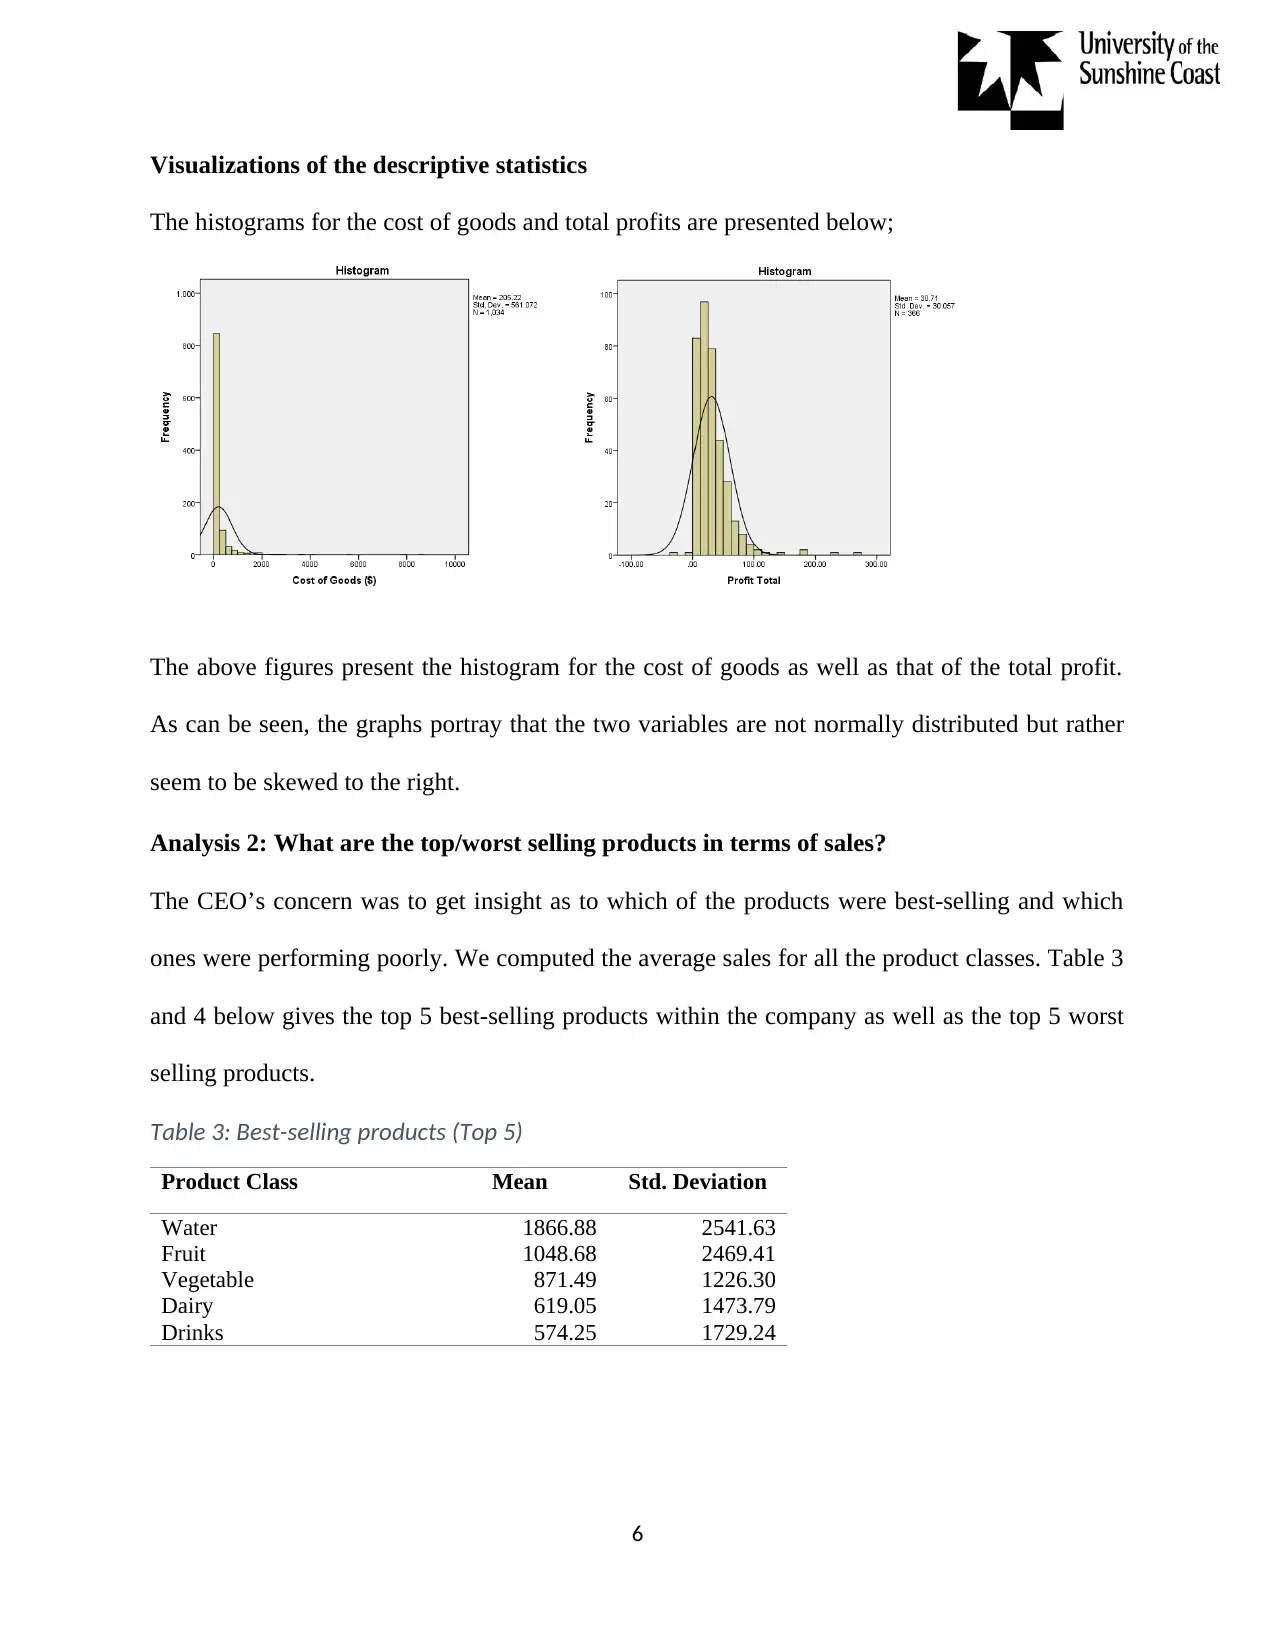
Visualizations of the descriptive statistics
The histograms for the cost of goods and total profits are presented below;
The above figures present the histogram for the cost of goods as well as that of the total profit.
As can be seen, the graphs portray that the two variables are not normally distributed but rather
seem to be skewed to the right.
Analysis 2: What are the top/worst selling products in terms of sales?
The CEO’s concern was to get insight as to which of the products were best-selling and which
ones were performing poorly. We computed the average sales for all the product classes. Table 3
and 4 below gives the top 5 best-selling products within the company as well as the top 5 worst
selling products.
Table 3: Best-selling products (Top 5)
Product Class Mean Std. Deviation
Water 1866.88 2541.63
Fruit 1048.68 2469.41
Vegetable 871.49 1226.30
Dairy 619.05 1473.79
Drinks 574.25 1729.24
6
⊘ This is a preview!⊘
Do you want full access?
Subscribe today to unlock all pages.
Trusted by 1+ million students worldwide
Table 4: Worst selling products (Top 5)
Product Class Mean Std. Deviation
Salad Greens 24.50
Snacks 20.33 0.74
Spices 18.99 32.06
Herbal Teas 17.96 24.37
Juicing 5.00
Water, fruits, vegetables, Dairy products and Drinks forms part of the best-selling products that
the company has. Juicing, Herbal teas, spices, snacks and salad greens are the worst performing
products.
Analysis 3: Is there a difference in payments methods?
How do the different payment methods compare? This is the question we sought to answer. Does
any of the payment methods appear to attract more cash than the others? To test this we, ran
analysis of variance ANOVA test. The test is used to test for significant differences where we
have more than 2 factors. In our case, there were 4 different payment methods (factors) and as
such ANOVA test was the most ideal test. The following hypothesis was tested;
Hypothesis 1:
H0 : μ1=μ2=μ3=μ4
H A : At least one of the meansis different
Tested at α = 0.05
Where,
μ1 is the mean total cash received from cash payment method
μ2 is the mean total cash received from credit payment method
μ1 is the mean total cash received from Visa payment method
7
Paraphrase This Document
Need a fresh take? Get an instant paraphrase of this document with our AI Paraphraser
μ1 is the mean total cash received from MasterCard payment method
Results are presented below;
Table 5: ANOVA: Single Factor
SUMMARY
Groups
Coun
t Sum Average Variance
Cash 366 147971 404.2923 23608.25
Credit 366 214041 584.8115 52380.18
Visa 366 203439 555.8443 59971.05
MasterCard 366 8085 22.09016 4599.441
Table 6: ANOVA
Source of
Variation SS df MS F P-value F crit
Between Groups
7356796
4 3
2452265
5
697.861
3 2.3E-281
2.61099
7
Within Groups
5130400
2 1460 35139.73
Total 1.25E+08 1463
We conducted a one-way between subjects ANOVA so as to compare the mean total cash
received based on the payment method. Table 5 above presents the ANOVA summary. The p-
value was found to be 0.000 (a value less than 5% level of significance), we therefore reject the
null hypothesis and conclude that the mean total cash received from the payment methods is
significantly different.
Analysis 4: Are the differences in sales performance based on where the product is located
in the shop?
In analysis 4, we sought to answer the research question about the differences in sales
performance depending on where the product is located. The concern is whether there are
8
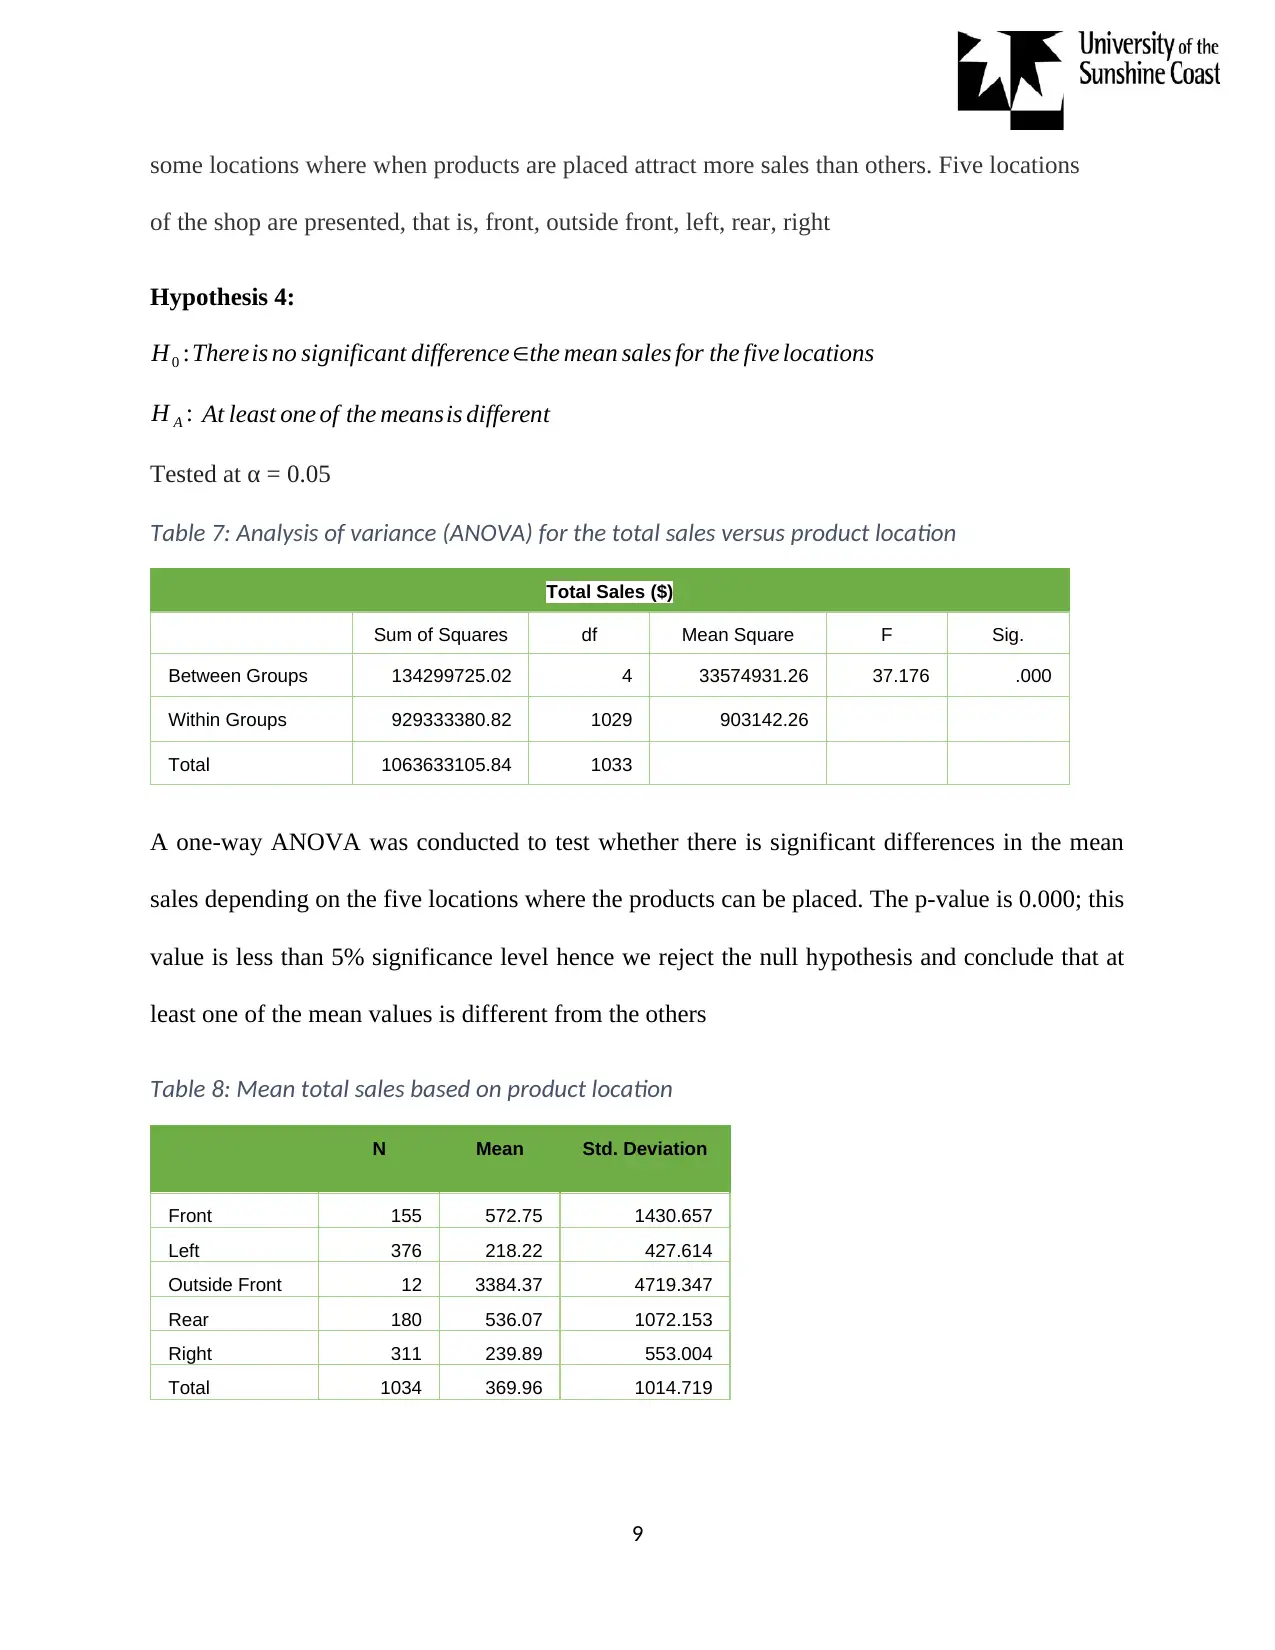
some locations where when products are placed attract more sales than others. Five locations
of the shop are presented, that is, front, outside front, left, rear, right
Hypothesis 4:
H0 :Thereis no significant difference ∈the mean sales for the five locations
H A : At least one of the meansis different
Tested at α = 0.05
Table 7: Analysis of variance (ANOVA) for the total sales versus product location
Total Sales ($)
Sum of Squares df Mean Square F Sig.
Between Groups 134299725.02 4 33574931.26 37.176 .000
Within Groups 929333380.82 1029 903142.26
Total 1063633105.84 1033
A one-way ANOVA was conducted to test whether there is significant differences in the mean
sales depending on the five locations where the products can be placed. The p-value is 0.000; this
value is less than 5% significance level hence we reject the null hypothesis and conclude that at
least one of the mean values is different from the others
Table 8: Mean total sales based on product location
N Mean Std. Deviation
Front 155 572.75 1430.657
Left 376 218.22 427.614
Outside Front 12 3384.37 4719.347
Rear 180 536.07 1072.153
Right 311 239.89 553.004
Total 1034 369.96 1014.719
9
⊘ This is a preview!⊘
Do you want full access?
Subscribe today to unlock all pages.
Trusted by 1+ million students worldwide
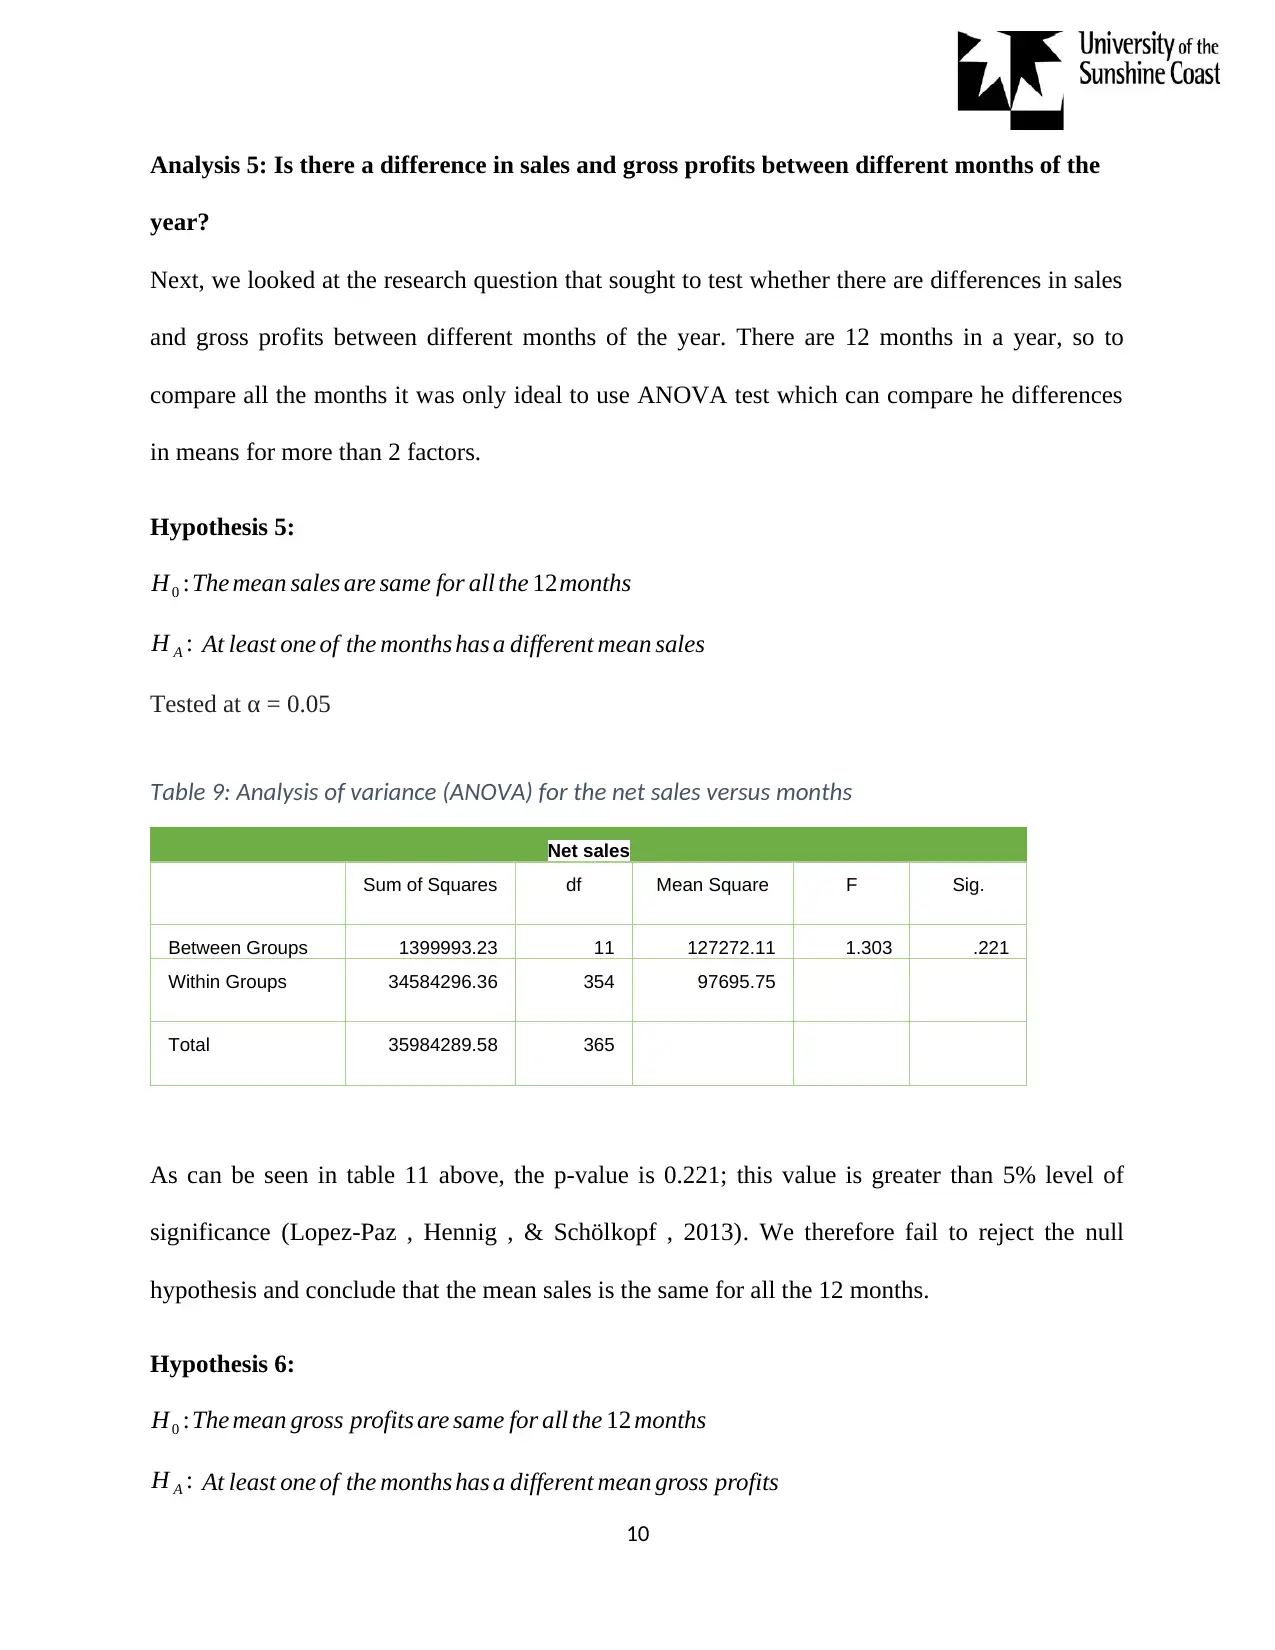
Analysis 5: Is there a difference in sales and gross profits between different months of the
year?
Next, we looked at the research question that sought to test whether there are differences in sales
and gross profits between different months of the year. There are 12 months in a year, so to
compare all the months it was only ideal to use ANOVA test which can compare he differences
in means for more than 2 factors.
Hypothesis 5:
H0 :The mean sales are same for all the 12months
H A : At least one of the months has a different mean sales
Tested at α = 0.05
Table 9: Analysis of variance (ANOVA) for the net sales versus months
Net sales
Sum of Squares df Mean Square F Sig.
Between Groups 1399993.23 11 127272.11 1.303 .221
Within Groups 34584296.36 354 97695.75
Total 35984289.58 365
As can be seen in table 11 above, the p-value is 0.221; this value is greater than 5% level of
significance (Lopez-Paz , Hennig , & Schölkopf , 2013). We therefore fail to reject the null
hypothesis and conclude that the mean sales is the same for all the 12 months.
Hypothesis 6:
H0 :The mean gross profits are same for all the 12 months
H A : At least one of the months has a different mean gross profits
10
Paraphrase This Document
Need a fresh take? Get an instant paraphrase of this document with our AI Paraphraser
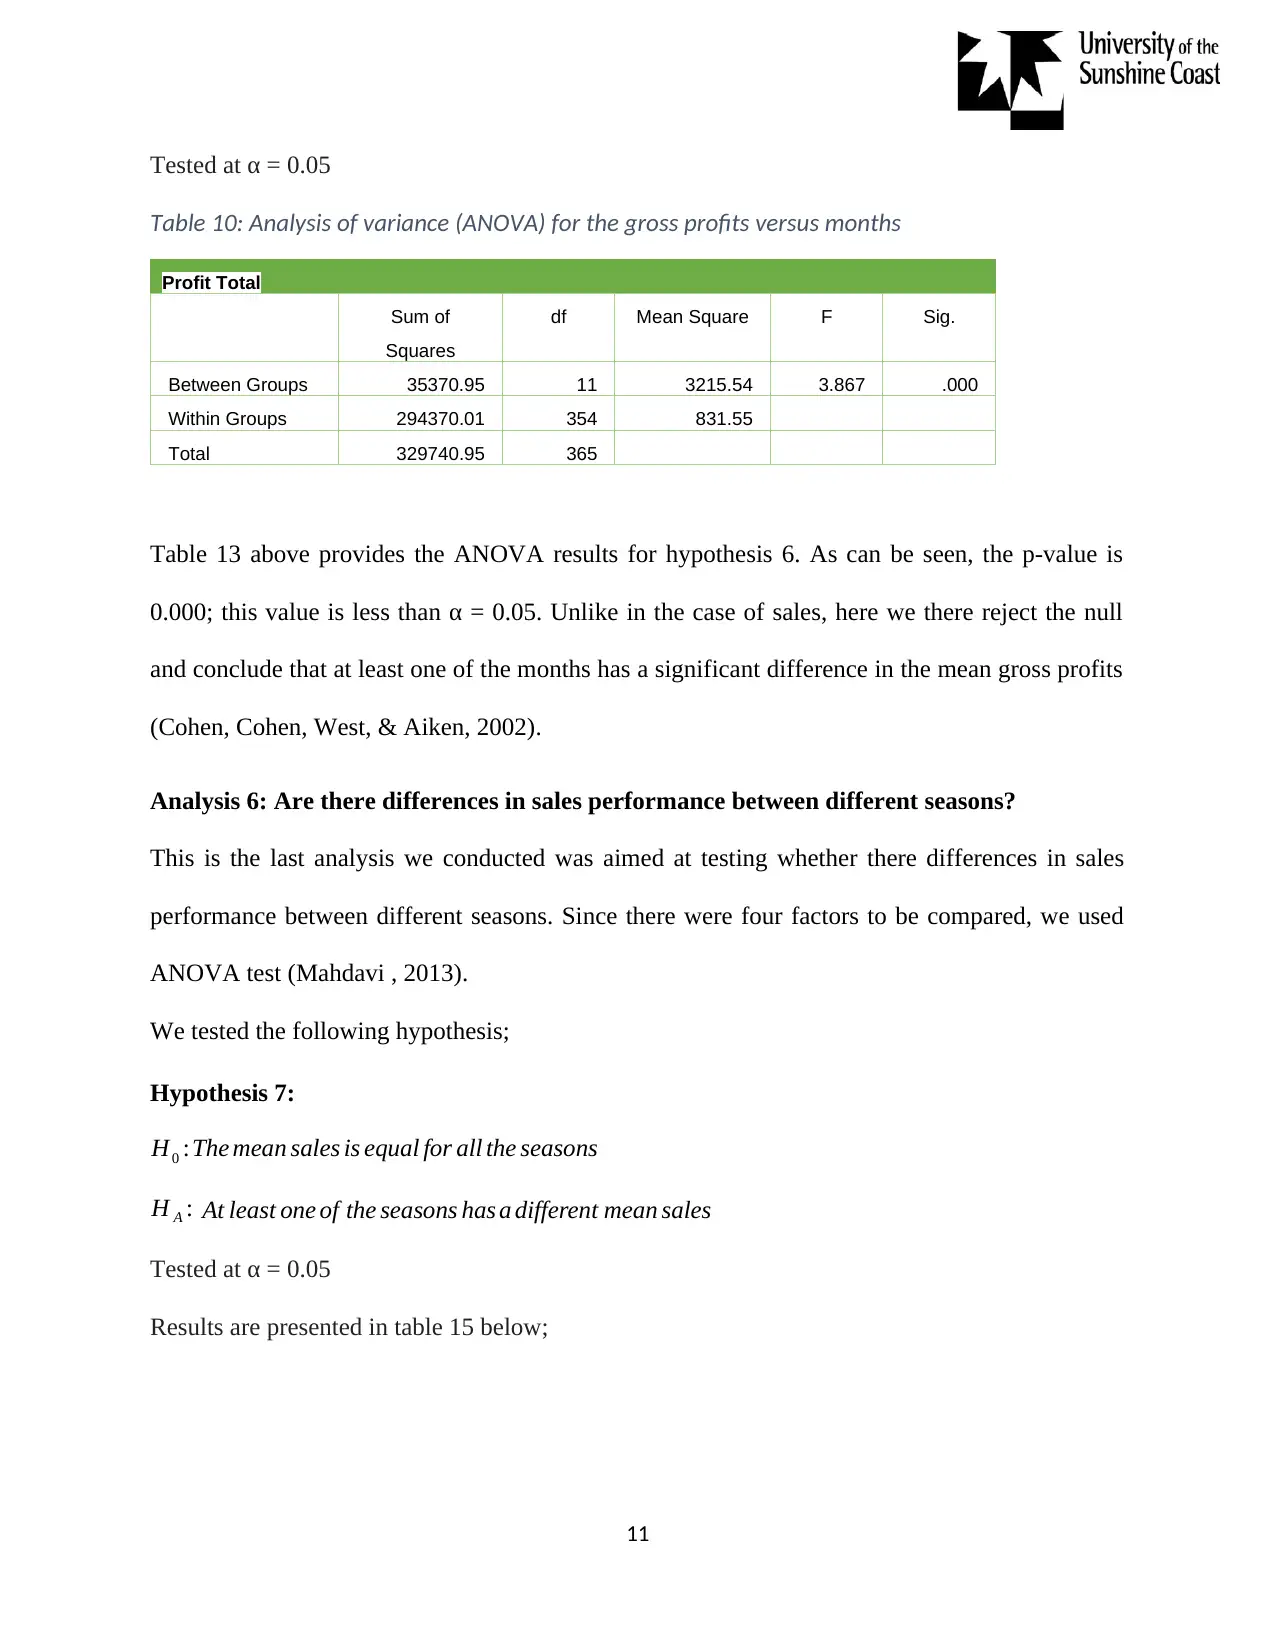
Tested at α = 0.05
Table 10: Analysis of variance (ANOVA) for the gross profits versus months
Profit Total
Sum of
Squares
df Mean Square F Sig.
Between Groups 35370.95 11 3215.54 3.867 .000
Within Groups 294370.01 354 831.55
Total 329740.95 365
Table 13 above provides the ANOVA results for hypothesis 6. As can be seen, the p-value is
0.000; this value is less than α = 0.05. Unlike in the case of sales, here we there reject the null
and conclude that at least one of the months has a significant difference in the mean gross profits
(Cohen, Cohen, West, & Aiken, 2002).
Analysis 6: Are there differences in sales performance between different seasons?
This is the last analysis we conducted was aimed at testing whether there differences in sales
performance between different seasons. Since there were four factors to be compared, we used
ANOVA test (Mahdavi , 2013).
We tested the following hypothesis;
Hypothesis 7:
H0 :The mean sales is equal for all the seasons
H A : At least one of the seasons has a different mean sales
Tested at α = 0.05
Results are presented in table 15 below;
11
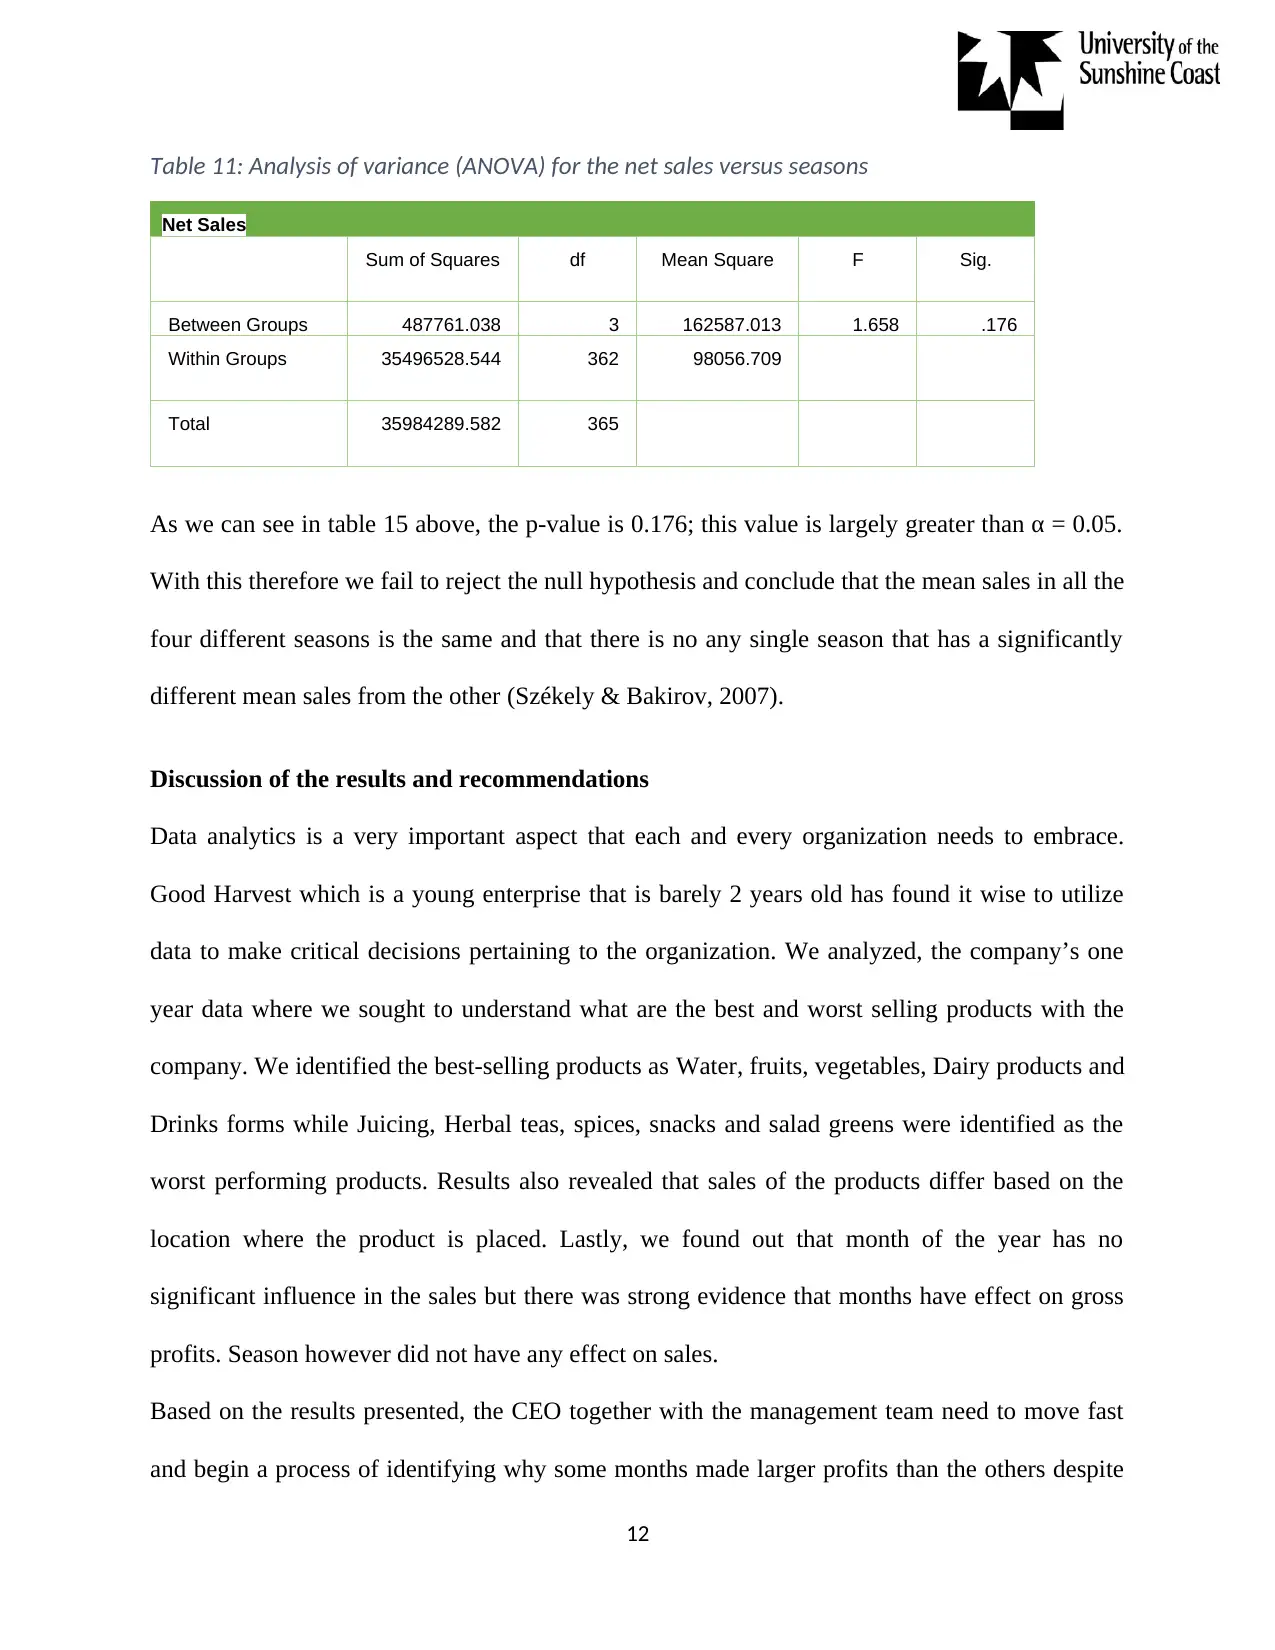
Table 11: Analysis of variance (ANOVA) for the net sales versus seasons
Net Sales
Sum of Squares df Mean Square F Sig.
Between Groups 487761.038 3 162587.013 1.658 .176
Within Groups 35496528.544 362 98056.709
Total 35984289.582 365
As we can see in table 15 above, the p-value is 0.176; this value is largely greater than α = 0.05.
With this therefore we fail to reject the null hypothesis and conclude that the mean sales in all the
four different seasons is the same and that there is no any single season that has a significantly
different mean sales from the other (Székely & Bakirov, 2007).
Discussion of the results and recommendations
Data analytics is a very important aspect that each and every organization needs to embrace.
Good Harvest which is a young enterprise that is barely 2 years old has found it wise to utilize
data to make critical decisions pertaining to the organization. We analyzed, the company’s one
year data where we sought to understand what are the best and worst selling products with the
company. We identified the best-selling products as Water, fruits, vegetables, Dairy products and
Drinks forms while Juicing, Herbal teas, spices, snacks and salad greens were identified as the
worst performing products. Results also revealed that sales of the products differ based on the
location where the product is placed. Lastly, we found out that month of the year has no
significant influence in the sales but there was strong evidence that months have effect on gross
profits. Season however did not have any effect on sales.
Based on the results presented, the CEO together with the management team need to move fast
and begin a process of identifying why some months made larger profits than the others despite
12
⊘ This is a preview!⊘
Do you want full access?
Subscribe today to unlock all pages.
Trusted by 1+ million students worldwide
1 out of 15
Related Documents


Your All-in-One AI-Powered Toolkit for Academic Success.
+13062052269
info@desklib.com
Available 24*7 on WhatsApp / Email
![[object Object]](/_next/static/media/star-bottom.7253800d.svg)
Unlock your academic potential
Copyright © 2020–2026 A2Z Services. All Rights Reserved. Developed and managed by ZUCOL.