Business Analytics Report: Tesco Plc Financial Analysis
VerifiedAdded on  2022/12/30
|19
|3207
|20
Report
AI Summary
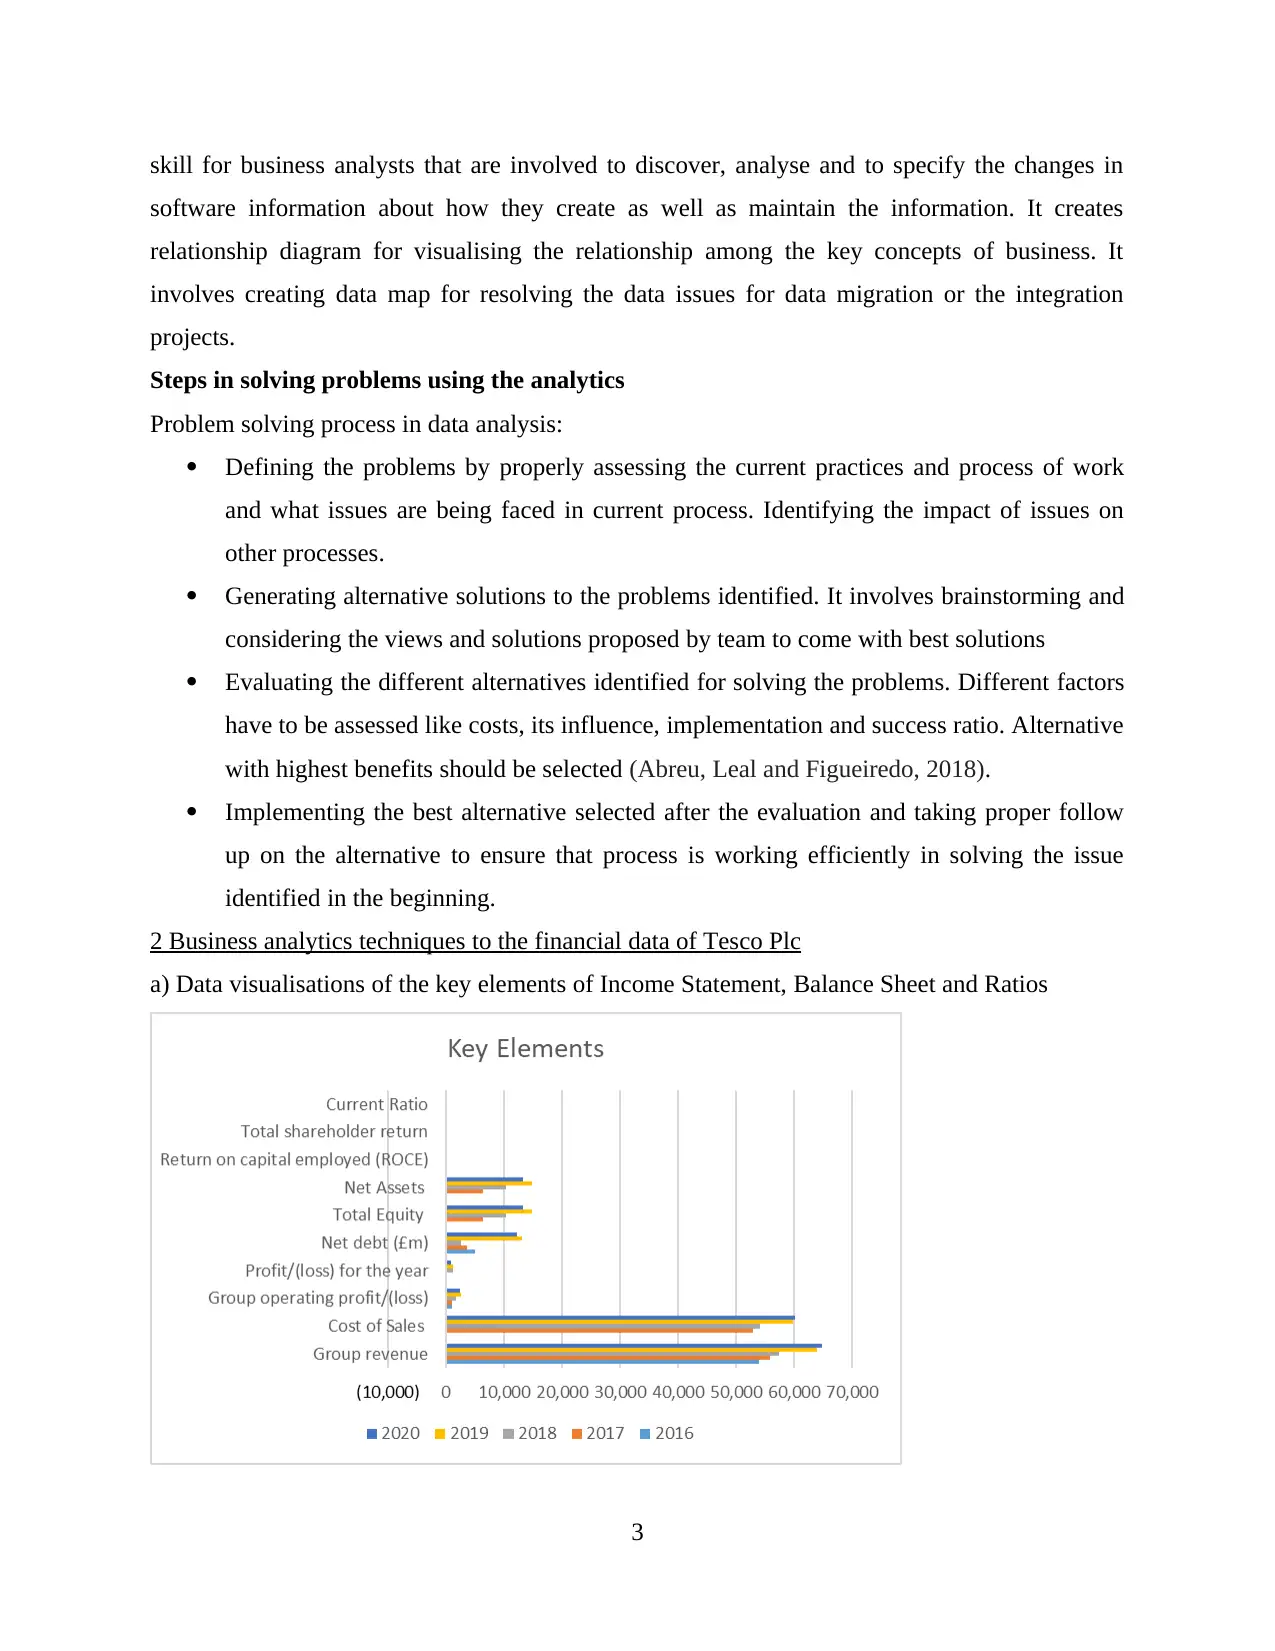
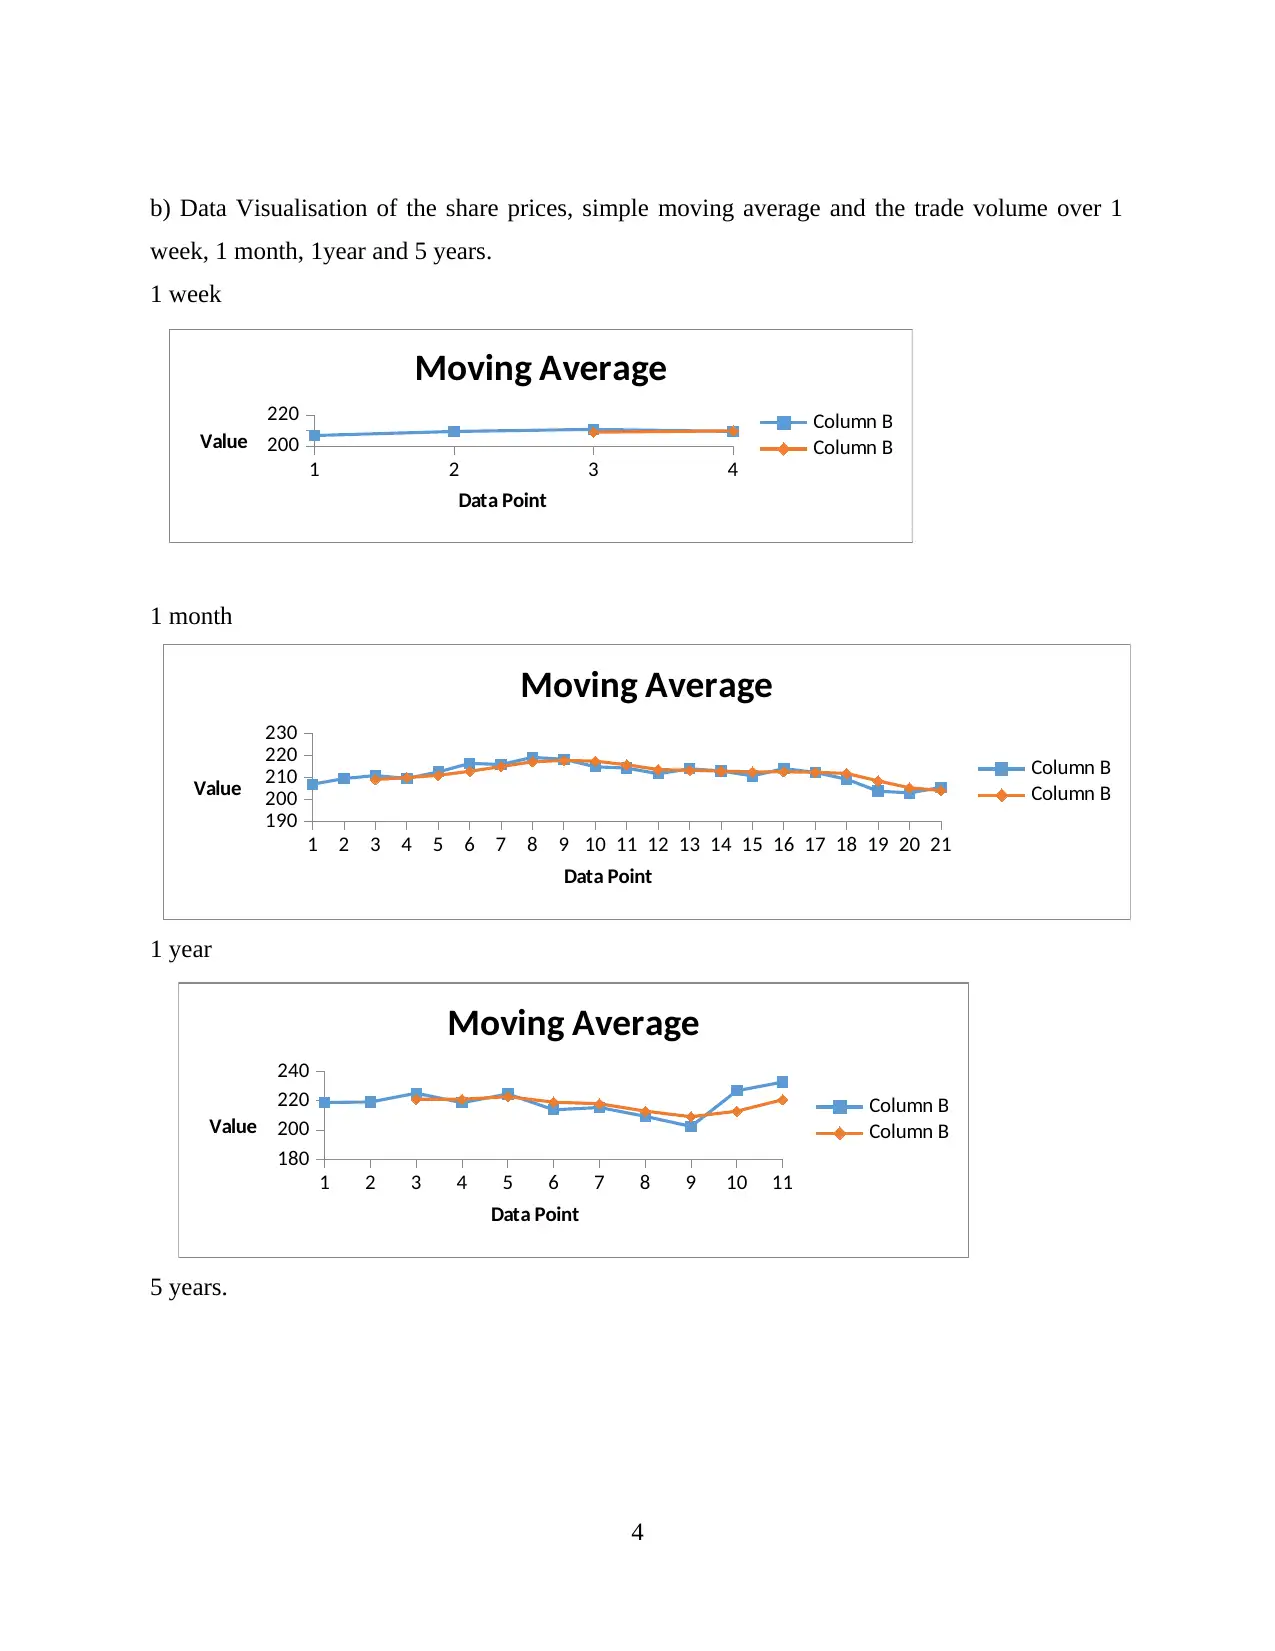
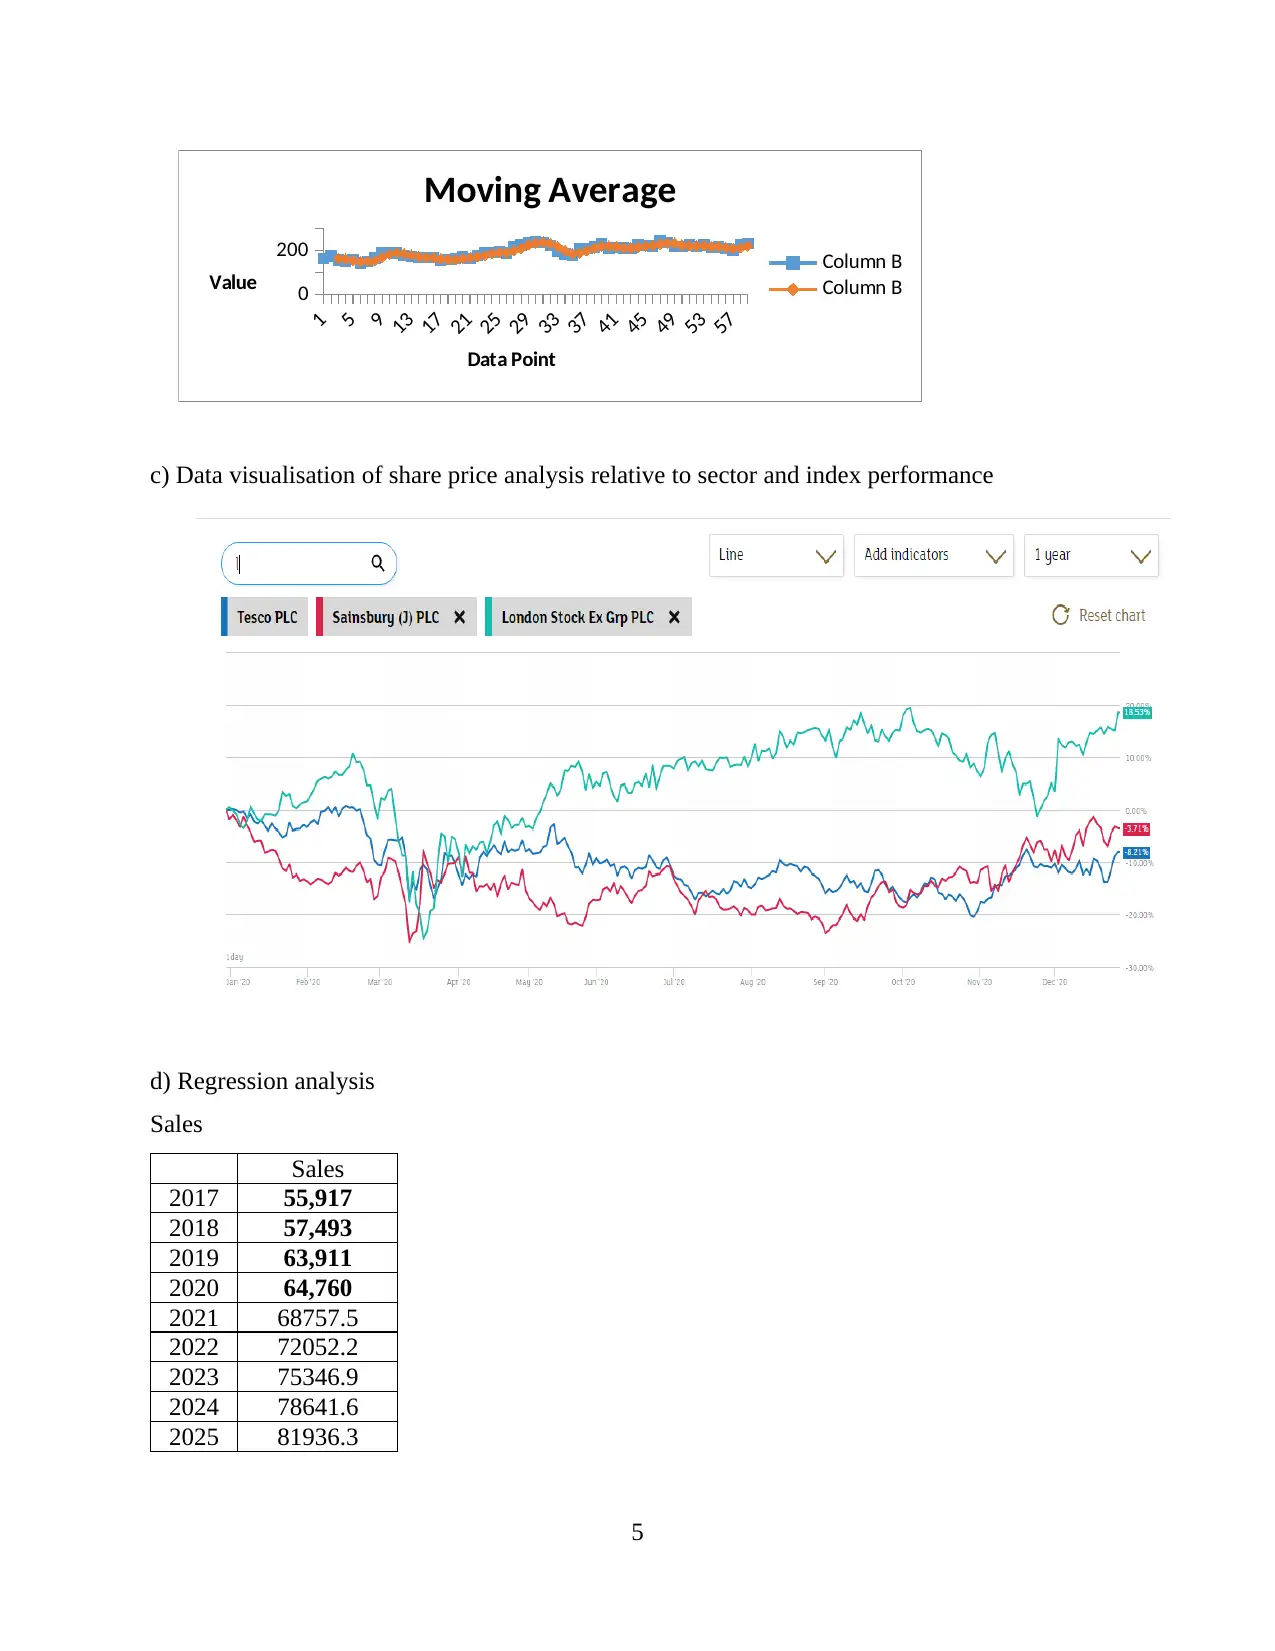
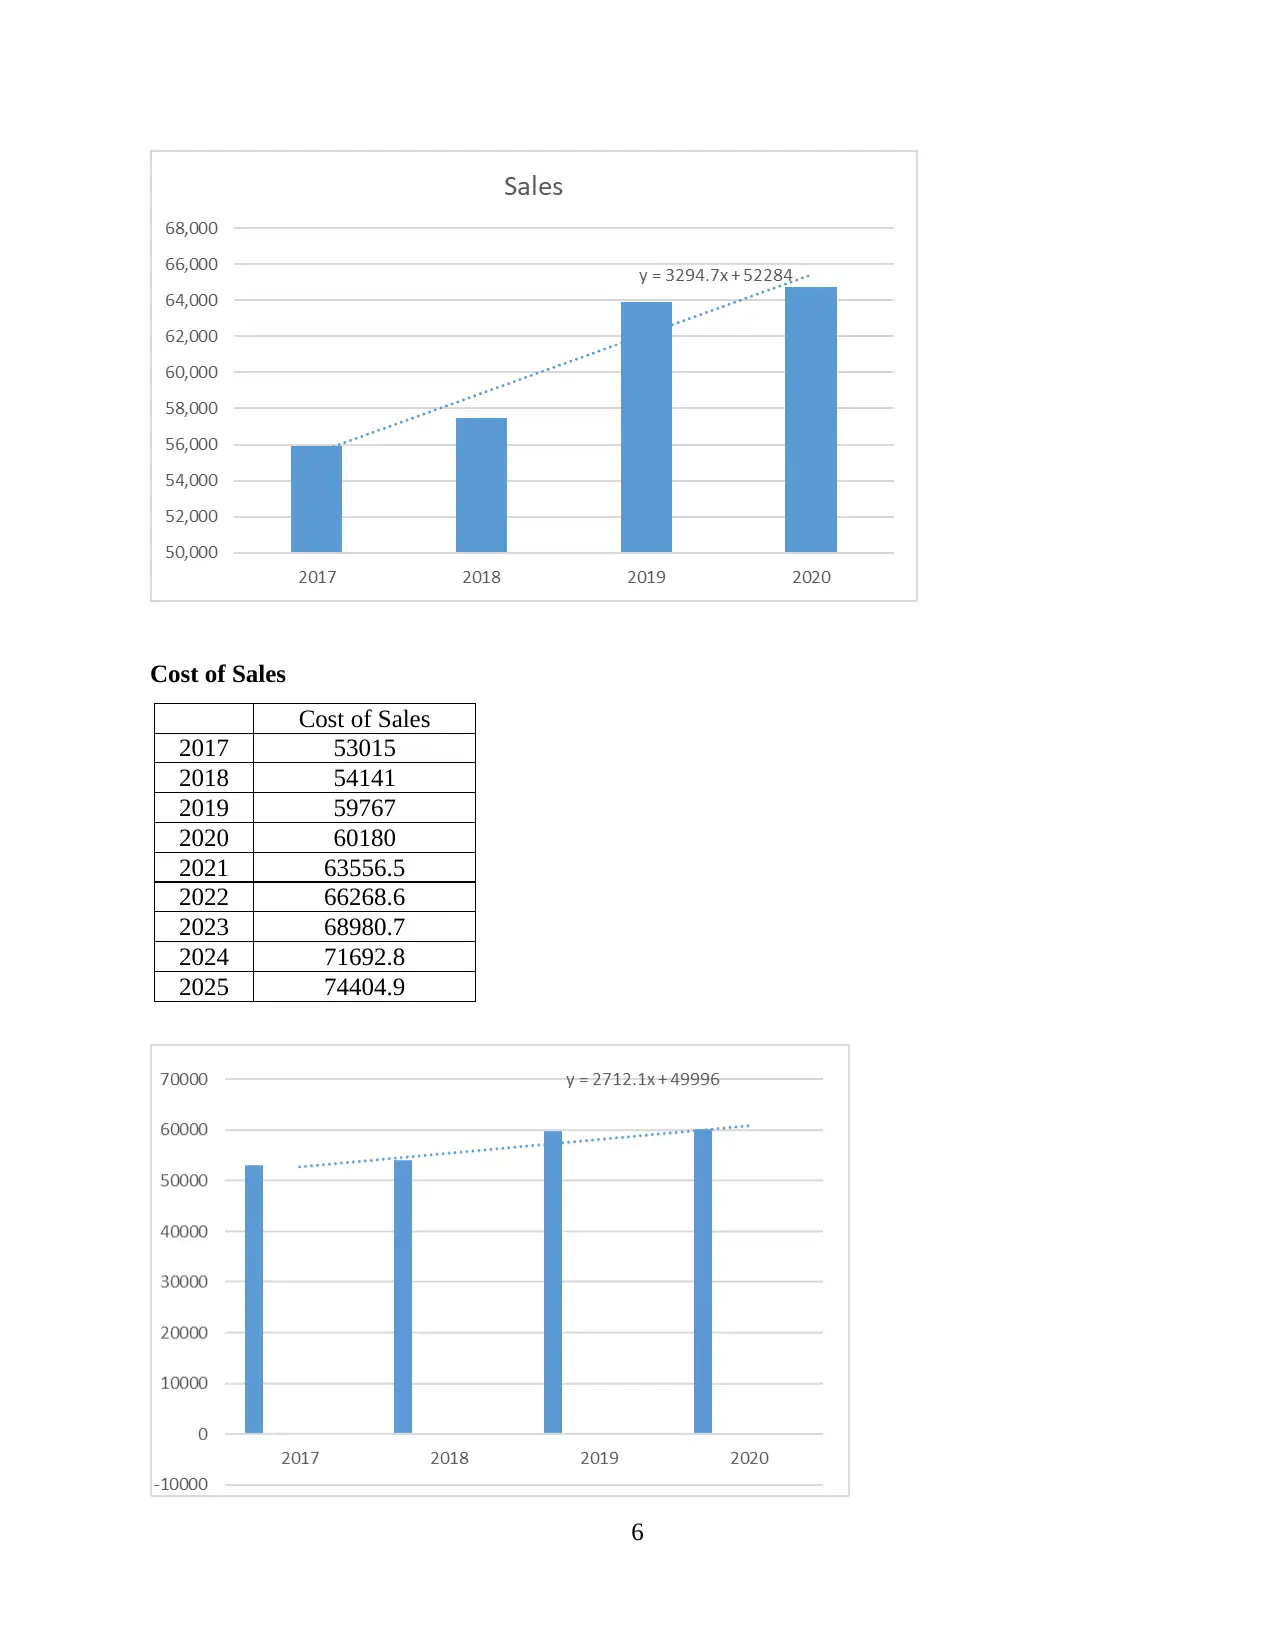
This report delves into the realm of business analytics, commencing with an introduction to its core principles and its pivotal role in deriving value from data. It outlines the steps involved in problem-solving through analytics, emphasizing the significance of data visualization techniques for effective result interpretation. The analysis extends to Tesco Plc's financial data, encompassing income statements, balance sheets, and key financial ratios, complemented by data visualizations of share prices, moving averages, and trade volumes. Furthermore, the report incorporates a regression analysis and presents 5-year financial projections for both the income statement and balance sheet. It concludes by discussing contemporary trends in information management, the evolution of business analytics, and the latest tools deployed within the industry, offering a comprehensive overview of the subject matter.

INTRODUCTION TO
BUSINESS ANALYTICS
BUSINESS ANALYTICS
Paraphrase This Document
Need a fresh take? Get an instant paraphrase of this document with our AI Paraphraser

TABLE OF CONTENTS
TABLE OF CONTENTS................................................................................................................1
INTRODUCTION...........................................................................................................................1
TASK...............................................................................................................................................1
1. Business Analytics and its role in generating value from the data..........................................1
2 Business analytics techniques to the financial data of Tesco Plc.............................................1
5 year projections of income statement and Balance Sheet.........................................................1
3. Contemporary developments in information management industry, evolution of the business
analytics and latest tools being deployed in the business analytics.............................................1
CONCLUSION................................................................................................................................1
REFERENCES................................................................................................................................1

INTRODUCTION
Business analytics could be described as process through which the businesses use the
statistical tools and methods to analyse the historic data to gain new insights and to improve the
strategic decision making. In modern world the technical advancement and automation has
become the integral part of every business organisation as it has made the processes faster and
easier. People are required to up grade their skills and knowledge to adjust with such
environment. Present report will discuss the meaning of business analytics and role in generating
values. It will provide the steps involved in solving problems using analytics. It will also include
the analysis of financial data with help of data visualisation to understand the results in more
effective manner. Further it will discuss contemporary developments in information management
industry, evolution of the business analytic and latest tools employed in the business analytics.
TASK
1. Business Analytics and its role in generating value from the data.
BA refers to skills, practices and technologies for constant iterative investigation and
exploration of the past business performance for gaining insights and driving the business
planning. BA focus over developing the new insights as well as understanding business
performance based over data and the statistical methods. Business intelligence focus over using
consistent metric set to measure the past performance and to guide the business planning that is
also based over data and the statistical methods. It makes extensive use of the numeric analysis
and analytical modelling, including predictive and explanatory modelling and the fact based
management for driving decision making. This related closely to the management science. BA
can be used as the input for decisions and can drive the automated decisions fully (Belotto,
2018). For example in healthcare institute BA is used to manage and operate the clinical
information system. It could transform the medical data from bewildering array of the analytical
method to useful information. The data analysis is used for generating contemporary reporting
system that include latest key indicators of patients, reference values and historical trends. There
are different types of business analytics such as decision analytics, descriptive analytics,
predictive analytics and prescriptive analytics.
Role of BA in generating values from the data
In organisations thy have to deal with large data set and use them to make future
decisions. Business is available with large number of information and it has to use it for making
1
⊘ This is a preview!⊘
Do you want full access?
Subscribe today to unlock all pages.

Trusted by 1+ million students worldwide

informed decisions that will enable them to grow and succeed in future. It also helps in
analysing the internal strengths and weaknesses and how they could be overcome. BA in
business organisation derives value from data by:
ï‚· Analysis of data from number of sources. It can be anything that relates to business from
cloud applications to the marketing information tool and the CRM software. The research
is made based on the specific area for which analysis are to be made.
ï‚· Use of advanced statistics and analytics for finding patterns in the data sets. Patterns of
data help in predicting trends in future and the access over new insights in consumers and
behaviours.
ï‚· Monitor trends and KPIs as they change with the real time. It makes easy for the
businesses to have their information at one place and come over conclusions accurately
and quickly.
ï‚· It supports decision based over most recent information. With the BA providing vast data
that is used to back up the decisions, and to ensure that company is informed to handle
not only one but different scenarios.
These are common uses of the business analytics in organisation that derives valuable
information from raw data. Companies could go deep for deriving more accurate results from the
information. In depth analysis of business information is performed using descriptive analytics,
diagnostic analysis to identify pat performance that is influencing the trend. Predictive analytics
use statistics to assess and forecast the future outcomes using statistical models as well as
machine learning techniques (Assarroudi and et.al., 2018). On the other prescriptive analysis
make use of past performance for finding how same situations could be handled in future. Thus,
it could be said that BA helps in deriving high benefits from the data and information.
Difference between model and modelling
Data model – It organises data elements and provides how elements would relate to each other.
Data elements records real life such as places, people, things and event between them, data
model presents reality. It is used to aid communication between business people that define
requirements for the computer systems and technical employees defining design in the response
of those requirements. It explicitly determines structure of the data.
Data modelling – It could be described as set of techniques and tools that are used analyse and
understand how organisations should, update, collect and store the data. Modelling is critical
2
Paraphrase This Document
Need a fresh take? Get an instant paraphrase of this document with our AI Paraphraser

skill for business analysts that are involved to discover, analyse and to specify the changes in
software information about how they create as well as maintain the information. It creates
relationship diagram for visualising the relationship among the key concepts of business. It
involves creating data map for resolving the data issues for data migration or the integration
projects.
Steps in solving problems using the analytics
Problem solving process in data analysis:
ï‚· Defining the problems by properly assessing the current practices and process of work
and what issues are being faced in current process. Identifying the impact of issues on
other processes.
ï‚· Generating alternative solutions to the problems identified. It involves brainstorming and
considering the views and solutions proposed by team to come with best solutions
ï‚· Evaluating the different alternatives identified for solving the problems. Different factors
have to be assessed like costs, its influence, implementation and success ratio. Alternative
with highest benefits should be selected (Abreu, Leal and Figueiredo, 2018).
ï‚· Implementing the best alternative selected after the evaluation and taking proper follow
up on the alternative to ensure that process is working efficiently in solving the issue
identified in the beginning.
2 Business analytics techniques to the financial data of Tesco Plc
a) Data visualisations of the key elements of Income Statement, Balance Sheet and Ratios
3

b) Data Visualisation of the share prices, simple moving average and the trade volume over 1
week, 1 month, 1year and 5 years.
1 week
1 month
1 year
5 years.
4
1 2 3 4
200
220
Moving Average
Column B
Column B
Data Point
Value
1 2 3 4 5 6 7 8 9 10 11
180
200
220
240
Moving Average
Column B
Column B
Data Point
Value
1 2 3 4 5 6 7 8 9 10 11 12 13 14 15 16 17 18 19 20 21
190
200
210
220
230
Moving Average
Column B
Column B
Data Point
Value
⊘ This is a preview!⊘
Do you want full access?
Subscribe today to unlock all pages.

Trusted by 1+ million students worldwide

c) Data visualisation of share price analysis relative to sector and index performance
d) Regression analysis
Sales
Sales
2017 55,917
2018 57,493
2019 63,911
2020 64,760
2021 68757.5
2022 72052.2
2023 75346.9
2024 78641.6
2025 81936.3
5
1 5 9131721252933374145495357
0
200
Moving Average
Column B
Column B
Data Point
Value
d) Regression analysis
Sales
Sales
2017 55,917
2018 57,493
2019 63,911
2020 64,760
2021 68757.5
2022 72052.2
2023 75346.9
2024 78641.6
2025 81936.3
5
1 5 9131721252933374145495357
0
200
Moving Average
Column B
Column B
Data Point
Value
Paraphrase This Document
Need a fresh take? Get an instant paraphrase of this document with our AI Paraphraser

Cost of Sales
Cost of Sales
2017 53015
2018 54141
2019 59767
2020 60180
2021 63556.5
2022 66268.6
2023 68980.7
2024 71692.8
2025 74404.9
6
Cost of Sales
2017 53015
2018 54141
2019 59767
2020 60180
2021 63556.5
2022 66268.6
2023 68980.7
2024 71692.8
2025 74404.9
6

Operating Profit
Operating profit
2017 1,017
2018 1,839
2019 2,649
2020 2,518
2021 3334
2022 3865.3
2023 4396.6
2024 4927.9
2025 5459.2
Profits
Profit
2017 (54)
2018 1,210
2019 1,270
2020 973
2021 1635
2022 1949.1
2023 2263.2
2024 2577.3
2025 2891.4
7
Operating profit
2017 1,017
2018 1,839
2019 2,649
2020 2,518
2021 3334
2022 3865.3
2023 4396.6
2024 4927.9
2025 5459.2
Profits
Profit
2017 (54)
2018 1,210
2019 1,270
2020 973
2021 1635
2022 1949.1
2023 2263.2
2024 2577.3
2025 2891.4
7
⊘ This is a preview!⊘
Do you want full access?
Subscribe today to unlock all pages.

Trusted by 1+ million students worldwide

ROCE
ROCE
2017 8.00
2018 11.00
2019 7.00
2020 9.00
2021 8.5
2022 8.4
2023 8.3
2024 8.2
2025 8.1
8
ROCE
2017 8.00
2018 11.00
2019 7.00
2020 9.00
2021 8.5
2022 8.4
2023 8.3
2024 8.2
2025 8.1
8
Paraphrase This Document
Need a fresh take? Get an instant paraphrase of this document with our AI Paraphraser

Shareholders Return
Sharehol
der
return
2017 (7.5%)
2018 8.7%
2019 10.2%
2020 5.2%
2021 26%
2022 30%
2023 33%
2024 37%
2025 41%
9
Sharehol
der
return
2017 (7.5%)
2018 8.7%
2019 10.2%
2020 5.2%
2021 26%
2022 30%
2023 33%
2024 37%
2025 41%
9

Net Assets
Net Assets
2017 6414
2018 10458
2019 14834
2020 13253
2021 17463
2022 19952
2023 22442
2024 24931
2025 27420
10
Net Assets
2017 6414
2018 10458
2019 14834
2020 13253
2021 17463
2022 19952
2023 22442
2024 24931
2025 27420
10
⊘ This is a preview!⊘
Do you want full access?
Subscribe today to unlock all pages.

Trusted by 1+ million students worldwide
1 out of 19
Related Documents

Your All-in-One AI-Powered Toolkit for Academic Success.
 +13062052269
info@desklib.com
Available 24*7 on WhatsApp / Email
Unlock your academic potential
Copyright © 2020–2025 A2Z Services. All Rights Reserved. Developed and managed by ZUCOL.