ICT Business Analytics and Data Visualization Report - NIT3171

Verified

Added on  2022/08/14

|19
|2672
|15
Report
AI Summary
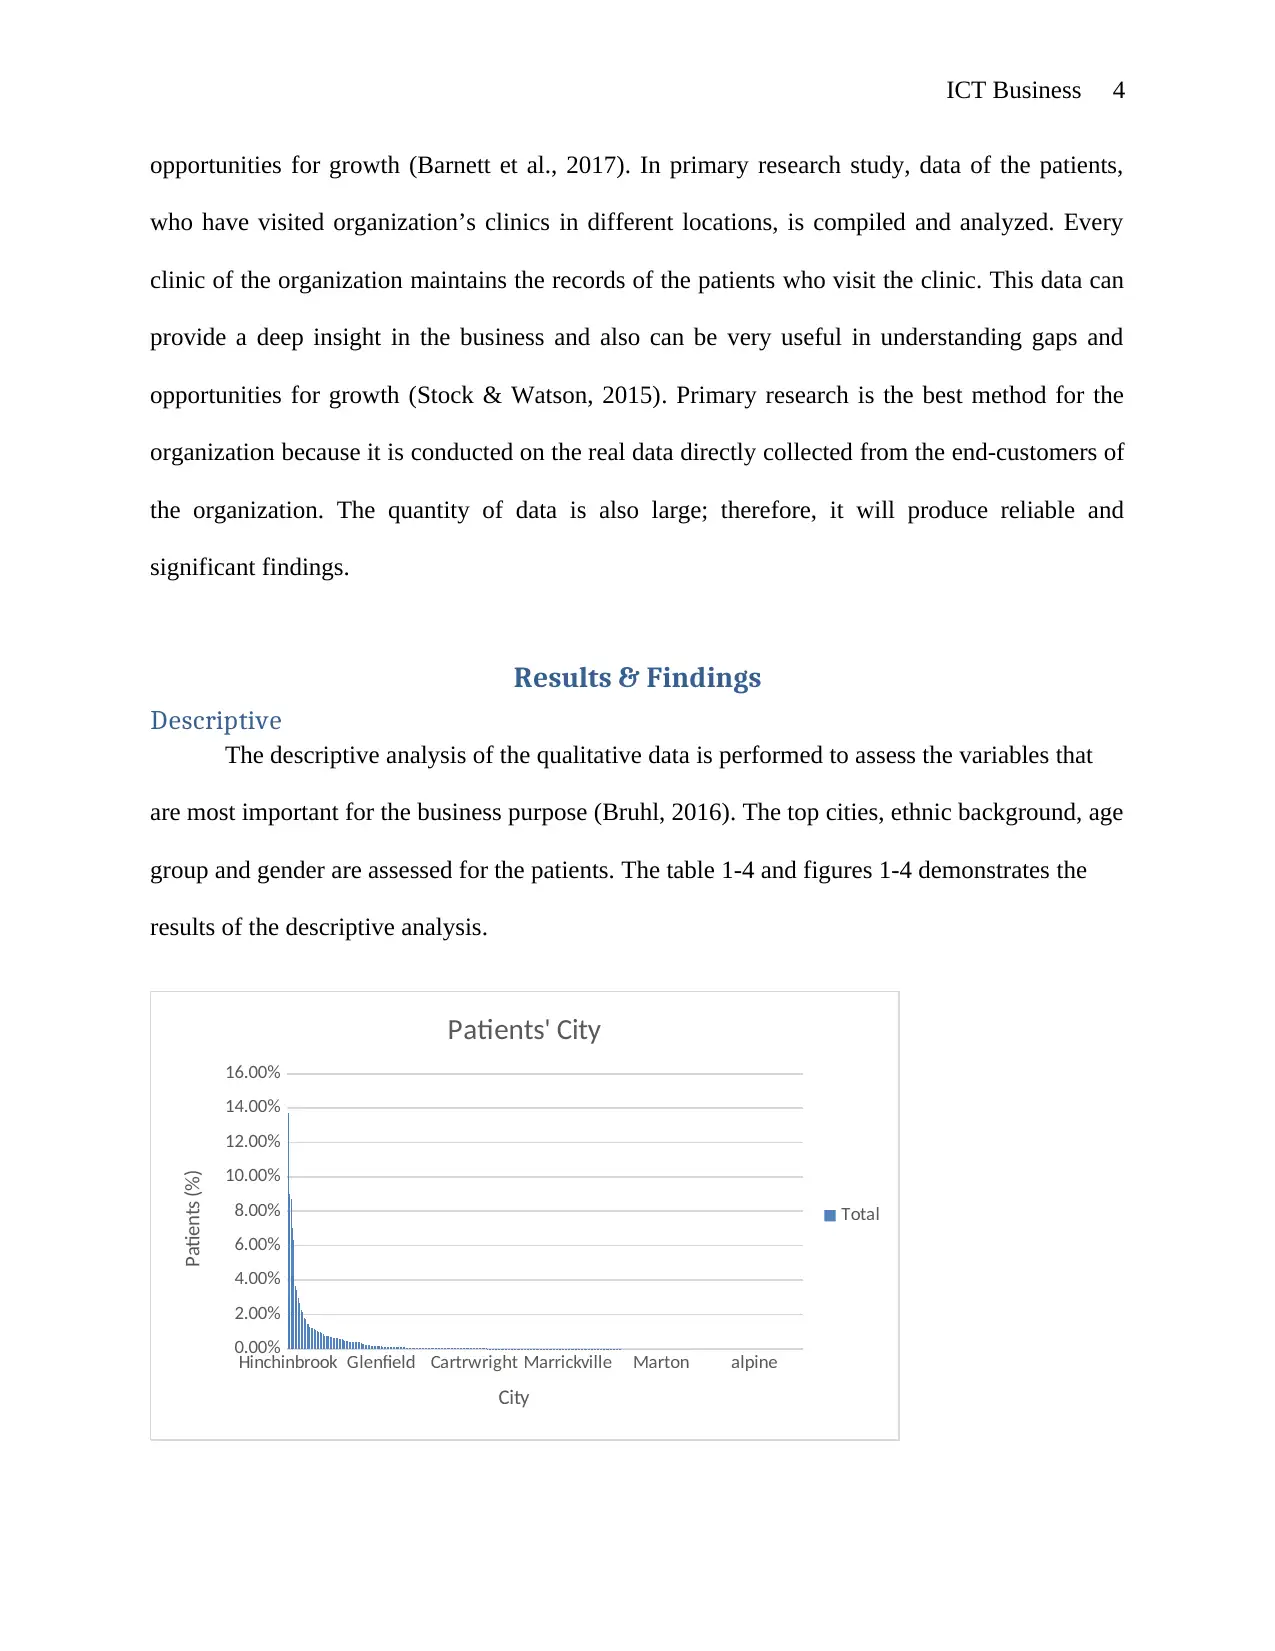
This report presents a comprehensive business analytics study of a medical organization operating multiple clinics in Australia. The assignment, undertaken as part of the NIT3171 course, employs descriptive, predictive, and prescriptive analysis to assess various aspects of the clinics' operations. The descriptive analysis examines patient demographics (cities, ethnicity, gender, age), popular services, medications, and reasons for visits. Predictive analysis forecasts annual income, cold and flu cases, and correlations between diseases like diabetes, hypertension, obesity, and depression. Prescriptive analysis offers recommendations for improving patient engagement, optimizing service offerings, and targeting specific patient segments based on their visit frequency and ethnic background. The report aims to identify strengths, weaknesses, and opportunities for business growth, providing actionable insights for strategic decision-making within the organization. Data from 2015-2019 is used to analyze trends, identify patterns, and provide insights.
Document Page
ICT Business 1
ICT BUSINESS ANALYTICS AND DATA VISUALIZATION
By
Student’s Name
Class:
Professor Name:
State and City:
Submission date:
tabler-icon-diamond-filled.svg

Paraphrase This Document

Need a fresh take? Get an instant paraphrase of this document with our AI Paraphraser
Document Page
ICT Business 2
Contents
Introduction......................................................................................................................................2
Research Methodology....................................................................................................................2
Results & Findings..........................................................................................................................3
Conclusion.....................................................................................................................................14
References......................................................................................................................................16
Document Page
ICT Business 3
ICT Business Analytics and Data Visualization
Introduction
Medical industry in Australia is growing at good rate over past few years due to use of
innovative technologies, skilled professionals, innovation, and strong healthcare system. At
global level small to medium sized companies owned around 80 percent share of the industry,
whereas, Multinational companies own around 20 percent (ATIC, 2020). The given case study is
about a medium sized organization that is running multiple clinics in the Australia. The
organization wants to attain continuous business growth by understanding different aspects
associated with its business such as areas of strengths and weaknesses, and the ways company
can utilizes its strengths to develop future strategy in order to achieve business growth (Bruhl,
2016). A comprehensive research and data analysis can help organization in understanding
various business aspects such as demographics of its customers, prescriptions of drugs, types of
illnesses, location-wise share of customers, etc. This business analytics report presents
descriptive, predictive, and prescriptive analysis of different business aspects, along with details
on business’ strengthens and weaknesses. The report also provides recommendations for the
organization to achieve business growth.
Research Methodology
The nature of study demands a details analysis of the customers that the organization is
catering (Render & Stair, 2017). In order to understand the areas of opportunities, it is imperative
for the organization to understand what types of customers are coming to the clinics, their
locations, demographics, and treatments that patients are receiving at the clinics. The primary
research is most suitable method that can help organization in understanding its customers and
Document Page
ICT Business 4
opportunities for growth (Barnett et al., 2017). In primary research study, data of the patients,
who have visited organization’s clinics in different locations, is compiled and analyzed. Every
clinic of the organization maintains the records of the patients who visit the clinic. This data can
provide a deep insight in the business and also can be very useful in understanding gaps and
opportunities for growth (Stock & Watson, 2015). Primary research is the best method for the
organization because it is conducted on the real data directly collected from the end-customers of
the organization. The quantity of data is also large; therefore, it will produce reliable and
significant findings.
Results & Findings
Descriptive
The descriptive analysis of the qualitative data is performed to assess the variables that
are most important for the business purpose (Bruhl, 2016). The top cities, ethnic background, age
group and gender are assessed for the patients. The table 1-4 and figures 1-4 demonstrates the
results of the descriptive analysis.
Hinchinbrook Glenfield Cartrwright Marrickville Marton alpine
0.00%
2.00%
4.00%
6.00%
8.00%
10.00%
12.00%
14.00%
16.00%
Patients' City
Total
City
Patients (%)
tabler-icon-diamond-filled.svg

Paraphrase This Document

Need a fresh take? Get an instant paraphrase of this document with our AI Paraphraser
Document Page
ICT Business 5
Figure 1: Top Cities
Table 1:Top Cities
City Patients %
Hinchinbrook 13.70%
Hoxton Park 9.00%
Middleton Grange 8.74%
Bossley Park 7.05%
West Hoxton 6.33%
Green Valley 3.68%
Liverpool 3.43%
Edensor Park 2.94%
Lurnea 2.65%
Prestons 2.25%
Total 59.77%
The table demonstrates that the top 10 cities from which the clinic receives patients are
responsible for 60% of the total number of patients the clinic has received. Hinchinbrook is the
top city from which the patients visit the clinic followed by Hoxton Park.
Document Page
ICT Business 6
Australian English Macedonian Mauritian Nigerian Yemeni
0.00%
5.00%
10.00%
15.00%
20.00%
25.00%
30.00%
35.00%
Patients' Ethnic Background
Total
Ethnic Background
Patients (%)
Figure 2: Ethnic Background
The table 2 shows the ethnic background of most of the patients that visit the clinic. As it
shows, almost 30% patients are Australian and 27% are Iraqi. Cumulatively, 57% of the patients
of the clinic are either Australian and Iraqi. It provides significant learning for the management
while formulating their target market promotions.
Table 2: Ethnic Background
Ethnic Background Patient %
Australian 29.53%
Iraqi 27.20%
Non Aboriginal/Torres Strait
Islander
15.60%
Assyrian 6.99%
Lebanese 2.59%
Fijian 1.59%
Document Page
ICT Business 7
Italian 1.23%
Iranian 1.07%
Uruguayan 0.93%
New Zealander 0.77%
Figure 3 shows the proportion of females and males as the patients. The number of
females is much higher than the male patients as shown in table 3. The clinic receives 66% of the
female patients.
1 2
0.00%
10.00%
20.00%
30.00%
40.00%
50.00%
60.00%
70.00%
Patients' Gender
Total
Gender
Patients (%)
Figure 3: Gender of Patients
Table 3: Gender Proportion
Gender Proportion
Female 65.55%
Male 34.45%
Grand
Total
100.00%
tabler-icon-diamond-filled.svg

Paraphrase This Document

Need a fresh take? Get an instant paraphrase of this document with our AI Paraphraser
Document Page
ICT Business 8
The age break-up of patients is shown in figure 4. The table 4 presents the top 10 ages of
the patients that visit the clinic. The patients age is well-distributed and the clinic caters to all age
groups equally.
3
41
49
45
34
59
60
40
35
72
62
6
22
73
66
23
68
64
14
79
91
81
86
92
96
0.00%
1.00%
2.00%
3.00%
Patients' Age
Total
Age
Patients (%)
Figure 4: Patients' Age
Age Proportion
3 2.71%
55 2.25%
33 2.13%
51 2.00%
41 1.92%
54 1.86%
39 1.85%
47 1.85%
49 1.85%
32 1.80%
The highest number of descriptions, reasons and drugs are shown below and these assists
in identifying the type of cases received by the clinic.
Table 4: Top 10 Description
Document Page
ICT Business 9
Descriptions Proportion
Surgery consultation, Level B 37.22%
Direct-Billing Incentive 29.99%
Surgery consultation, Level C 11.72%
Physiotherapy Service 1.92%
GP Mental Health Care Consultation 1.30%
505 - Subsequent Consultation 1.08%
Antenatal visit 0.81%
Surgery consultation, Level A 0.72%
As the above table shows, surgery consultation is the most popular description followed by
direct-billing incentive offered by the clinic. These two services are immensely popular and the
table 4 shows a major drop in the patients visit description proportion after surgery consultation.
Table 5: Top 10 Reasons
Reasons Proportion
Recall 3.62%
URTI, bacterial 2.58%
Reminder 2.58%
Check up 2.33%
Diabetes Mellitus, Type 2 2.07%
Bronchitis 1.98%
Hypertension 1.85%
Team Care Arrangements 1.84%
Pregnancy 1.79%
Care plan 1.79%
Document Page
ICT Business 10
Table 5 shows that the top reason for the patients to visit the clinic is the recall, which is the
check-up after major surgery or treatment.
The most popular drug prescribed in the clinic are;
Table 6: Top 10 Drugs
Drugs Proportion
Augmentin Duo Forte 875mg;125mg Tablet 3.89%
Keflex 500mg Capsule 3.75%
Amoxycillin 500mg Capsule 1.64%
Redipred 5mg/mL Solution 1.59%
Ventolin CFC-Free 100mcg/dose Inhaler 1.49%
Panadeine Forte 500mg;30mg Tablet 1.38%
Mobic 7.5mg Tablet 1.23%
Amoxycillin 250mg/5mL Syrup 1.11%
Roxithromycin 150mg Tablet 1.10%
Amoxil 500mg Capsule 1.09%
The most popular drug is Augmentin, prescribed 3.89% of the times. It relates well to the second
top reason for visiting the clinic, which is bacterial infection.
The chronic medicines are prescribed 52% of the times as shown in table 7.
Table 7: Type of Drugs
Medication
Type
Proportion
Antibiotic 11.59%
tabler-icon-diamond-filled.svg

Paraphrase This Document

Need a fresh take? Get an instant paraphrase of this document with our AI Paraphraser
Document Page
ICT Business 11
Chronic 52.11%
Pain Killer 36.30%
Grand Total 100.00%
From 2015-2019, the top cities have remained same but the proportion of the patients
from these cities have altered considerably. Figure 5 shows that the proportion of patients have
increased from Hinchinbrook over the years and has reduced from Bossley Park.
2015 2016 2017 2018 2019
0
500
1000
1500
2000
2500
3000
Yearwise Breakup for Highest City Patients Come
From
Bossley Park Hinchinbrook Hoxton Park
West Hoxton Middleton Grange
Year
Number of Patients
Figure 5: Year wise Breakup of Patients in Cities
The patients that make private payment are approximately 6%. Furthermore, the diabetics
patients at the clinic have a lower average proportion pf 2.22%.
Total number of diabetics’ patients (type 1 & 2) = 1587
Average number of diabetics’ patients (type 1 and 2) = 2.22%
Document Page
ICT Business 12
Figure 6: City wise Diabetes Patients
The figure 6 shows that Carramar, Guildford, East Lakes, Austral have less than 20% of
the diabetes patients.
Predictive Analysis
The annual income is predicted using the regression analysis. The results are shown
below;
chevron_up_icon
1 out of 19
circle_padding
hide_on_mobile
zoom_out_icon
[object Object]